Masters Finance Report: Comparative Analysis of CBA and ANZ Banks
VerifiedAdded on 2023/06/05
|20
|4276
|97
Report
AI Summary
This report provides a comparative financial analysis of the Commonwealth Bank of Australia (CBA) and the Australia and New Zealand Bank (ANZ). The analysis encompasses various aspects, including a description of the operations and comparative advantages of both companies, with an emphasis on their financial and non-financial aspects. The report employs ratio analysis, examining profitability, capital structure (leverage), and liquidity ratios over a three-year period to assess the financial positions of both banks. Furthermore, it investigates the movements of monthly share prices for both companies, identifying significant influencing factors. The report also calculates beta values and expected rates of return using the Capital Asset Pricing Model (CAPM) and analyses dividend policies. Finally, it concludes with a recommendation letter offering insights into which bank presents a more favorable investment opportunity.

Running Head: FINANCE FOR MASTERS 0
Finance for Masters
Finance for Masters
Paraphrase This Document
Need a fresh take? Get an instant paraphrase of this document with our AI Paraphraser
FINANCE FOR MASTERS 1
Table of Contents
Introduction................................................................................................................................2
Description of operation and comparative advantages of the two chosen companies...............2
Commonwealth Bank of Australia.........................................................................................2
Australia and New Zealand of Australia................................................................................3
Calculation of the performance ratios........................................................................................3
Profitability ratios...................................................................................................................4
Capital structure (leverage) ratios..........................................................................................7
Liquidity ratios.......................................................................................................................9
Analysis of monthly share prices movements..........................................................................12
Commonwealth Bank of Australia.......................................................................................12
Significant factors which may have influenced the share price...............................................14
CBA......................................................................................................................................14
ANZ bank.............................................................................................................................15
Calculation of beta values and expected Rates of Return using the CAPM............................15
Dividend policies.....................................................................................................................17
Recommendation letter............................................................................................................17
Conclusion................................................................................................................................18
References................................................................................................................................19
FINANCE FOR MASTERS 2
Introduction
The financial performance is the most efficient measure which is required by the investors as
well as the management of the company. This measure is basically used to identify the
position of the firm in terms of the financial decisions and the management aspect as well.
The report determines the analysis of the two Australian companies namely Commonwealth
Bank of Australia and Australia and New Zealand Bank of Australia (Australia and New
Zealand Bank of Australia, 2017). This report covers both the financial and non-financial
aspects of the position of the companies. Not only the ratio analysis is the measure that is
used for the purpose of the comparison but in addition to this, the share price movements
have also been placed as criteria for the past three years are compared with each other to give
the two way reflection. Later on the dividend policies are also analysed and at last a
recommendation letter has been provided which has answers to all the concerns of the
company and which company shall be selected from the given portfolio (Kimmel, Weygandt,
and Kieso, 2010).
Description of operation and comparative advantages of the two chosen companies
Commonwealth Bank of Australia
The Commonwealth Bank of Australia is one of the largest banks of Australia that is engaged
in the business of providing the services of the financial and the advisory services which will
help the client to deposit the amounts in the bank and earn interest. Apart from this the bank
is also involved with the other services such as management of funds, superannuation,
insurance, investment and the broking services (Krantz and Johnson, 2014). The company
reported a profit of A$9.881 billion in the financial year 2017 with the team of 51800
employees. The division is divided into the retail banking services, premium business
⊘ This is a preview!⊘
Do you want full access?
Subscribe today to unlock all pages.
Trusted by 1+ million students worldwide
FINANCE FOR MASTERS 3
services, wealth management and under the supervision of Matt Comyn. Further the company
has also introduced the online banking services through the Net bank. Net bank allows the
customers to transfer the funds and manage the accounts and promote the saving goals
(Commonwealth Bank of Australia, 2017).
Australia and New Zealand of Australia
It is the third largest bank in the Australia, after the Commonwealth Bank of Australia. The
ANZ also became the legal entity in the year 2000 and change to ANZ Bank in the year 2012.
Currently the ANZ bank is operating at profit of A$7.493 billion and the total revenue
reported by the company is A$21.071 billion. Moreover the ANZ also provides the technical
assistance in the areas of the risk management and retail and also enhances the business
banking. Further in the other segments the ANZ bank is involved in the international trade
facilities and also provides the flexible an d the competitive lending solutions. The bank is
also engaged in providing the corporate structure solutions (Australia and New Zealand Bank
of Australia, 2017).
The chosen companies are itself the biggest competitor of each other and therefore investing
the funds in one of the bank will ensure more benefits. If the performance is analysed of both
the companies than in recent financial year the Commonwealth bank of Australia has
reported an EBIT of 10686 and increased by 11% and on the contrary the ANZ bank has
reported an EBIT of 19% which is far better than the Commonwealth bank of Australia. The
ANZ banking is operating on heights and enjoying the benefits of the customer satisfaction
and the rate of interest set by the bank is high than the Commonwealth bank of Australia and
therefore it can be concluded that the ANZ bank is having an advantage over the
Commonwealth bank of Australia and potential investors as well as the shareholders can get
an ideas on which bank to invest in and for how much time period (Australia and New
Zealand Bank of Australia, 2017).
Paraphrase This Document
Need a fresh take? Get an instant paraphrase of this document with our AI Paraphraser
FINANCE FOR MASTERS 4
Calculation of the performance ratios
Ratio analysis is basically a tool which described the performance of the company in terms of
the different range of ratios to assess the financial position of the company in overall
scenario. The ratios eventually lead to the quick decision making and the proper judgement of
the performance of the company. In case of the Commonwealth bank of Australia and the
ANZ bank of Australia the following kind of ratios are calculated and outlined below for the
period of three years (Warren, Reeve and Duchac, 2011).
Profitability ratios
Profitability ratios are sued to evaluate the profitability of the company. The investors are
usually interested in these type of ratios so that they can have an understanding of how much
amount they’re getting in return in contrast to the amount invested in the particular banking
company. There are varieties of the ratios under the range of the profitability ratios such as
determined below (Warren and Jones, 2018).
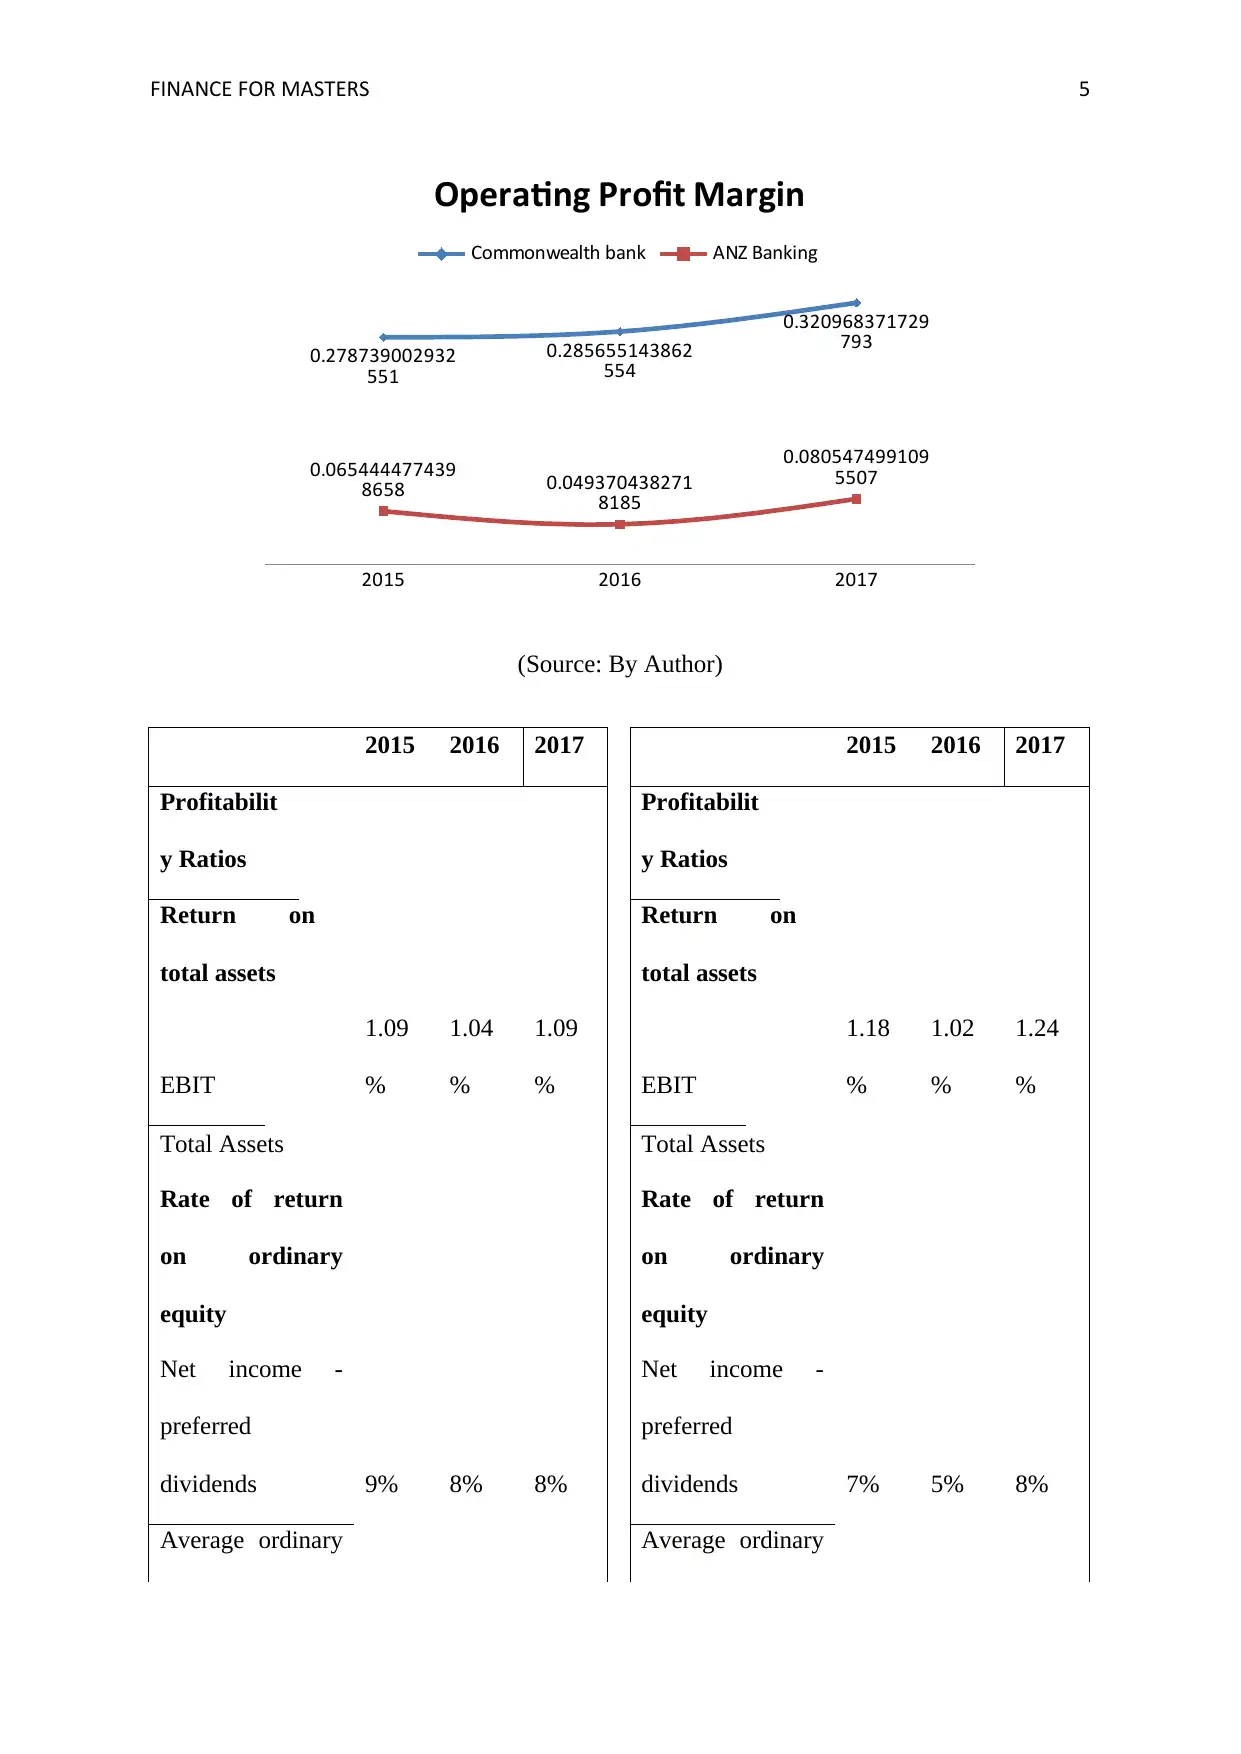
Net profit margin: the amount of the net profit which has been arrived is the total revenue
earned by the company after setting off all the operating as well as the non-operating
expenses. The amount of profit of both the banking companies is determined below in the
form of a table for the period of three years.
From the below table it can be analysed that the net profit margin of the CBA is 32% for the
year 2017 in comparison to the previous year where the margin was 29% and this is due to
the fall in revenue that the company reported a slow profit. The net profit margin of the ANZ
bank is outstanding in contrast to its previous year as it reached from 31% to 38% due to
decrease in the interest expense of the bank. Overall the interpretation can be made that the
ANZ is operating in a better manner (Vogel, 2014).
Calculation of the performance ratios
Ratio analysis is basically a tool which described the performance of the company in terms of
the different range of ratios to assess the financial position of the company in overall
scenario. The ratios eventually lead to the quick decision making and the proper judgement of
the performance of the company. In case of the Commonwealth bank of Australia and the
ANZ bank of Australia the following kind of ratios are calculated and outlined below for the
period of three years (Warren, Reeve and Duchac, 2011).
Profitability ratios
Profitability ratios are sued to evaluate the profitability of the company. The investors are
usually interested in these type of ratios so that they can have an understanding of how much
amount they’re getting in return in contrast to the amount invested in the particular banking
company. There are varieties of the ratios under the range of the profitability ratios such as
determined below (Warren and Jones, 2018).
Net profit margin: the amount of the net profit which has been arrived is the total revenue
earned by the company after setting off all the operating as well as the non-operating
expenses. The amount of profit of both the banking companies is determined below in the
form of a table for the period of three years.
From the below table it can be analysed that the net profit margin of the CBA is 32% for the
year 2017 in comparison to the previous year where the margin was 29% and this is due to
the fall in revenue that the company reported a slow profit. The net profit margin of the ANZ
bank is outstanding in contrast to its previous year as it reached from 31% to 38% due to
decrease in the interest expense of the bank. Overall the interpretation can be made that the
ANZ is operating in a better manner (Vogel, 2014).
FINANCE FOR MASTERS 5
2015 2016 2017
0.278739002932
551
0.285655143862
554
0.320968371729
793
0.065444477439
8658 0.049370438271
8185
0.080547499109
5507
Operating Profit Margin
Commonwealth bank ANZ Banking
(Source: By Author)
2015 2016 2017 2015 2016 2017
Profitabilit
y Ratios
Profitabilit
y Ratios
Return on
total assets
Return on
total assets
EBIT
1.09
%
1.04
%
1.09
% EBIT
1.18
%
1.02
%
1.24
%
Total Assets Total Assets
Rate of return
on ordinary
equity
Rate of return
on ordinary
equity
Net income -
preferred
dividends 9% 8% 8%
Net income -
preferred
dividends 7% 5% 8%
Average ordinary Average ordinary
⊘ This is a preview!⊘
Do you want full access?
Subscribe today to unlock all pages.
Trusted by 1+ million students worldwide
FINANCE FOR MASTERS 6
shareholders
equity
shareholders
equity
Net profit
Margin
Net profit
Margin
PAT *
100 28% 29% 32%
PAT *
100 34% 31% 38%
Sales Sales
Gross
profit
margin
Gross
profit
margin
Gross
profit 46% 50% 53%
Gross
profit 48% 50% 51%
Sales Sales
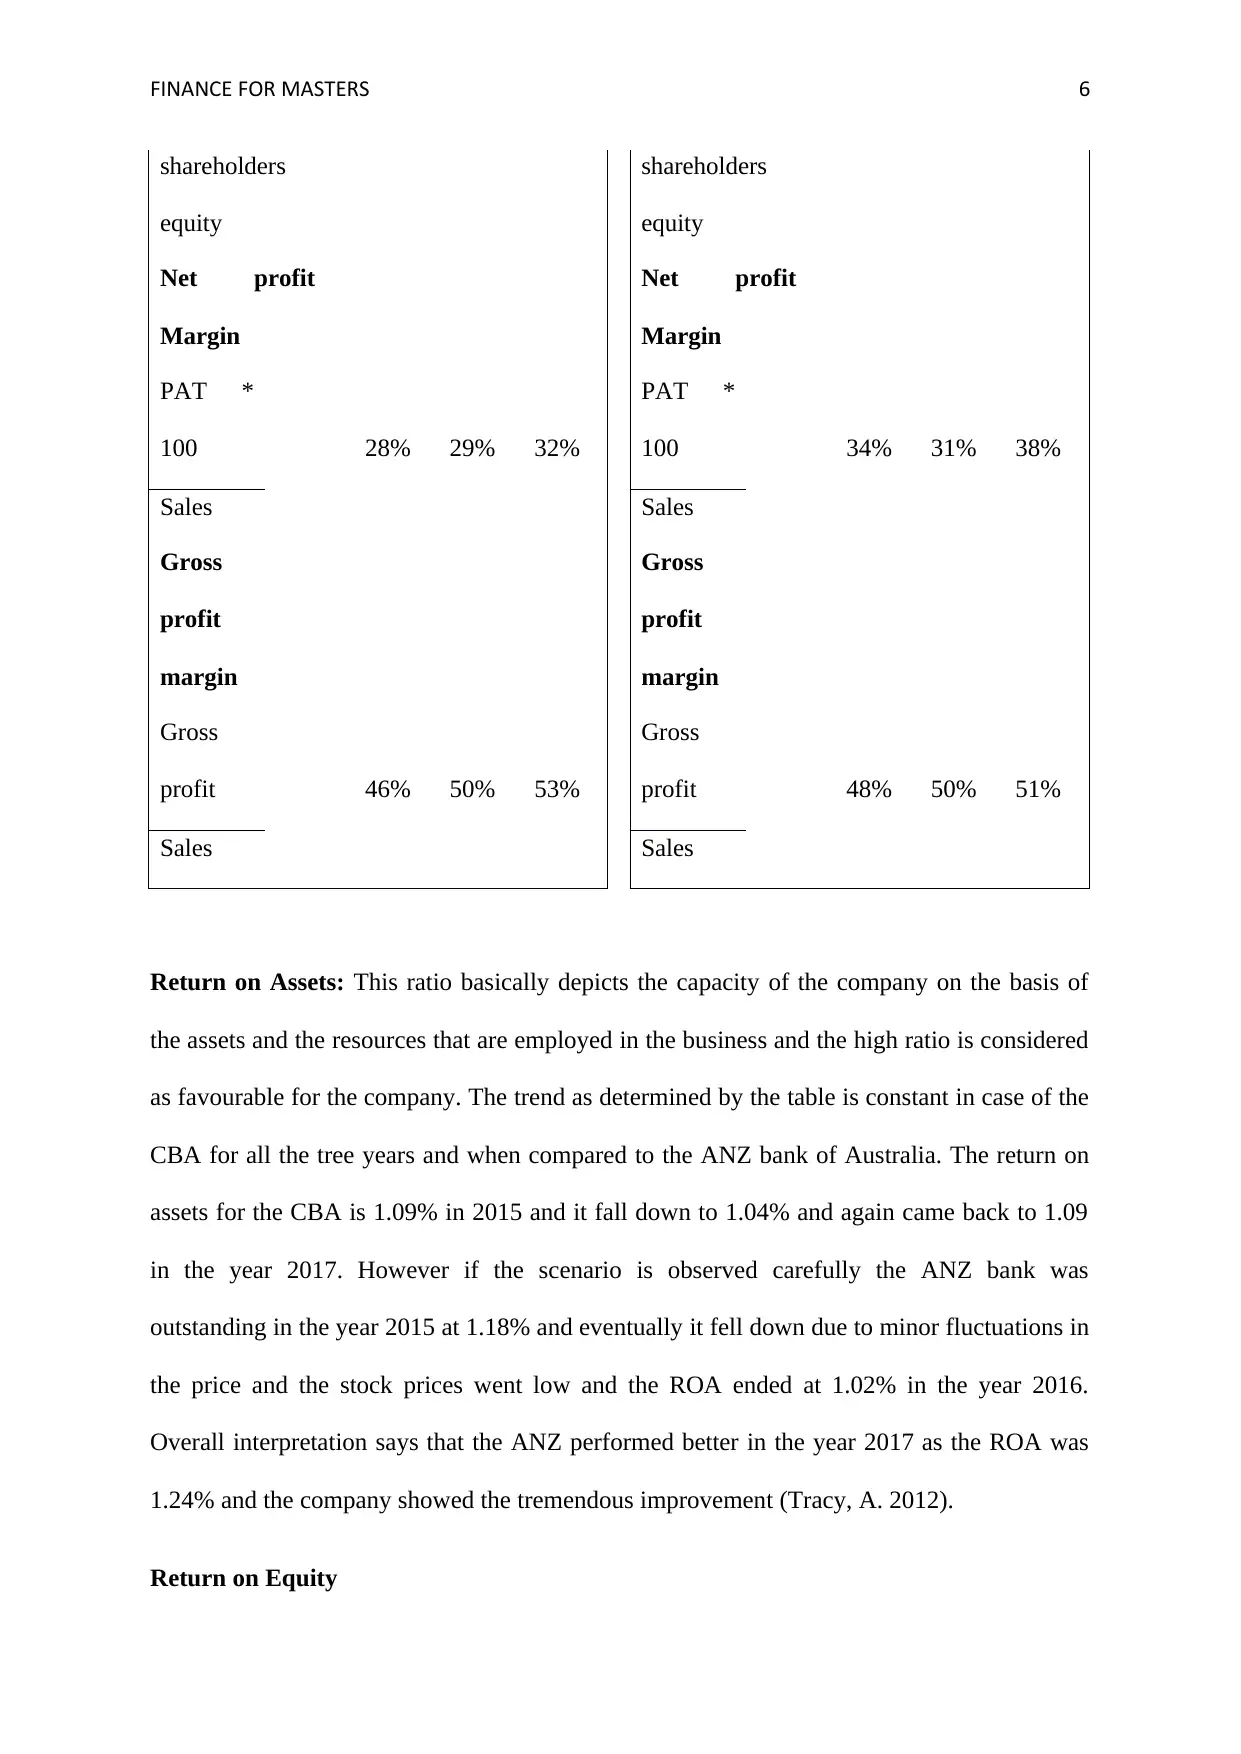
Return on Assets: This ratio basically depicts the capacity of the company on the basis of
the assets and the resources that are employed in the business and the high ratio is considered
as favourable for the company. The trend as determined by the table is constant in case of the
CBA for all the tree years and when compared to the ANZ bank of Australia. The return on
assets for the CBA is 1.09% in 2015 and it fall down to 1.04% and again came back to 1.09
in the year 2017. However if the scenario is observed carefully the ANZ bank was
outstanding in the year 2015 at 1.18% and eventually it fell down due to minor fluctuations in
the price and the stock prices went low and the ROA ended at 1.02% in the year 2016.
Overall interpretation says that the ANZ performed better in the year 2017 as the ROA was
1.24% and the company showed the tremendous improvement (Tracy, A. 2012).
Return on Equity
shareholders
equity
shareholders
equity
Net profit
Margin
Net profit
Margin
PAT *
100 28% 29% 32%
PAT *
100 34% 31% 38%
Sales Sales
Gross
profit
margin
Gross
profit
margin
Gross
profit 46% 50% 53%
Gross
profit 48% 50% 51%
Sales Sales
Return on Assets: This ratio basically depicts the capacity of the company on the basis of
the assets and the resources that are employed in the business and the high ratio is considered
as favourable for the company. The trend as determined by the table is constant in case of the
CBA for all the tree years and when compared to the ANZ bank of Australia. The return on
assets for the CBA is 1.09% in 2015 and it fall down to 1.04% and again came back to 1.09
in the year 2017. However if the scenario is observed carefully the ANZ bank was
outstanding in the year 2015 at 1.18% and eventually it fell down due to minor fluctuations in
the price and the stock prices went low and the ROA ended at 1.02% in the year 2016.
Overall interpretation says that the ANZ performed better in the year 2017 as the ROA was
1.24% and the company showed the tremendous improvement (Tracy, A. 2012).
Return on Equity
Paraphrase This Document
Need a fresh take? Get an instant paraphrase of this document with our AI Paraphraser
FINANCE FOR MASTERS 7
The return on equity showcases the capability of the company in offering the return on the
funds invested by the shareholders on their invested capital. If the profit is high the company
will generate the higher returns for the company.
Just like the return in assets the return on equity is also consistent in case of the
Commonwealth Bank of Australia at 8%, while from the table it can be observed that in case
of ANZ Bank the ratios are rising as the years are passing. In the year 2015 the ratio was 7%
and it fell down to 5% due to lower equity factor and more outsourcing for the debt. Further
in the year 2017 the return on equity went to 8% thereby surpassing the subsequent years
(Vogel, 2014).
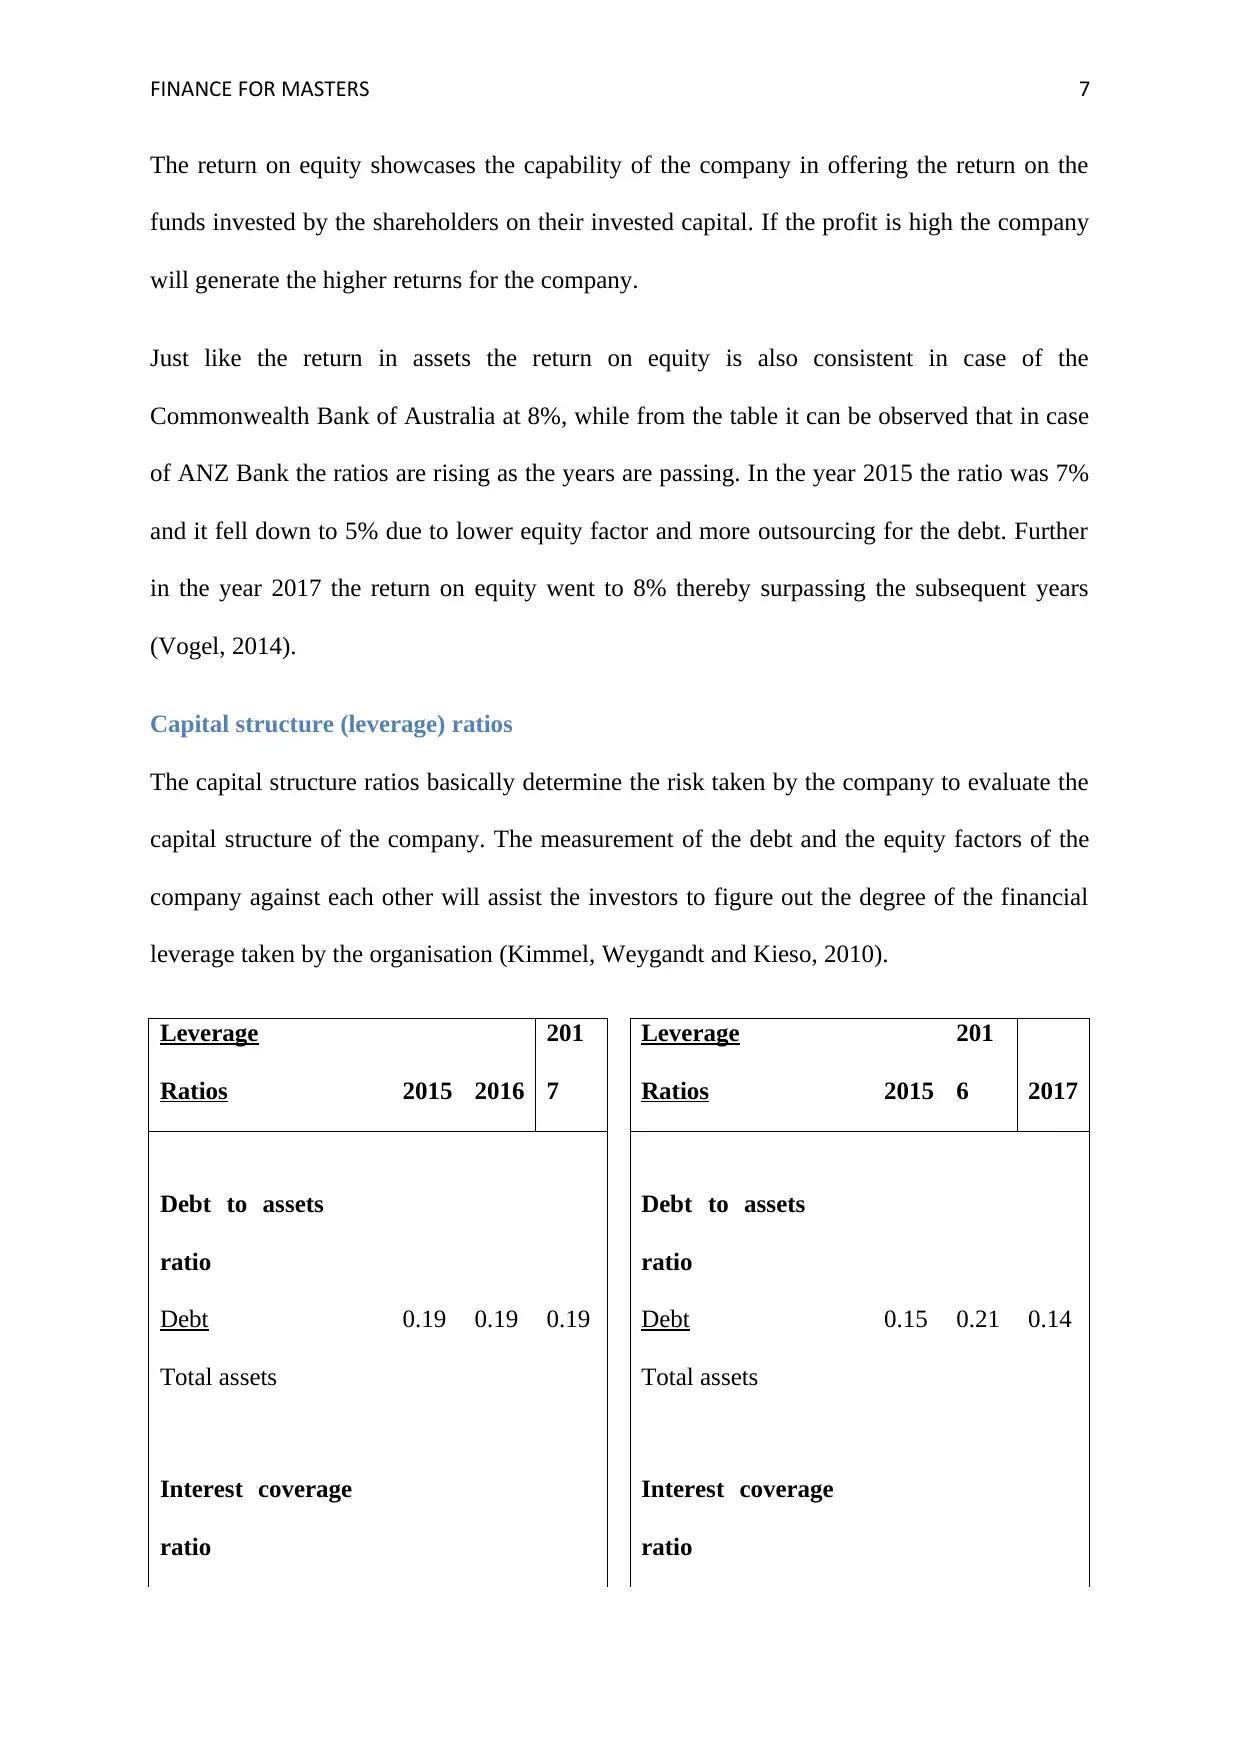
Capital structure (leverage) ratios
The capital structure ratios basically determine the risk taken by the company to evaluate the
capital structure of the company. The measurement of the debt and the equity factors of the
company against each other will assist the investors to figure out the degree of the financial
leverage taken by the organisation (Kimmel, Weygandt and Kieso, 2010).
Leverage
Ratios 2015 2016
201
7
Leverage
Ratios 2015
201
6 2017
Debt to assets
ratio
Debt to assets
ratio
Debt 0.19 0.19 0.19 Debt 0.15 0.21 0.14
Total assets Total assets
Interest coverage
ratio
Interest coverage
ratio
The return on equity showcases the capability of the company in offering the return on the
funds invested by the shareholders on their invested capital. If the profit is high the company
will generate the higher returns for the company.
Just like the return in assets the return on equity is also consistent in case of the
Commonwealth Bank of Australia at 8%, while from the table it can be observed that in case
of ANZ Bank the ratios are rising as the years are passing. In the year 2015 the ratio was 7%
and it fell down to 5% due to lower equity factor and more outsourcing for the debt. Further
in the year 2017 the return on equity went to 8% thereby surpassing the subsequent years
(Vogel, 2014).
Capital structure (leverage) ratios
The capital structure ratios basically determine the risk taken by the company to evaluate the
capital structure of the company. The measurement of the debt and the equity factors of the
company against each other will assist the investors to figure out the degree of the financial
leverage taken by the organisation (Kimmel, Weygandt and Kieso, 2010).
Leverage
Ratios 2015 2016
201
7
Leverage
Ratios 2015
201
6 2017
Debt to assets
ratio
Debt to assets
ratio
Debt 0.19 0.19 0.19 Debt 0.15 0.21 0.14
Total assets Total assets
Interest coverage
ratio
Interest coverage
ratio
FINANCE FOR MASTERS 8
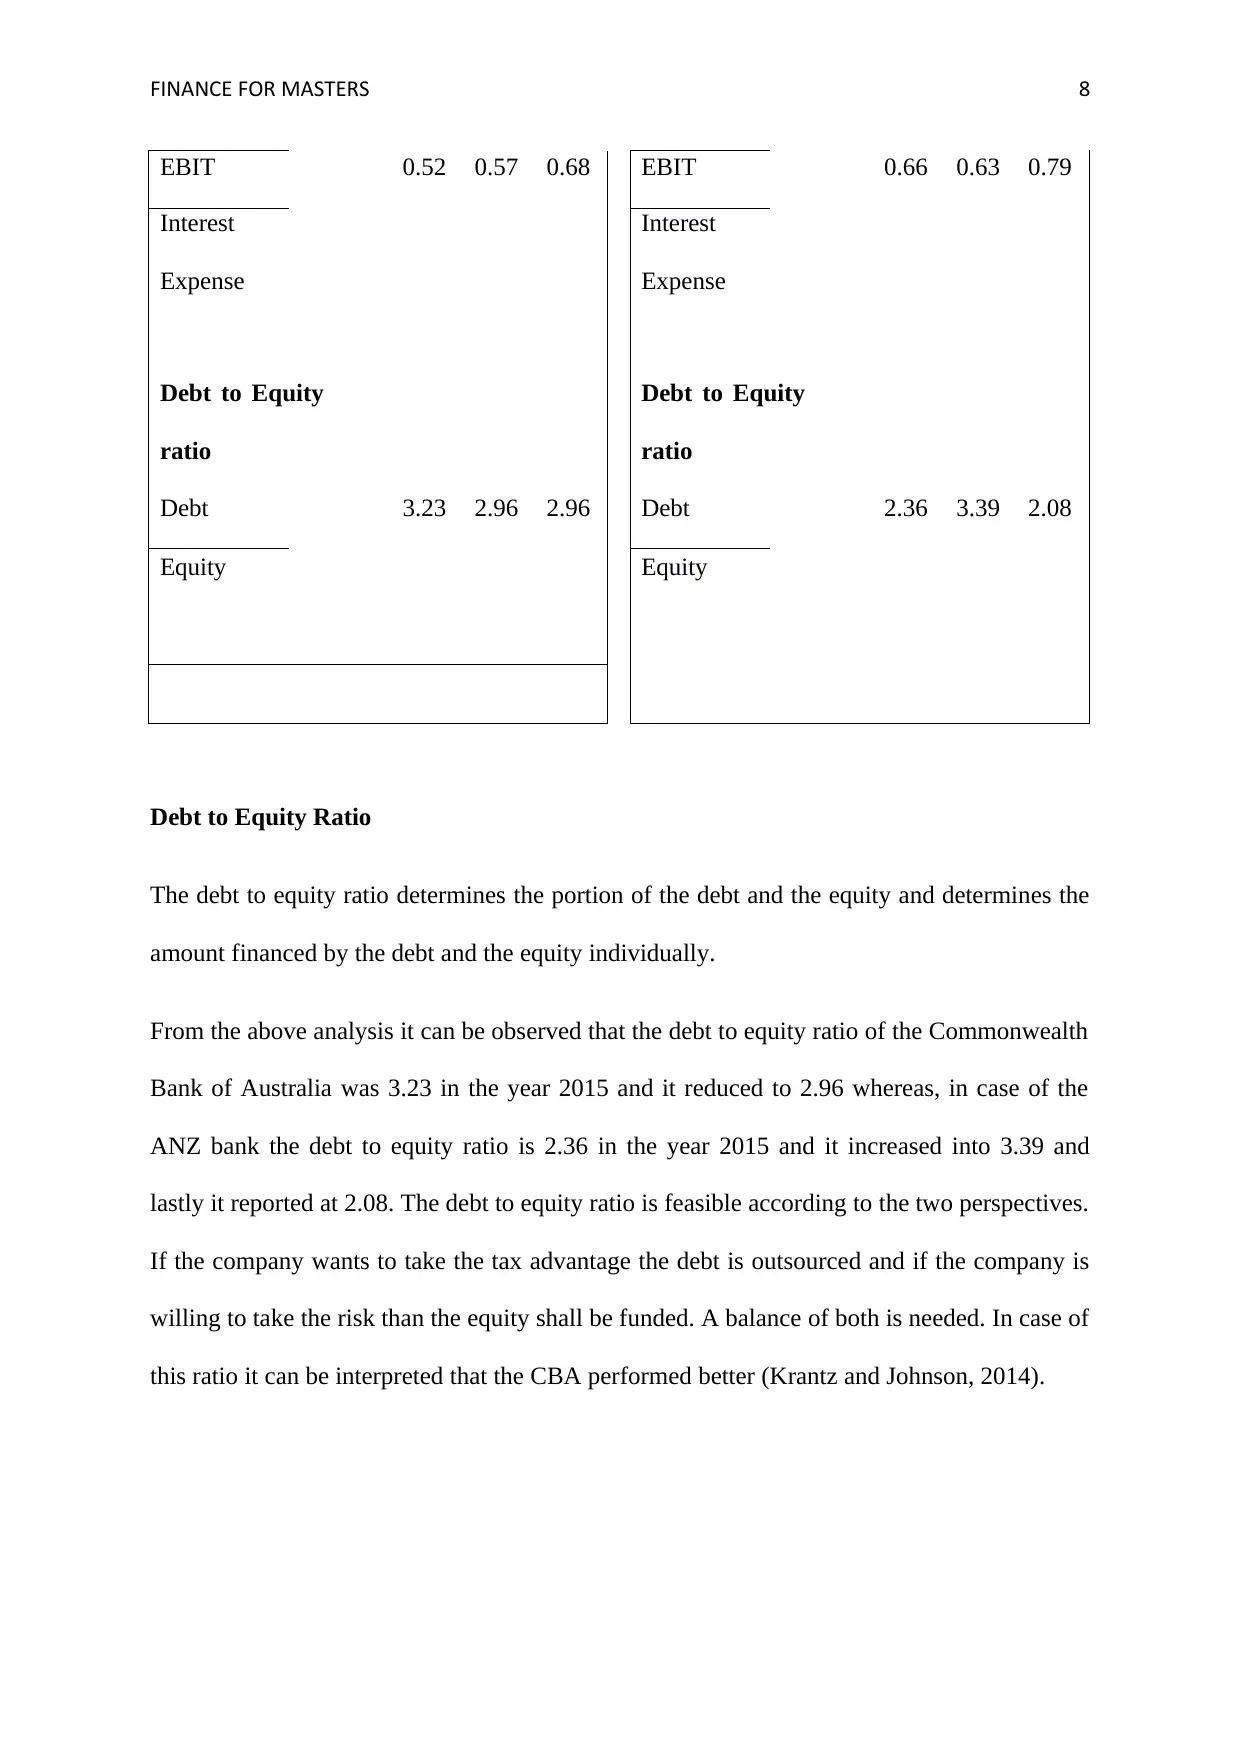
EBIT 0.52 0.57 0.68 EBIT 0.66 0.63 0.79
Interest
Expense
Interest
Expense
Debt to Equity
ratio
Debt to Equity
ratio
Debt 3.23 2.96 2.96 Debt 2.36 3.39 2.08
Equity Equity
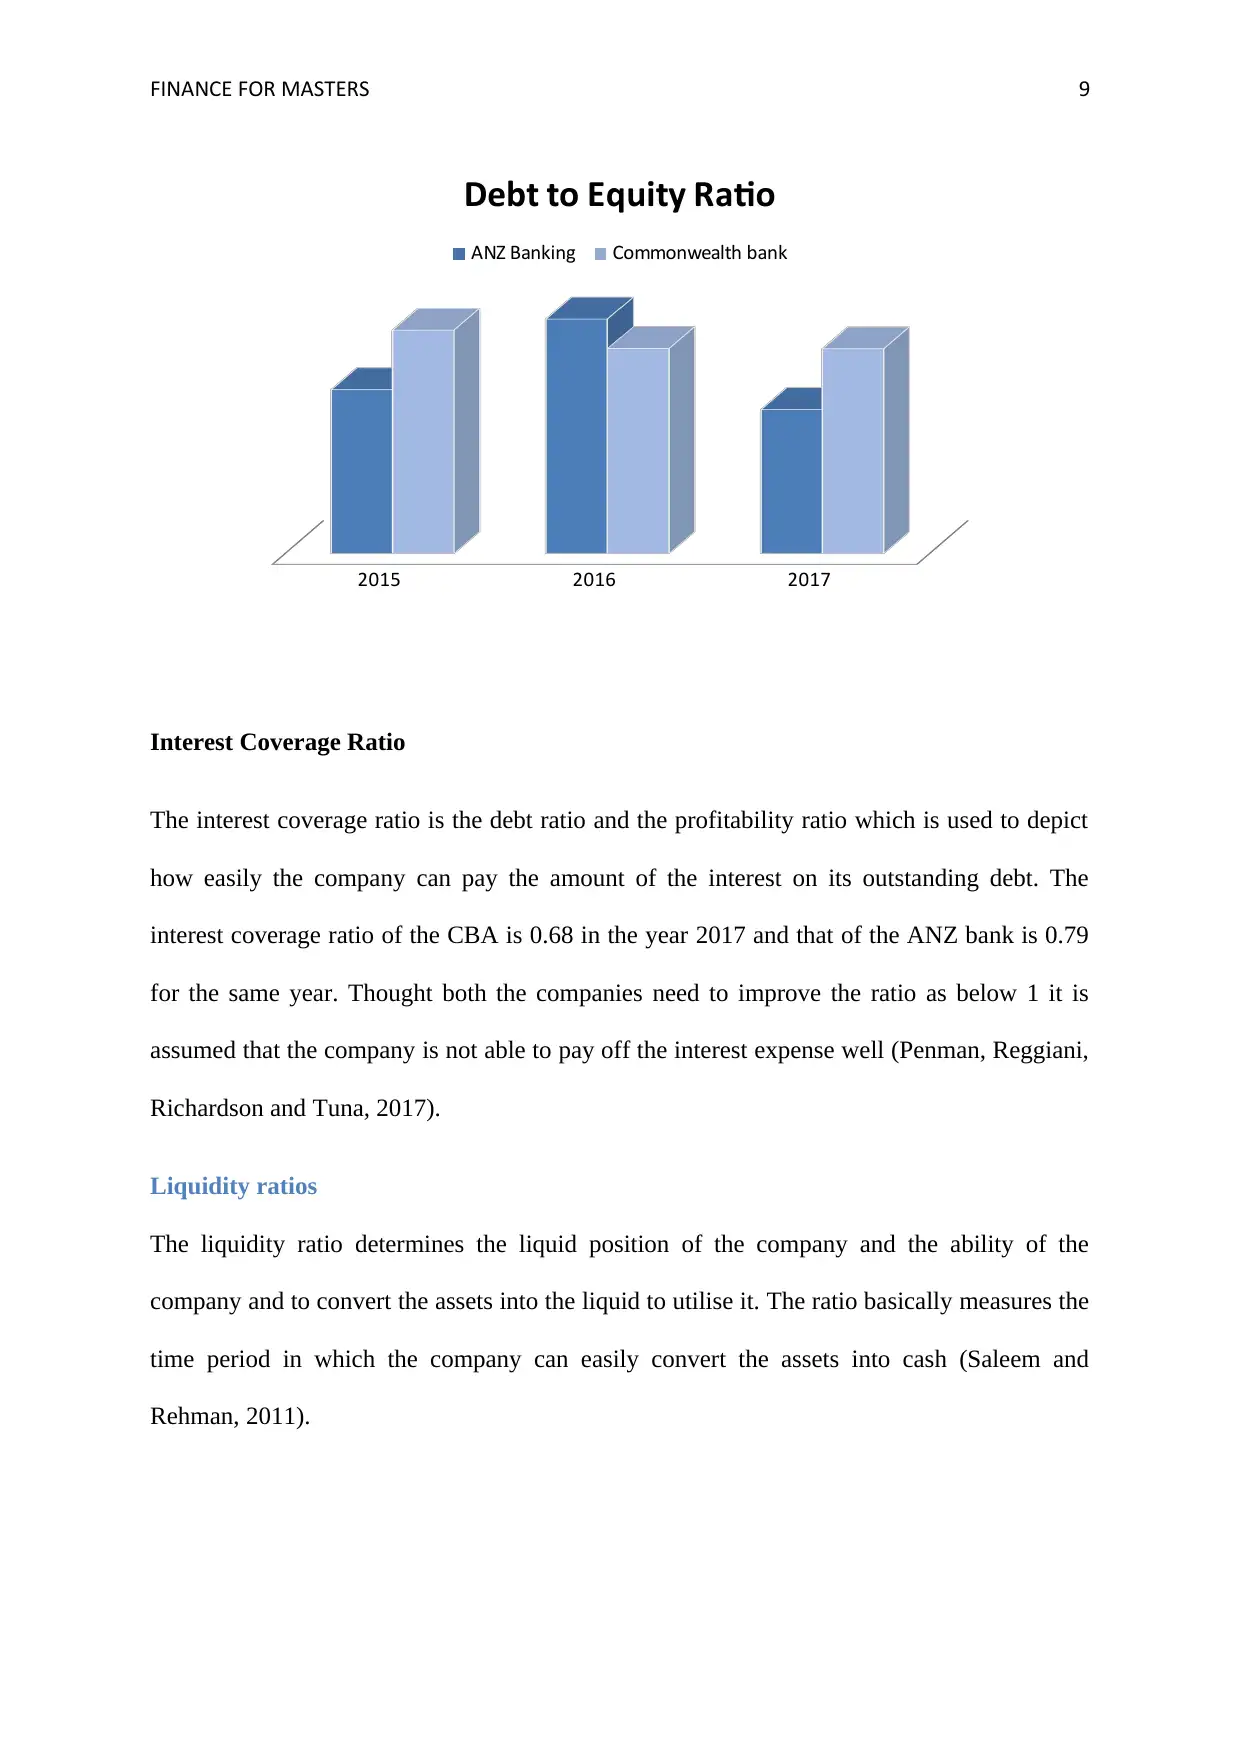
Debt to Equity Ratio
The debt to equity ratio determines the portion of the debt and the equity and determines the
amount financed by the debt and the equity individually.
From the above analysis it can be observed that the debt to equity ratio of the Commonwealth
Bank of Australia was 3.23 in the year 2015 and it reduced to 2.96 whereas, in case of the
ANZ bank the debt to equity ratio is 2.36 in the year 2015 and it increased into 3.39 and
lastly it reported at 2.08. The debt to equity ratio is feasible according to the two perspectives.
If the company wants to take the tax advantage the debt is outsourced and if the company is
willing to take the risk than the equity shall be funded. A balance of both is needed. In case of
this ratio it can be interpreted that the CBA performed better (Krantz and Johnson, 2014).
EBIT 0.52 0.57 0.68 EBIT 0.66 0.63 0.79
Interest
Expense
Interest
Expense
Debt to Equity
ratio
Debt to Equity
ratio
Debt 3.23 2.96 2.96 Debt 2.36 3.39 2.08
Equity Equity
Debt to Equity Ratio
The debt to equity ratio determines the portion of the debt and the equity and determines the
amount financed by the debt and the equity individually.
From the above analysis it can be observed that the debt to equity ratio of the Commonwealth
Bank of Australia was 3.23 in the year 2015 and it reduced to 2.96 whereas, in case of the
ANZ bank the debt to equity ratio is 2.36 in the year 2015 and it increased into 3.39 and
lastly it reported at 2.08. The debt to equity ratio is feasible according to the two perspectives.
If the company wants to take the tax advantage the debt is outsourced and if the company is
willing to take the risk than the equity shall be funded. A balance of both is needed. In case of
this ratio it can be interpreted that the CBA performed better (Krantz and Johnson, 2014).
⊘ This is a preview!⊘
Do you want full access?
Subscribe today to unlock all pages.
Trusted by 1+ million students worldwide
FINANCE FOR MASTERS 9
2015 2016 2017
Debt to Equity Ratio
ANZ Banking Commonwealth bank
Interest Coverage Ratio
The interest coverage ratio is the debt ratio and the profitability ratio which is used to depict
how easily the company can pay the amount of the interest on its outstanding debt. The
interest coverage ratio of the CBA is 0.68 in the year 2017 and that of the ANZ bank is 0.79
for the same year. Thought both the companies need to improve the ratio as below 1 it is
assumed that the company is not able to pay off the interest expense well (Penman, Reggiani,
Richardson and Tuna, 2017).
Liquidity ratios
The liquidity ratio determines the liquid position of the company and the ability of the
company and to convert the assets into the liquid to utilise it. The ratio basically measures the
time period in which the company can easily convert the assets into cash (Saleem and
Rehman, 2011).
Paraphrase This Document
Need a fresh take? Get an instant paraphrase of this document with our AI Paraphraser
FINANCE FOR MASTERS 10
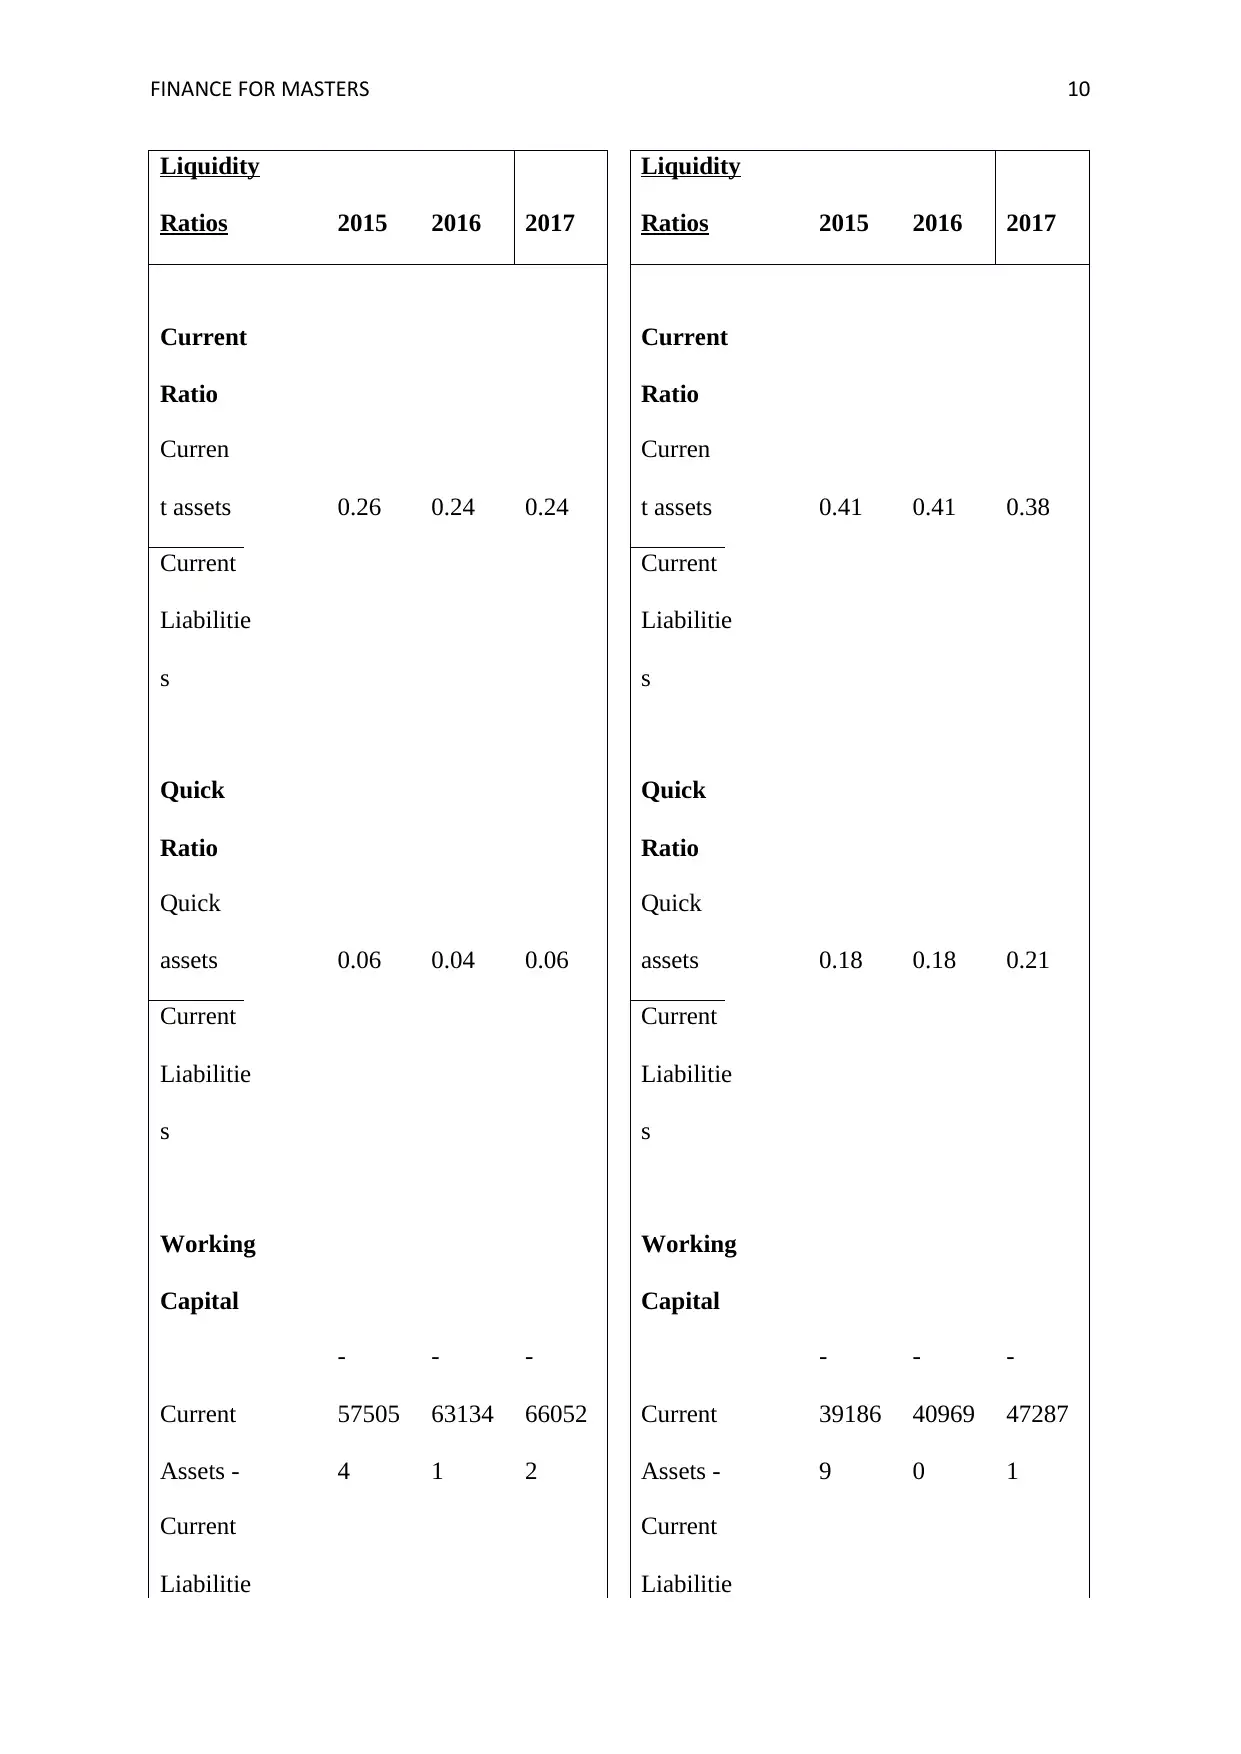
Liquidity
Ratios 2015 2016 2017
Liquidity
Ratios 2015 2016 2017
Current
Ratio
Current
Ratio
Curren
t assets 0.26 0.24 0.24
Curren
t assets 0.41 0.41 0.38
Current
Liabilitie
s
Current
Liabilitie
s
Quick
Ratio
Quick
Ratio
Quick
assets 0.06 0.04 0.06
Quick
assets 0.18 0.18 0.21
Current
Liabilitie
s
Current
Liabilitie
s
Working
Capital
Working
Capital
Current
Assets -
-
57505
4
-
63134
1
-
66052
2
Current
Assets -
-
39186
9
-
40969
0
-
47287
1
Current
Liabilitie
Current
Liabilitie
Liquidity
Ratios 2015 2016 2017
Liquidity
Ratios 2015 2016 2017
Current
Ratio
Current
Ratio
Curren
t assets 0.26 0.24 0.24
Curren
t assets 0.41 0.41 0.38
Current
Liabilitie
s
Current
Liabilitie
s
Quick
Ratio
Quick
Ratio
Quick
assets 0.06 0.04 0.06
Quick
assets 0.18 0.18 0.21
Current
Liabilitie
s
Current
Liabilitie
s
Working
Capital
Working
Capital
Current
Assets -
-
57505
4
-
63134
1
-
66052
2
Current
Assets -
-
39186
9
-
40969
0
-
47287
1
Current
Liabilitie
Current
Liabilitie
FINANCE FOR MASTERS 11
s s
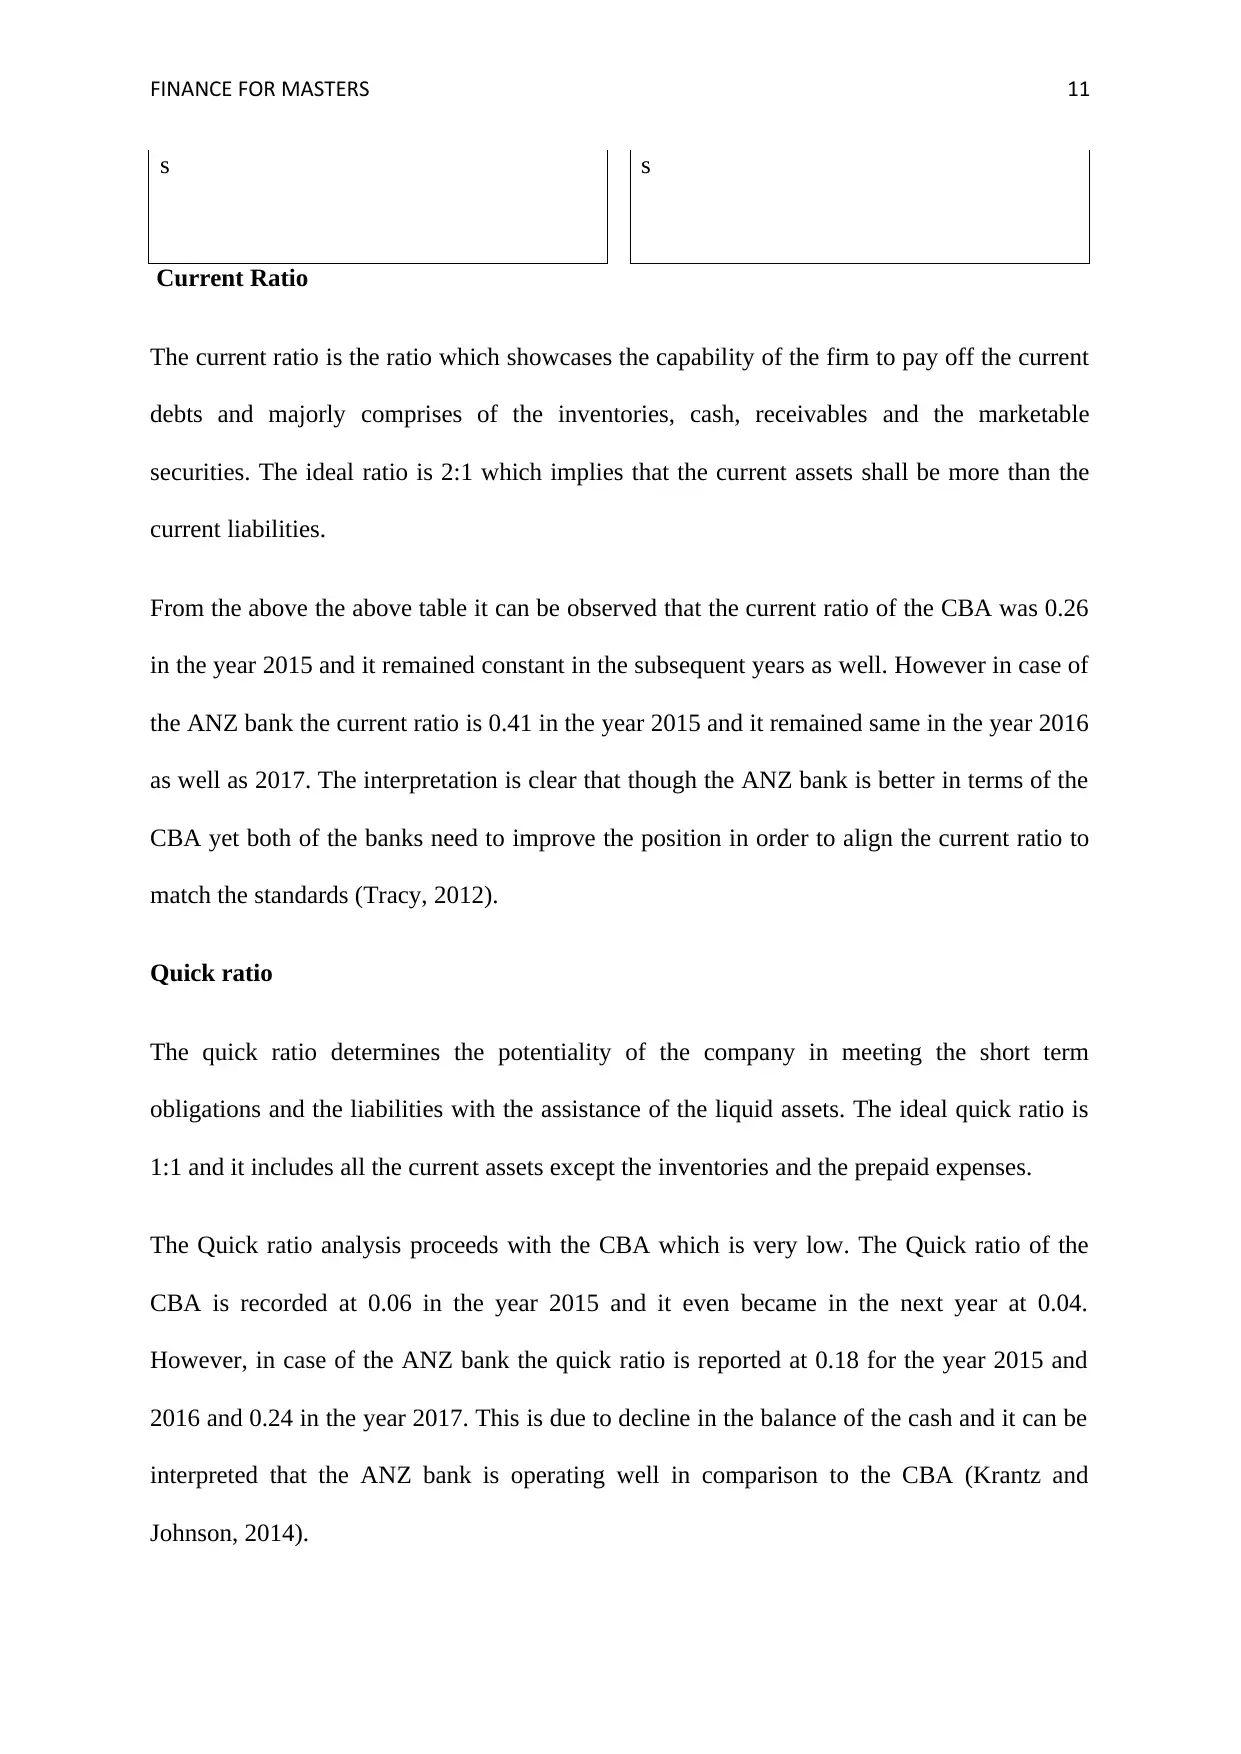
Current Ratio
The current ratio is the ratio which showcases the capability of the firm to pay off the current
debts and majorly comprises of the inventories, cash, receivables and the marketable
securities. The ideal ratio is 2:1 which implies that the current assets shall be more than the
current liabilities.
From the above the above table it can be observed that the current ratio of the CBA was 0.26
in the year 2015 and it remained constant in the subsequent years as well. However in case of
the ANZ bank the current ratio is 0.41 in the year 2015 and it remained same in the year 2016
as well as 2017. The interpretation is clear that though the ANZ bank is better in terms of the
CBA yet both of the banks need to improve the position in order to align the current ratio to
match the standards (Tracy, 2012).
Quick ratio
The quick ratio determines the potentiality of the company in meeting the short term
obligations and the liabilities with the assistance of the liquid assets. The ideal quick ratio is
1:1 and it includes all the current assets except the inventories and the prepaid expenses.
The Quick ratio analysis proceeds with the CBA which is very low. The Quick ratio of the
CBA is recorded at 0.06 in the year 2015 and it even became in the next year at 0.04.
However, in case of the ANZ bank the quick ratio is reported at 0.18 for the year 2015 and
2016 and 0.24 in the year 2017. This is due to decline in the balance of the cash and it can be
interpreted that the ANZ bank is operating well in comparison to the CBA (Krantz and
Johnson, 2014).
s s
Current Ratio
The current ratio is the ratio which showcases the capability of the firm to pay off the current
debts and majorly comprises of the inventories, cash, receivables and the marketable
securities. The ideal ratio is 2:1 which implies that the current assets shall be more than the
current liabilities.
From the above the above table it can be observed that the current ratio of the CBA was 0.26
in the year 2015 and it remained constant in the subsequent years as well. However in case of
the ANZ bank the current ratio is 0.41 in the year 2015 and it remained same in the year 2016
as well as 2017. The interpretation is clear that though the ANZ bank is better in terms of the
CBA yet both of the banks need to improve the position in order to align the current ratio to
match the standards (Tracy, 2012).
Quick ratio
The quick ratio determines the potentiality of the company in meeting the short term
obligations and the liabilities with the assistance of the liquid assets. The ideal quick ratio is
1:1 and it includes all the current assets except the inventories and the prepaid expenses.
The Quick ratio analysis proceeds with the CBA which is very low. The Quick ratio of the
CBA is recorded at 0.06 in the year 2015 and it even became in the next year at 0.04.
However, in case of the ANZ bank the quick ratio is reported at 0.18 for the year 2015 and
2016 and 0.24 in the year 2017. This is due to decline in the balance of the cash and it can be
interpreted that the ANZ bank is operating well in comparison to the CBA (Krantz and
Johnson, 2014).
⊘ This is a preview!⊘
Do you want full access?
Subscribe today to unlock all pages.
Trusted by 1+ million students worldwide
1 out of 20
Related Documents


Your All-in-One AI-Powered Toolkit for Academic Success.
+13062052269
info@desklib.com
Available 24*7 on WhatsApp / Email
![[object Object]](/_next/static/media/star-bottom.7253800d.svg)
Unlock your academic potential
Copyright © 2020–2026 A2Z Services. All Rights Reserved. Developed and managed by ZUCOL.