CBMS 825 Chemical Analysis II: GC-MS Analysis of Fat in Snack Foods

Verified

Added on  2023/04/11

|26
|2660
|70
Practical Assignment
AI Summary
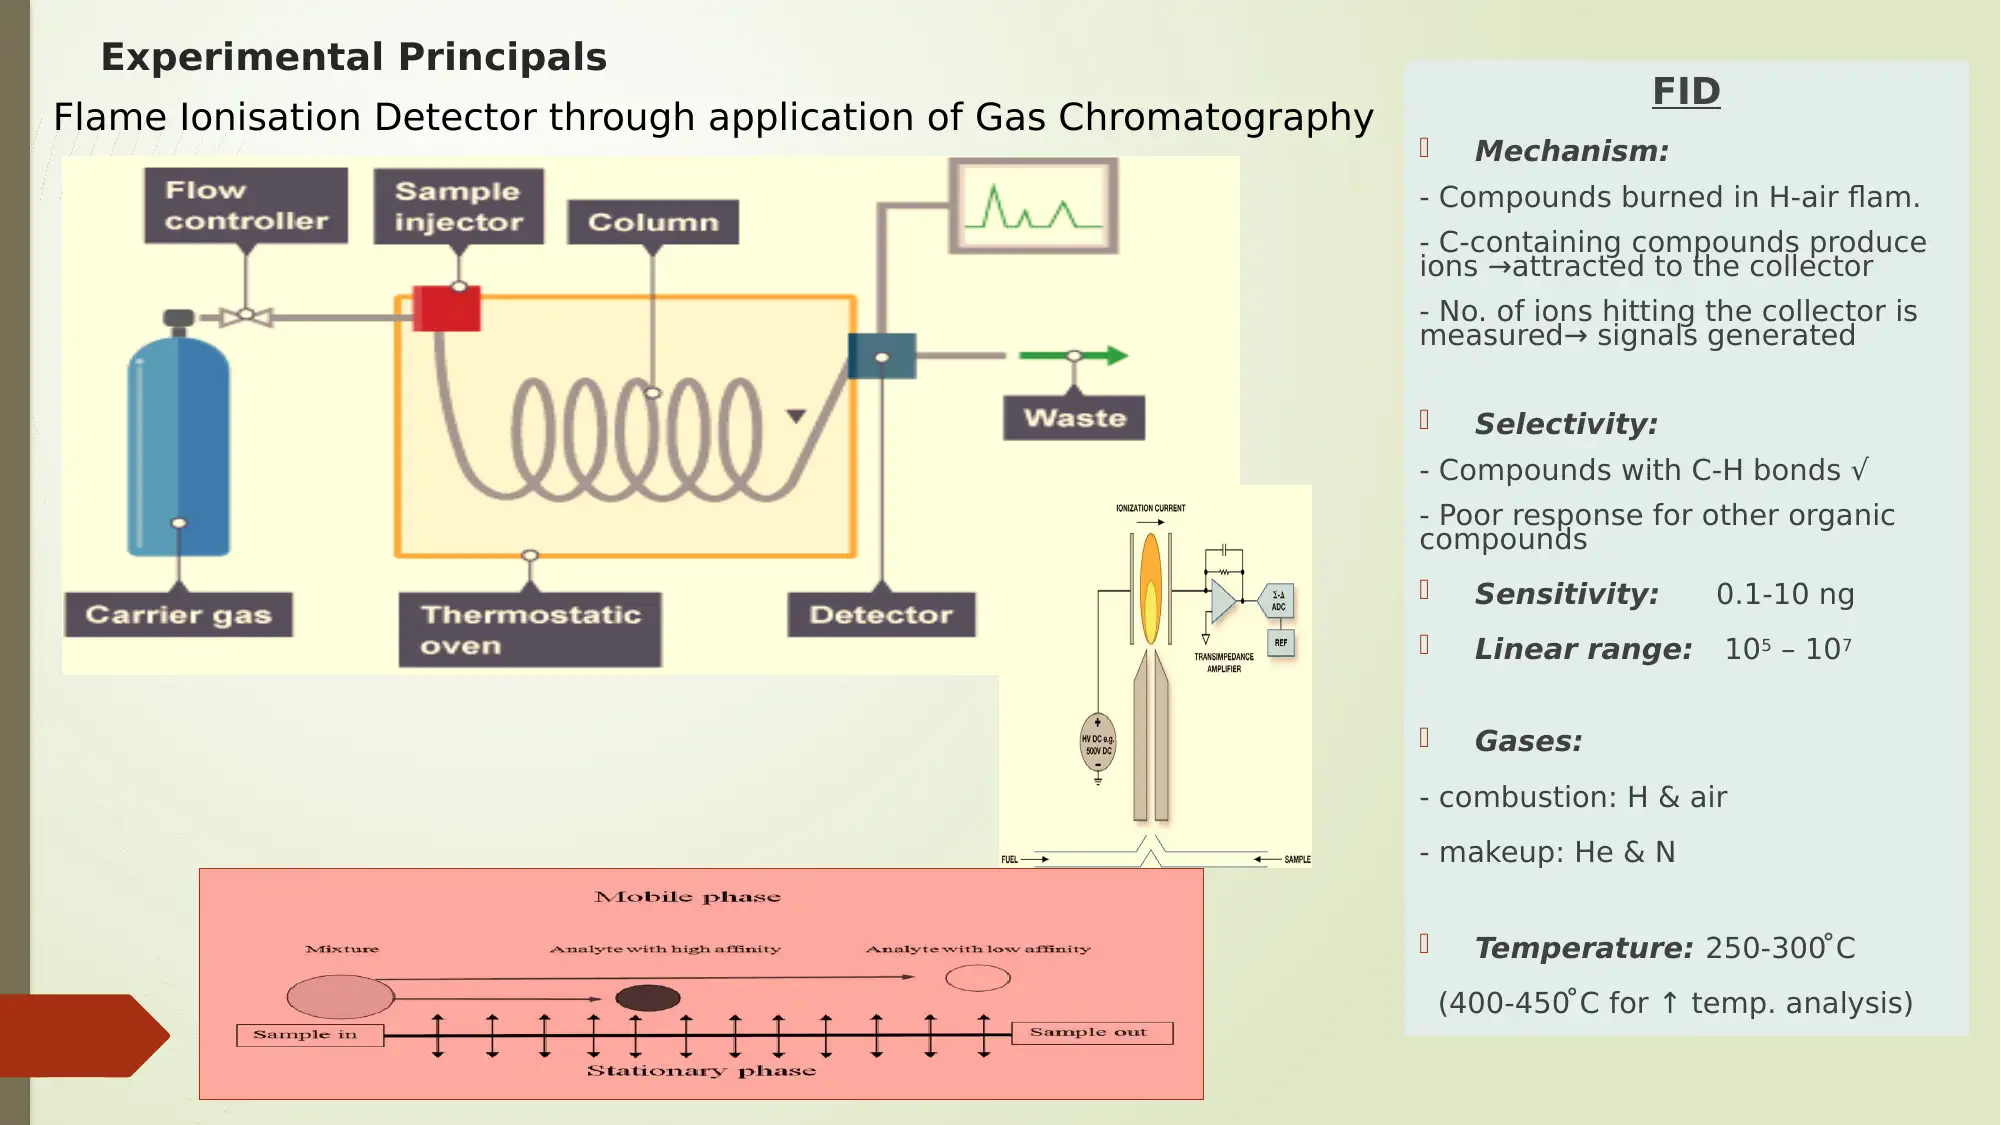
This experiment focuses on analyzing the types and amounts of fat present in snack foods using gas chromatography (GC) and gas chromatography-mass spectrometry (GC-MS). The experiment involves the preparation of fatty acid methyl esters (FAMEs) from snack foods like Twisties and Pretzels through a derivatization process. The FAMEs are then analyzed using both GC and GC-MS to identify and quantify different fatty acids. The report includes a comparison of the two methods, calculations of relative response factors (RRF), and statistical analysis to determine significant differences in saturated FAMEs. The limit of detection (LOD) for C12:0 is also calculated for both GC and GC-MS. The results provide insights into the fat composition of the selected snack foods, highlighting the levels of saturated, monounsaturated, and polyunsaturated fats.
tabler-icon-diamond-filled.svg

Contribute Materials

Your contribution can guide someone’s learning journey. Share your documents today.
Document Page
Lab Demonstrator- Ben Ford
Presented by:
Abrar Taif (44182562)
CBMS 825 Chemical Analysis II
Analysis of Fat in Snack Foods by Gas Chromatography and
Gas
Chromatography / Mass Spectrometry
Experiment 3
tabler-icon-diamond-filled.svg

Secure Best Marks with AI Grader

Need help grading? Try our AI Grader for instant feedback on your assignments.
Document Page
Experimental
Outline Introduction
Experimental Principals
Procedure
Results and Discussion
Conclusion
Learning Outcomes
References
Document Page
Introduction
Snack foods that contain large amount of fat is of great significant health concern
Saturated fats increases blood cholesterol in humans1
High LDL level associated with increased risk of heart disease and stroke in humans1
Perception of Saturated and Unsaturated fats2
Saturated Fats have single C-C bond2
Unsaturated Fats have one more more double C=C bond2
The principles involving the application of gas chromatography (GC) and gas
chromatography/mass spectrometry (GC-MS)
The investigation of operational differences between flame ionisation detector that
implements gas chromatography and mass spectrometer detector that implements gas
chromatography/mass spectrometer.
The significance of derivation technique of fatty acid in snacks while applying gas
chromatography (GC)
Document Page
AIM
The aim of the experiment is to analyze
types of fat in snack foods by using gas
chromatography and gas chromatography/
mass spectrometry.
tabler-icon-diamond-filled.svg

Secure Best Marks with AI Grader

Need help grading? Try our AI Grader for instant feedback on your assignments.
Document Page
Experimental Principals
Flame Ionisation Detector through application of Gas Chromatography FID
Mechanism:
- Compounds burned in H-air flam.
- C-containing compounds produce
ions →attracted to the collector
- No. of ions hitting the collector is
measured→ signals generated
Selectivity:
- Compounds with C-H bonds √
- Poor response for other organic
compounds
Sensitivity: 0.1-10 ng
Linear range: 105 – 107
Gases:
- combustion: H & air
- makeup: He & N
Temperature: 250-300 ̊ C
(400-450 ̊ C for ↑ temp. analysis)
Document Page
Principle of GC-MS using mass spectrometer detector
Document Page
Comparison between GC using flame ionisation
detector and GC-MS using mass spectrometer
detector
Gas Chromatogrpahy (GC) Gas Chromatography-Mass
Spectrometer (GC-MS)
Carrier gas. –Hydrogen
(H2)
Ion Source
Injector Injector
Column Electromagnet
Detector (FID Detector (MS at 74 m/z)
Gas Chromatography Mass Spectrometer
tabler-icon-diamond-filled.svg

Paraphrase This Document

Need a fresh take? Get an instant paraphrase of this document with our AI Paraphraser
Document Page
Derivatisation technique of fatty
acid when using GC
For analysis by GC & GC-MS, analyte must be volatile.
Fat and oil triglycerides: Not very volatile. Large molecules (800-1000 mw).
Methods for the conversion of fats and oils into fatty acid methyl esters:
Acid or base-catalysed trans-esterification where reaction with ethanol in the presence of acid or base catalyst directly (boron
trifluoride/methanol) directly convert triglyceride to fatty acid methyl esters. The acid catalyst is the lewis acid BF3.
Saponification or acid hydrolysis or enzymatic hydrolysis of the triglacyride to releas fatty acid then by acid catalyzed esterification to give
FAMEs.
TG
hydrolysis
fatty acid
Derivatisation
Fatty acid
methyl esters
(FAME)
Analysis by GC or GC-MS
Document Page
Procedure
Preparation of FAMEs from fats in snack food
Two snack foods were selected to be analyzed using GC and GC/MS. Twisties (contains 23.3 g/ 100g total fat) and
Pretzels (contains 3.6 g / 100 g total fat).
Approximately 5 g were crushed using clean mortar and pestle.
The nutritional information on the packing was examined for both snack foods and the aliquot mass was calculated
using the formula
Aliquotmass = (15000 / fat in products g/100 g) mg
Amount of 643.78 mg of Twisties and 4167.7mg of Pretzels were taken after crushing the sample and aliquoting them
Internal standard (tridodecanoin - C12:0 triglyceride) was added.
Aa volume of 20 mL of 1:1 (v/v) chloroform / methanol was added and the mixture was ultrasonicate for 5 minutes.
The snack foods were Filtered from the1:1 (v/v) chloroform / methanol solution using a Buchner funnel and the beaker
was washed with 5 mL of 1:1 (v/v) chloroform / methanol.
Remove 1 mL of the filtered and place in clean scintillation vial.
The sample was evaporated to dryness (oil form) by adding 2 mL of BF3/ methanol derivatisation reagent to the vial ,
the vial was caped and the mixture was shook vigorously.
The mixture was heated to 60 °C in the oven for 10 minutes and shaking of the mixture was maitained every 2 minutes.
The vial was removed from the oven and left to cool down. Then, 5 mL of hexanes and 5 mL of saturated NaCl were
added to the vial.
The vial was caped and the mixture was shook vigorously for a minute.
After separation of the two phases, 1 mL of the top layer was removed using pasture pipette and transfer into clean
vial. This is the sample to be analyzed contains methyl ester derivatives.
The computer was prepared to collect data and 0.5 mL of the sample was injected into GC and GC/MS.
Document Page
Measurement of Fatty Acid Response Factor
The chromatographic conditions of GC-17A (SHIMADZU) and GCMS-QP5000
(SHIMADZU) were confirmed and the computer was prepared to collect data by
follow-up the steps mentioned in experiment 4 manual.
After the READY light on GC turns green and click sound on GC-MS was noticed,
0.5 μL of FAME standard was injected using 1μL syringe followed by pressing START
button on front of GC.
FAME standard 20 ug/mL contains C12:0, C14:0, C14:1, C16:0, C16:1, C18:0, C18:1, C18:2, C20:0 and C20:1
Check to see the run starts, wait for approximately 20 minutes to finished.
When ready light turn green again, inject the sample again (duplicate).
tabler-icon-diamond-filled.svg

Secure Best Marks with AI Grader

Need help grading? Try our AI Grader for instant feedback on your assignments.
Document Page
Results and
DiscussionRaw Data from Gas Chromatography
Fig-1 GC of Fame Std 2
Fig 2 -GC of Twisties
Fig 3- GC of Pretzels
Document Page
Raw Data from Gas Chromatography-Mass Spectrometer
Fig-4- GC-MS of Fame Std 2
Fig-5- GC-MS of Pretzels
Fig-6- GC-MS of Twisties
Document Page
Relative Response Factor (RRF)
Relative Response Factor (RRF) is an analytical parameter used in
chromatographic procedures to control impurities/degradants in drug substance
and drug product. RRF is used to correct the difference in detector response of
impurities with analyte peak. RRF is established by slope method with linear range
of solutions4
For the obtained data using GC, RRF can be calculated by:
No FAME Conc ug/ml Retention Time Area RRF
1 C12:0 20 7.280 106378.6 1.000
2 C14:0 20 8.190 118253.2 0.900
3 C16:0 20 8.440 109277.7 0.973
4 C16:1 20 9.090 126228.3 0.843
5 C18:0 20 9.300 113907.2 0.934
6 C18:1 20 9.990 131208.1 0.811
7 C18:2 20 10.170 115905.2 0.918
8 C20:0 20 10.460 104388.6 1.019
9 C22:0 20 10.870 122088.2 0.871
10 C22:1 20 11.040 106585.6 0.998
Fig-7- GC RRF of Fame Std- 2
No FAME Conc ug/ml Retention Time Area RRF
1 C12:0 20 6.864
1649313
2 1.000
2 C14:0 20 7.916
2032978
4 0.811
3 C16:0 20 8.219
2002117
2 0.824
4 C16:1 20 8.949
2353971
1 0.700
5 C18:0 20 9.195
2268987
8 0.727
6 C18:1 20 9.939
2502264
8 0.659
7 C18:2 20 10.147
2389465
3 0.690
8 C20:0 20 10.477
2250828
8 0.733
9 C22:0 20 10.870
2635729
7 0.626
10 C22:1 20 11.078
2540487
5 0.649
Fig-8- GC-MS RRF of Fame Std-2
tabler-icon-diamond-filled.svg

Paraphrase This Document

Need a fresh take? Get an instant paraphrase of this document with our AI Paraphraser
Document Page
Gas Chromatography
Fat content (g/100g) Aliquot mass (mg) Standard added (mg)
Twisties 23.3 643.78 7.7
Pretzels 3.6 4166.7 5.6
Noise level 0.4 millivolt
Gas Chromatography/Mass Spectrometry
Fat content (g/100g) Aliquot mass (mg) Standard added (mg)
Twisties 23.3 642.3 5.4
Pretzels 3.6 4167.7 6.2
GC MS 0.5*100000
Fig- 9- Standards and aliquots added in GC process
Fig-10- Standards and Aliquots added in GC-MS process
To measure the concentrations of fates in our samples:
Concentration of analyte =
Concentration of analyte per 100g= 100
Species amount=
Document Page
Analysis of Twisties Sample
No FAME rt Area RRF
Amount
(mg)
1 C 12:0 7.27 17893.7 1.000 7.7
2 C 14:0 8.17 3240.1 0.900 1.3
3 C 16:0
4 C 16:1 9.08 59840.2 0.843 21.7
5 C 18:1 9.82 1383.1 0.811 0.5
6 C 18:1 9.97 7048.9 0.811 2.5
7 C 18:2 10.07 2303.4 0.918 0.9
8 C 18:2 10.15 53467.5 0.918 2.2
9 C 22:0 10.44 14459.5 1.019 6.3
10 C 22:1
Fig-11- Analysis of Twisties sample by GC
No FAME rt Area RRF
Amount
(mg)
1 C 12:0 6.867 13887974 1.000 5.4
2 C 14:0
3 C 16:0
4 C 16:0 7.916 3537747 0.811 1.1
5 C 18:0
6 C 16:1 8.964 72213471 0.700 19.7
7 C 18:1 9.937 7038899 0.659 0.2
8 C 18:2 10.159 70593466 0.690 18.9
9 C 18:2 10.478 19842123 0.690 5.3
10 C 22:1 10.854 1076064 0.649 0.27
Fig-14 Analysis of Twisties sample by GC-MS
mg g /100 g
Total Fat 43.1 6.69
Total Saturated Fat 15.3 2.37
Total
Monounsaturated Fat 24.7 3.83
Total Polyunsaturated
Fat 3.1 0.48
Total Unsaturated
Fat 27.8 4.31
Fig-12- Amount of different types of
fat in Twisties through GC
mg g /100 g
Total Fat 50.9 7.92
Total Saturated Fat 6.5 1.01
Total
Monounsaturated
Fat 20.2 3.14
Total
Polyunsaturated Fat 24.2 0.07
Total Unsaturated
Fat 44.4 3.21
Fig-13- Amount of different types of
fat in Twisties through GC-MS
Document Page
Analysis of Pretzel Sample
No FAME rt Area RRF
Amount
(mg)
1 C 12:0 7.27 27218 1.000 5.6
2 C 14:0 8.18 1133.1 0.900 0.2
4 C 16:1 9.08 68381.5 0.843 11.9
5 C 18:1 9.98 9619.1 0.811 1.6
6 C 18:2 10.08 4721.3 0.918 0.9
7 C 18:2 10.16 114766.8 0.918 21.7
8 C 18:2 10.37 1118.3 0.918 0.2
9 C 20:0 10.46 180788.2 1.019 37.9
10 C 22:0 10.80 17836.5 0.871 3.2
Fig-15- Analysis of Pretzel by GC
mg g /100 g
Total Fat 83.2 1.99
Total Saturated
Fat 46.9 1.13
Total
Monounsaturated
Fat 13.5 0.32
Total
Polyunsaturated
Fat 22.8 0.54
Total
Unsaturated
Fat 36.3 0.86
Fig-16- Amount of different types of fat
in Pretzel through GC
No FAME rt Area RRF
Amount
(mg)
1 C 12:0 6.833 23845219 1.000 6.2
2 C 14:0 7.880 945138 0.811 0.2
3 C 16:1 8.925 66014751 0.824 14.1
4 C 16:1 8.981 1398016 0.824 0.3
5 C 18:1 9.912 7688678 0.659 1.3
6 C 18:2 10.135 97715842 0.690 17.5
7 C 20:0 10.478 147593553 0.733 28.1
8 C 22:0 10.836 4994633 0.626 0.1
9 C 22:1 11.044 944208 0.649 0.2
10 C 22:1
Fig-18- Analysis of Pretzel by GC-MS
mg g /100 g
Total Fat 68.0 1.63
Total Saturated
Fat 34.6 0.83
Total
Monounsaturated
Fat 15.9 0.38
Total
Polyunsaturated
Fat 17.5 0.42
Total
Unsaturated Fat 33.4 3.21
Fig-17- Amount of different types of fat
in Pretzel through GC-MS
tabler-icon-diamond-filled.svg

Secure Best Marks with AI Grader

Need help grading? Try our AI Grader for instant feedback on your assignments.
Document Page
Test of significant difference within the saturated FAMEs using GC
FAME
Twisties
RRF Pretzels RRF
C 12:0 1.000 1.000
C 14:0 0.900 0.900
C 18:0
C 20:0 1.019
C 22:0 1.019 0.871
mean 0.978 0.948
u 1.000 1.000
SD 0.064 0.073
Null hypothesis: There is no significant difference between the saturated
FAMEs relative response factor at 95% confidence level.
Alternative Hypothesis: There is significant difference between the saturated
FAMEs RRF at 95% confidence level.
Test statistics:
Critical values: At the 95% confidence level using a two-sided t-test and with 3
degrees of freedom t = 3.18.
Decision: As the calculated t-value 0.20 and 0.36 < 3.18, we accept the null
hypothesis.
Conclusion: There is no significant difference between the saturated FAMEs
relative response factor using GC at 95% confidence level.
Document Page
Test of significant difference within the saturated FAMEs using
GC & GC-MS
Note- We apply the same 6 step principle for double sided t-test at
95% Confidence Interval with n-1 degree of freedom to determine
the significant differences of saturated FAMES from both GC& GC-
MS methods
Twisties Pretzels
GC GC-MS GC GC-MS
Test of
significant
different
Test statistic
value
0.20 0.50 0.36 0.66
Critical
value at 95
% Cl
3.18 12.71 3.18 2.78
Conclusion:
significant
difference
(Yes/No)
NO NO NO NO
Document Page
Limit of Detection (LOD)
Limit of detection (LOD) of C12:0 on GC (FID) based on 10:1 signal to noise
ratio:
10X =10 x noise = 10 x 0.4 mV = 4 mV
Area of noise peak = 1.06 x 1.10 ()x 0.4 = 0.466 mV
LOD = (0.466/106378.6) x1.06 = 4.64 x 10⁻⁶
Limit of detection (LOD) of C12:0 on GC-MS (TIC) based on 10:1 signal to noise
ratio:
10X =10 x noise = 10 x 0.5 = 5 mV
Area of noise peak = 1.06 x 1.10(W1/2) x 5 = 5.83 mV
LOD = (5.83/16493132) x1.06 = 3.74 x 10⁻⁷
Limit of detection (LOD) of C12:0 on GC-MS (SIM m/z 74) based on 10:1 signal to
noise ratio:
10X =10 x noise = 10 x 0.5 mV = 5.0 mV
Area of noise peak = 1.06 x 1.10 (W1/2) x 5.0 = 5.83 mV
-5
tabler-icon-diamond-filled.svg

Paraphrase This Document

Need a fresh take? Get an instant paraphrase of this document with our AI Paraphraser
Document Page
Comparison between obtained
results and manufacture
tabulated values
Twisties (g/100g) Manufacturer
specifications/
g/100g
Pretzels(g/100g)
GC GC-MS Twisties Pretzels GC GC-MS
Total Fat 6.69 7.92 23.3 3.6 1.99 1.63
Total Saturated Fat 2.37 1.01 1.13 0.83
Total Monounsaturated
Fat 3.83 3.14 0.32 0.38
Total Polyunsaturated
Fat 0.48 0.07 0.54 0.42
Total unsaturated fat 4.31 3.21 0.86 3.21
Differences in experimental values compared to manufacturer values noticed
Both Twisties and Pretzels have less total fat compared to manufacturers
recommended values
Further repeats and more accurate techniques required to get a precise value
Document Page
Relative Merits of Techniques
Predictable response of GC-FID is useful for an initial quantitative
overview of sample composition.
GC-MS detector demonstrates lower LOD. GC-MS provides reliable,
structural and mass information.
Total Ion Chromatogram (TIC) is a chromatogram created by
summing up intensities of all mass spectral peaks belonging to the
same scan.
GC-MS (SIM m/z 74) Select 74 ion to monitor and only those mass
fragments are detected by mass spectrometer. The advantage of SIM is
that much mass intensities for 74 ion compared to TIC (74 m/z is the
base peak of fatty acid methyl ester).
Document Page
Possible Sources of Error in this Experimental
Procedure
Parallax error in reading the volumetric flask and uncertainty on glassware such as
volumetric flask
Integration of software with GC and GC-MS
GC Syringe contamination and possible malfunction of GC instrument
Sample storage and shelf life of experimental reagents and standard solutions
Inappropriate sample preparation
Poor injection technique
Temperature and performance of column and detector
The temperature of the injector
Baseline noise
tabler-icon-diamond-filled.svg

Secure Best Marks with AI Grader

Need help grading? Try our AI Grader for instant feedback on your assignments.
Document Page
Conclusio
n
The techniques of GC-MS and GC-FID were used to determine the
amount of fat in Twisties and Pretzels
The results that were obtained from the techniques were lower
than those from manufacturer specifications
Accuracy and precision of results obtained can be improved by
repeating the experiment and increasing the number of standards.
Document Page
Learning Outcomes
Sample derivatisation techniques and why they are needed for
GC analyses.
Knowledge of the shorthand naming system used for fatty acids.
Sample preparation techniques for GC analysis.
Practical experience in the application of a derivatisation
procedure.
Practical experience in the use of internal standardisation for
quantitative chemical analysis
Practical experience in the use of the use splitless injection
technique and GC and GC/MS instrumentation.
Document Page
References:
1. Aued-Pimentel, S., Kus, M.M.M., Kumagai, E.E., Ruvieri, V. and Zenebon, O., 2010. Comparison of gas chromatographic and
gravimetric methods for quantization of total fat and fatty acids in foodstuffs. Química Nova, 33(1), pp.76-84.
2. Barwick, V.J., 1999. Sources of uncertainty in gas chromatography and high-performance liquid chromatography. Journal of
Chromatography A, 849(1), pp.13-33.
3. Carrasco, T.P.E.N.A., Deelder, P.A.M. and Mayboroda, O.A., 2014. Evaluation of GC- APCI/MS and GC-FID as a complementary
platform. Metabolomics of urinary tract infection: a multiplatform approach, 21(4), p.61.
4. Chemical analysis II CBMS825 Experiment 3: Analysis of Fat in Snack Foods by Gas Chromatography and Gas
Chromatography/Mass Spectrometry, Macquarie University,
5. D.A.Skoog, D.M.West, F.J.Holler, S.R.Crouch, Fundamentals of Analytical Chemistry, 9th Edition 2014, Thomson Brooks/Cole.
6. Experiment 3 – Analysis of Fat in Snack Foods by Gas Chromatography and Gas Chromatography/Mass Spectrometry,
Macquarie university, Faculty of Science and Engineering, Department of Chemistry & Biomolecular Sciences,
CBMS308/CBMS708/ CBMS825 Chemical Analysis II,
7. Healthy for good, Eat smat, viewed 18/03/2019, <https://healthyforgood.heart.org/Eat-smart/Articles/Saturated-Fats>.
8. Labtexts, Core Analytical Chemistry Instrumental Analysis Chromatography Gas Chromatography, viewed 01/04/2017,
https://chem.libretexts.org/Core/Analytical_Chemistry/Instrumental_Analysis/Chromatography/Gas_Chromatography.
9. Nutrition source, What should you eat, viewed 18/03/2019,
https://www.hsph.harvard.edu/nutritionsource/what-should-you-eat/fats-and-cholesterol/.
tabler-icon-diamond-filled.svg

Paraphrase This Document

Need a fresh take? Get an instant paraphrase of this document with our AI Paraphraser
Document Page
THANK
YOU
chevron_up_icon
1 out of 26
circle_padding
hide_on_mobile
zoom_out_icon
logo.png

Your All-in-One AI-Powered Toolkit for Academic Success.

Available 24*7 on WhatsApp / Email

[object Object]