Cash Conversion Cycle and Cash Ratio Analysis for CCK Consolidated
VerifiedAdded on 2021/06/02
|17
|5399
|388
Report
AI Summary
This report provides a comprehensive financial analysis of CCK Consolidated Holdings Berhad (CCK), a Malaysia-based company. The analysis focuses on the company's cash conversion cycle (CCC), average age of inventory (AAI), average collection period (ACP), average payment period (APP), and cash ratio for the periods ending March, June, and September 2020. The report calculates and interprets these metrics, highlighting trends in CCK's working capital management and liquidity. The CCC analysis reveals improvements in converting assets and liabilities into cash, with a decreasing CCC from March to September 2020. AAI, ACP, and APP are also analyzed to assess the efficiency of inventory management, collection efforts, and payment practices. Finally, the cash ratio is calculated to assess the company's ability to meet short-term obligations. The report concludes with insights into CCK's financial performance and its ability to manage its working capital effectively.
1.0 Background of the company
CCK Consolidated Holdings Berhad (“CCK”) is a Malaysia-based company was established on 5th
August 1996 as engaged in investment holding company and the provision of management services.
It was listed on the Second Board of the Kuala Lumpur Stock Exchange on 10th December 1997 and
recorded as Bursa Malaysia under the Main Market. The founder of CCK Consolidated is Tan Sri
Datuk Tiong Su Kouk, who had made the big attribute to the company’s achievement and
development. Under his stewardship, CCK Group has become one of the largest integrated poultry
producers in the region and the businesses are carried out primarily in Sarawak, Sabah and
Indonesia. There have 65 wholesale and retail stores, trading departments as well as factories
throughout Peninsular Malaysia. CCK operates in five main reportable segments included Poultry,
Prawn, Food Ration, Corporate and Retail.
For the Poultry segment, it involved in rearing and production of poultry products which is well-
equipped with the latest breeding farm technologies, automated abattoir and computer-controlled
hatching chambers. While, the Prawn segment is involved in rearing and production of prawn and
seafood products. It covers an area of over 200 acres with the operation of latest farming
technologies and probiotics in order to ensure ecologically friendly and non-pollution. The prawn
agriculture and prawn processing of CCK are graded according to the strictest quality standards to
make sure that the quality of every product is consistently maintained. Followed by the Food Ration
segment which involved in the supply and trading of food products and related services. The fourth
segment is corporate segment, it involved in the provision of management services. The last
segment in CCK is retail segment by trading of cold storage goods and livestock farming as well as
provided transportation services and veterinary supplies.
Besides, CCK are awarded the Certificates of Authentication Halal by the Islamic Majlis Islam Sarawak
and Certificates Veterinary of Health Mark by Department of Veterinary Services Malaysia. CCK
Group will continue to increase their production capacities and also enhance operation runs at
highest standards for the improvement of food safety. This is due to the reason that it can help CCK
to meet its mission which is provide good quality and safety products to customers by ensuring
customer satisfaction.
Paraphrase This Document
Need a fresh take? Get an instant paraphrase of this document with our AI Paraphraser
2.0 Cash conversion cycle
The Cash Conversion Cycle (CCC) is a working capital metric that shows the amount of time it takes
for a company to convert its investments in inventory and other resources into cash flows via the
sales process. It is a measures that help figure out the efficiency of a company's operations and
management as well as financial health. It takes into account the company needs how much time to
sell its inventory, collect receivables, and pay off the liabilities. The elements of cash conversion
cycle formula have three parts which is Average Age of Inventory (AAI), Average Collection Period
(ACP) and Average Payment Period (APP). We need to add AAI and ACP then subtract APP to get
CCC.
CCC = AAI + ACP – APP
Table 1: Calculation of Cash Conversion Cycle
Graph 1: Cash Conversion Cycle
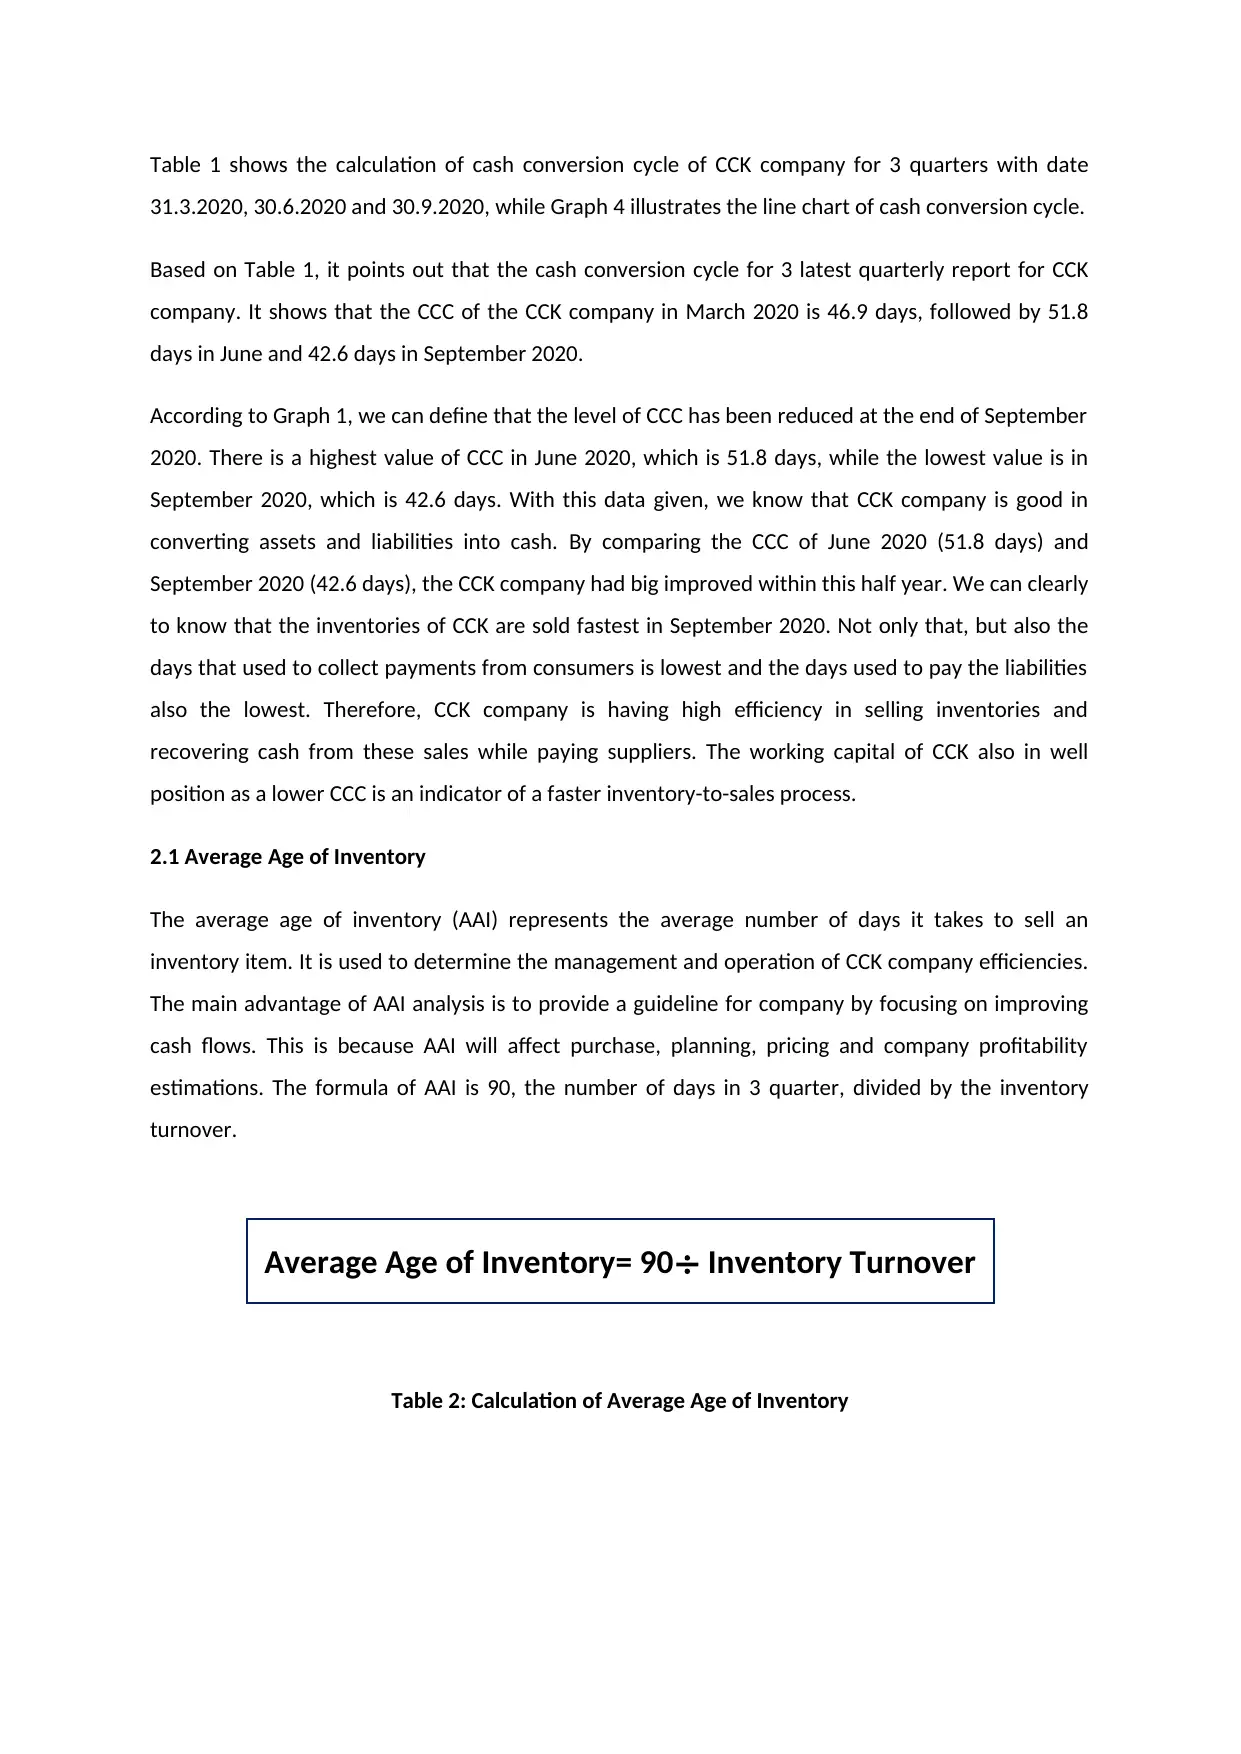
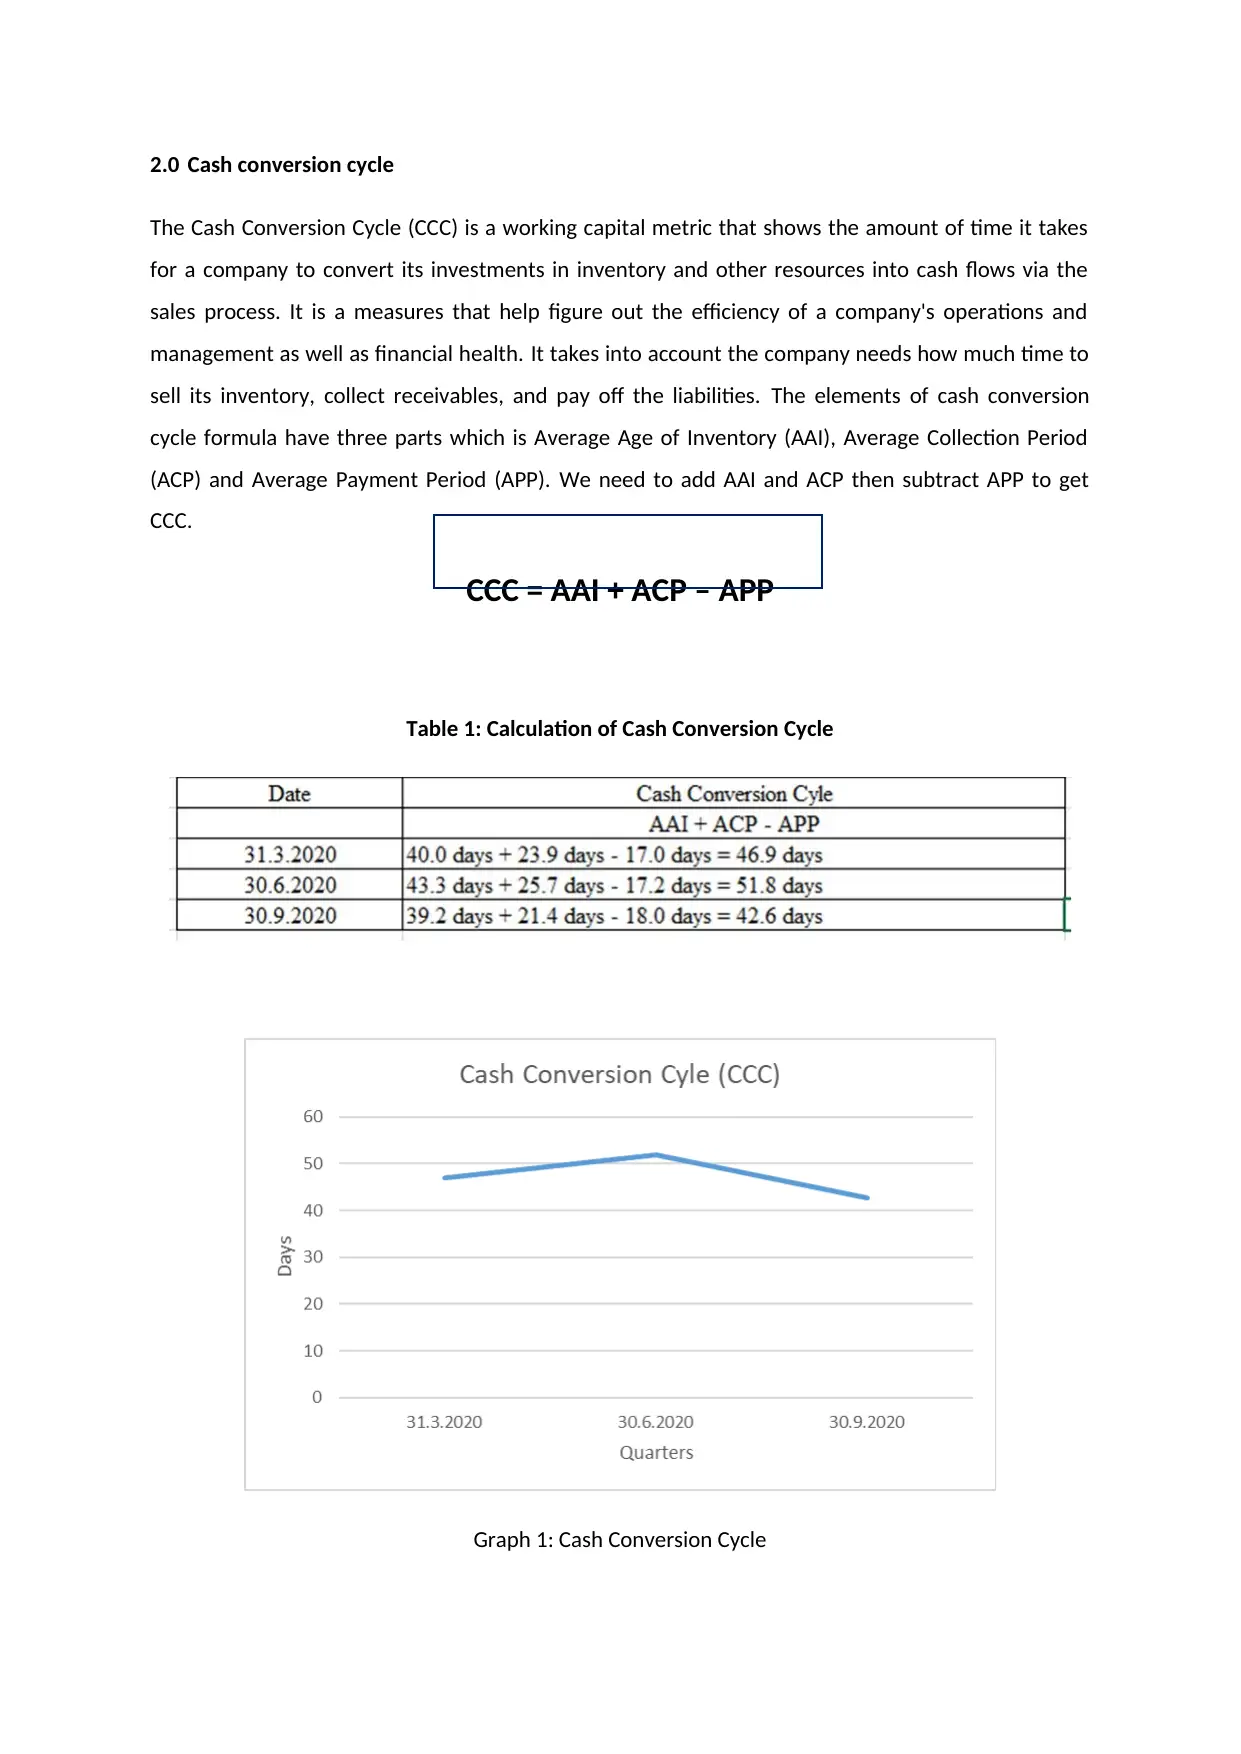
Table 1 shows the calculation of cash conversion cycle of CCK company for 3 quarters with date
31.3.2020, 30.6.2020 and 30.9.2020, while Graph 4 illustrates the line chart of cash conversion cycle.
Based on Table 1, it points out that the cash conversion cycle for 3 latest quarterly report for CCK
company. It shows that the CCC of the CCK company in March 2020 is 46.9 days, followed by 51.8
days in June and 42.6 days in September 2020.
According to Graph 1, we can define that the level of CCC has been reduced at the end of September
2020. There is a highest value of CCC in June 2020, which is 51.8 days, while the lowest value is in
September 2020, which is 42.6 days. With this data given, we know that CCK company is good in
converting assets and liabilities into cash. By comparing the CCC of June 2020 (51.8 days) and
September 2020 (42.6 days), the CCK company had big improved within this half year. We can clearly
to know that the inventories of CCK are sold fastest in September 2020. Not only that, but also the
days that used to collect payments from consumers is lowest and the days used to pay the liabilities
also the lowest. Therefore, CCK company is having high efficiency in selling inventories and
recovering cash from these sales while paying suppliers. The working capital of CCK also in well
position as a lower CCC is an indicator of a faster inventory-to-sales process.
2.1 Average Age of Inventory
The average age of inventory (AAI) represents the average number of days it takes to sell an
inventory item. It is used to determine the management and operation of CCK company efficiencies.
The main advantage of AAI analysis is to provide a guideline for company by focusing on improving
cash flows. This is because AAI will affect purchase, planning, pricing and company profitability
estimations. The formula of AAI is 90, the number of days in 3 quarter, divided by the inventory
turnover.
Average Age of Inventory= 90÷ Inventory Turnover
Table 2: Calculation of Average Age of Inventory
⊘ This is a preview!⊘
Do you want full access?
Subscribe today to unlock all pages.
Trusted by 1+ million students worldwide
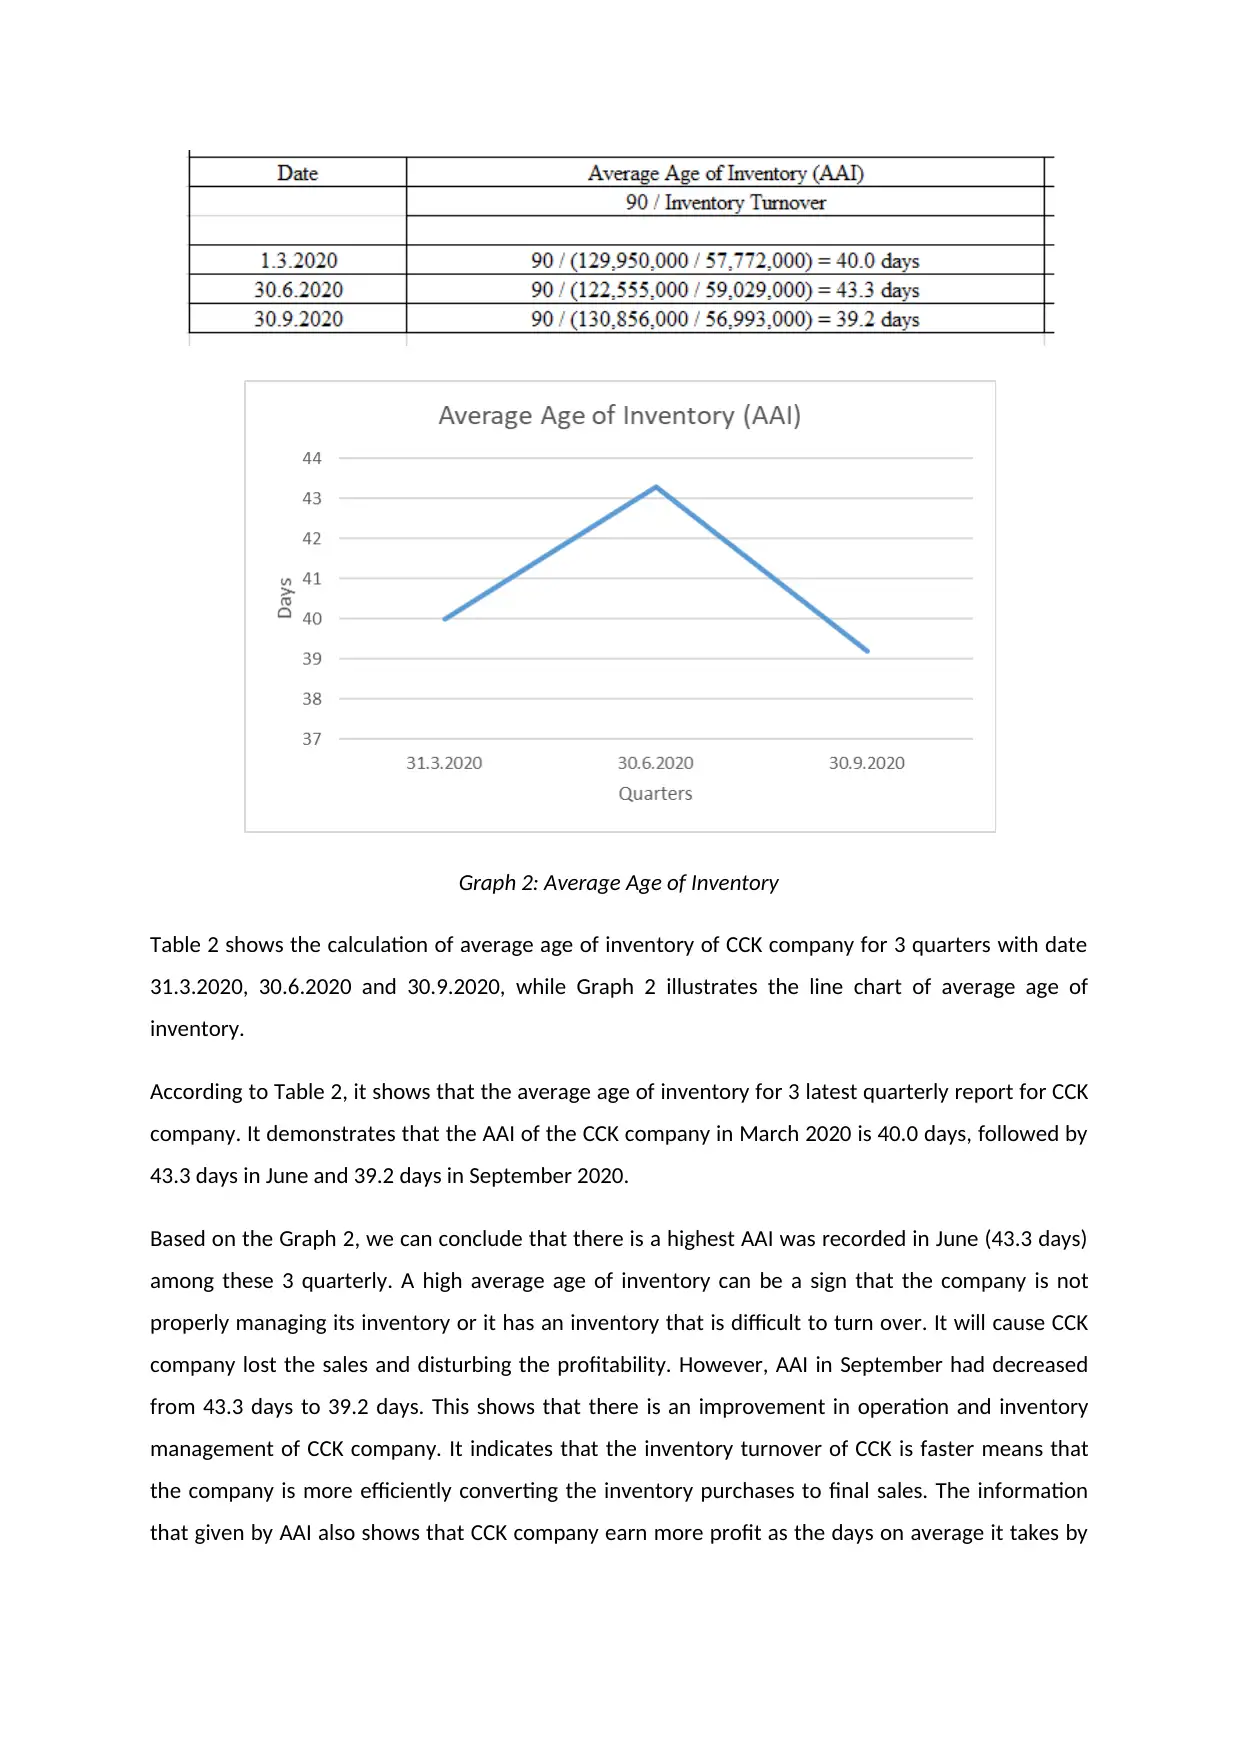
Graph 2: Average Age of Inventory
Table 2 shows the calculation of average age of inventory of CCK company for 3 quarters with date
31.3.2020, 30.6.2020 and 30.9.2020, while Graph 2 illustrates the line chart of average age of
inventory.
According to Table 2, it shows that the average age of inventory for 3 latest quarterly report for CCK
company. It demonstrates that the AAI of the CCK company in March 2020 is 40.0 days, followed by
43.3 days in June and 39.2 days in September 2020.
Based on the Graph 2, we can conclude that there is a highest AAI was recorded in June (43.3 days)
among these 3 quarterly. A high average age of inventory can be a sign that the company is not
properly managing its inventory or it has an inventory that is difficult to turn over. It will cause CCK
company lost the sales and disturbing the profitability. However, AAI in September had decreased
from 43.3 days to 39.2 days. This shows that there is an improvement in operation and inventory
management of CCK company. It indicates that the inventory turnover of CCK is faster means that
the company is more efficiently converting the inventory purchases to final sales. The information
that given by AAI also shows that CCK company earn more profit as the days on average it takes by
Paraphrase This Document
Need a fresh take? Get an instant paraphrase of this document with our AI Paraphraser
CCK to sell the inventory had decreased. Hence, it is better to have a lower AAI because the number
of times the inventory is purchased and sold during the year is increases.
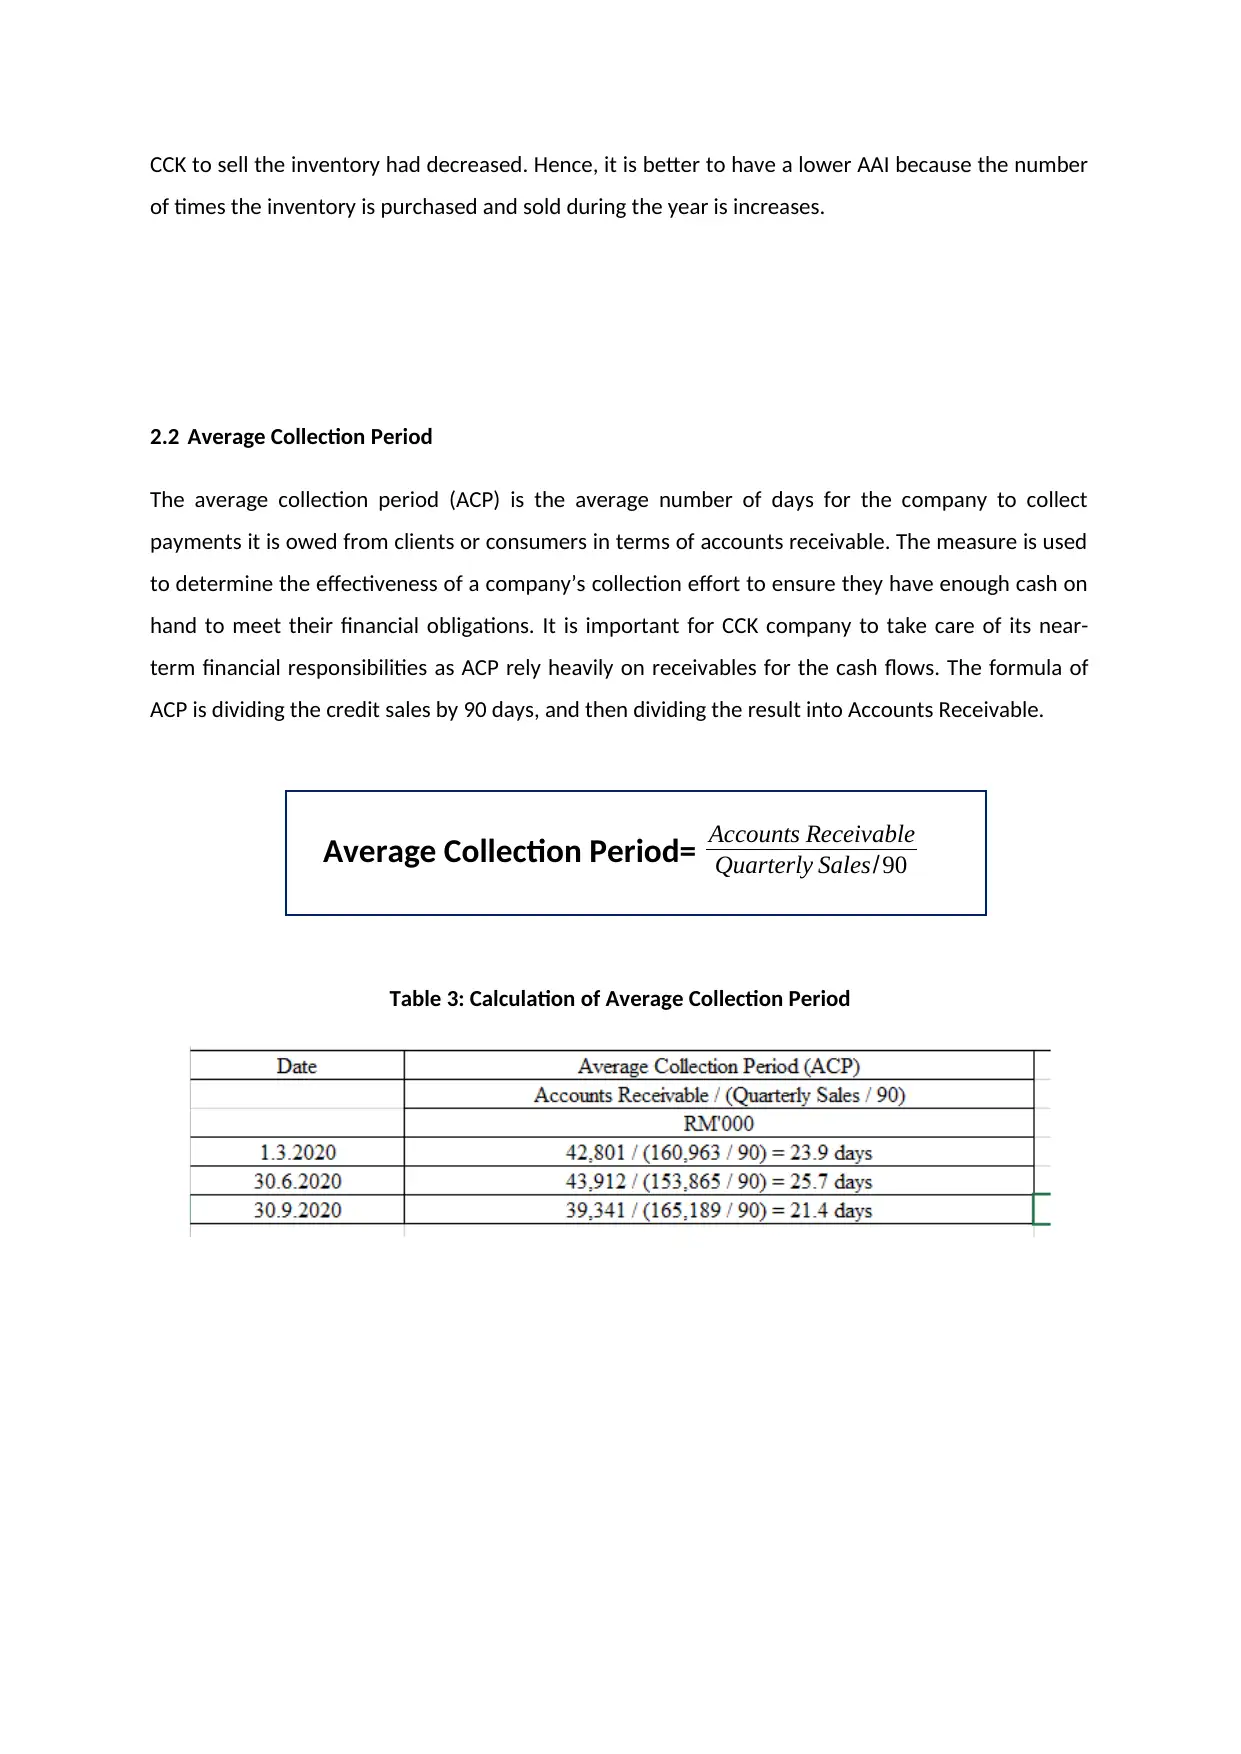
2.2 Average Collection Period
The average collection period (ACP) is the average number of days for the company to collect
payments it is owed from clients or consumers in terms of accounts receivable. The measure is used
to determine the effectiveness of a company’s collection effort to ensure they have enough cash on
hand to meet their financial obligations. It is important for CCK company to take care of its near-
term financial responsibilities as ACP rely heavily on receivables for the cash flows. The formula of
ACP is dividing the credit sales by 90 days, and then dividing the result into Accounts Receivable.
Average Collection Period= Accounts Receivable
Quarterly Sales/90
Table 3: Calculation of Average Collection Period
of times the inventory is purchased and sold during the year is increases.
2.2 Average Collection Period
The average collection period (ACP) is the average number of days for the company to collect
payments it is owed from clients or consumers in terms of accounts receivable. The measure is used
to determine the effectiveness of a company’s collection effort to ensure they have enough cash on
hand to meet their financial obligations. It is important for CCK company to take care of its near-
term financial responsibilities as ACP rely heavily on receivables for the cash flows. The formula of
ACP is dividing the credit sales by 90 days, and then dividing the result into Accounts Receivable.
Average Collection Period= Accounts Receivable
Quarterly Sales/90
Table 3: Calculation of Average Collection Period
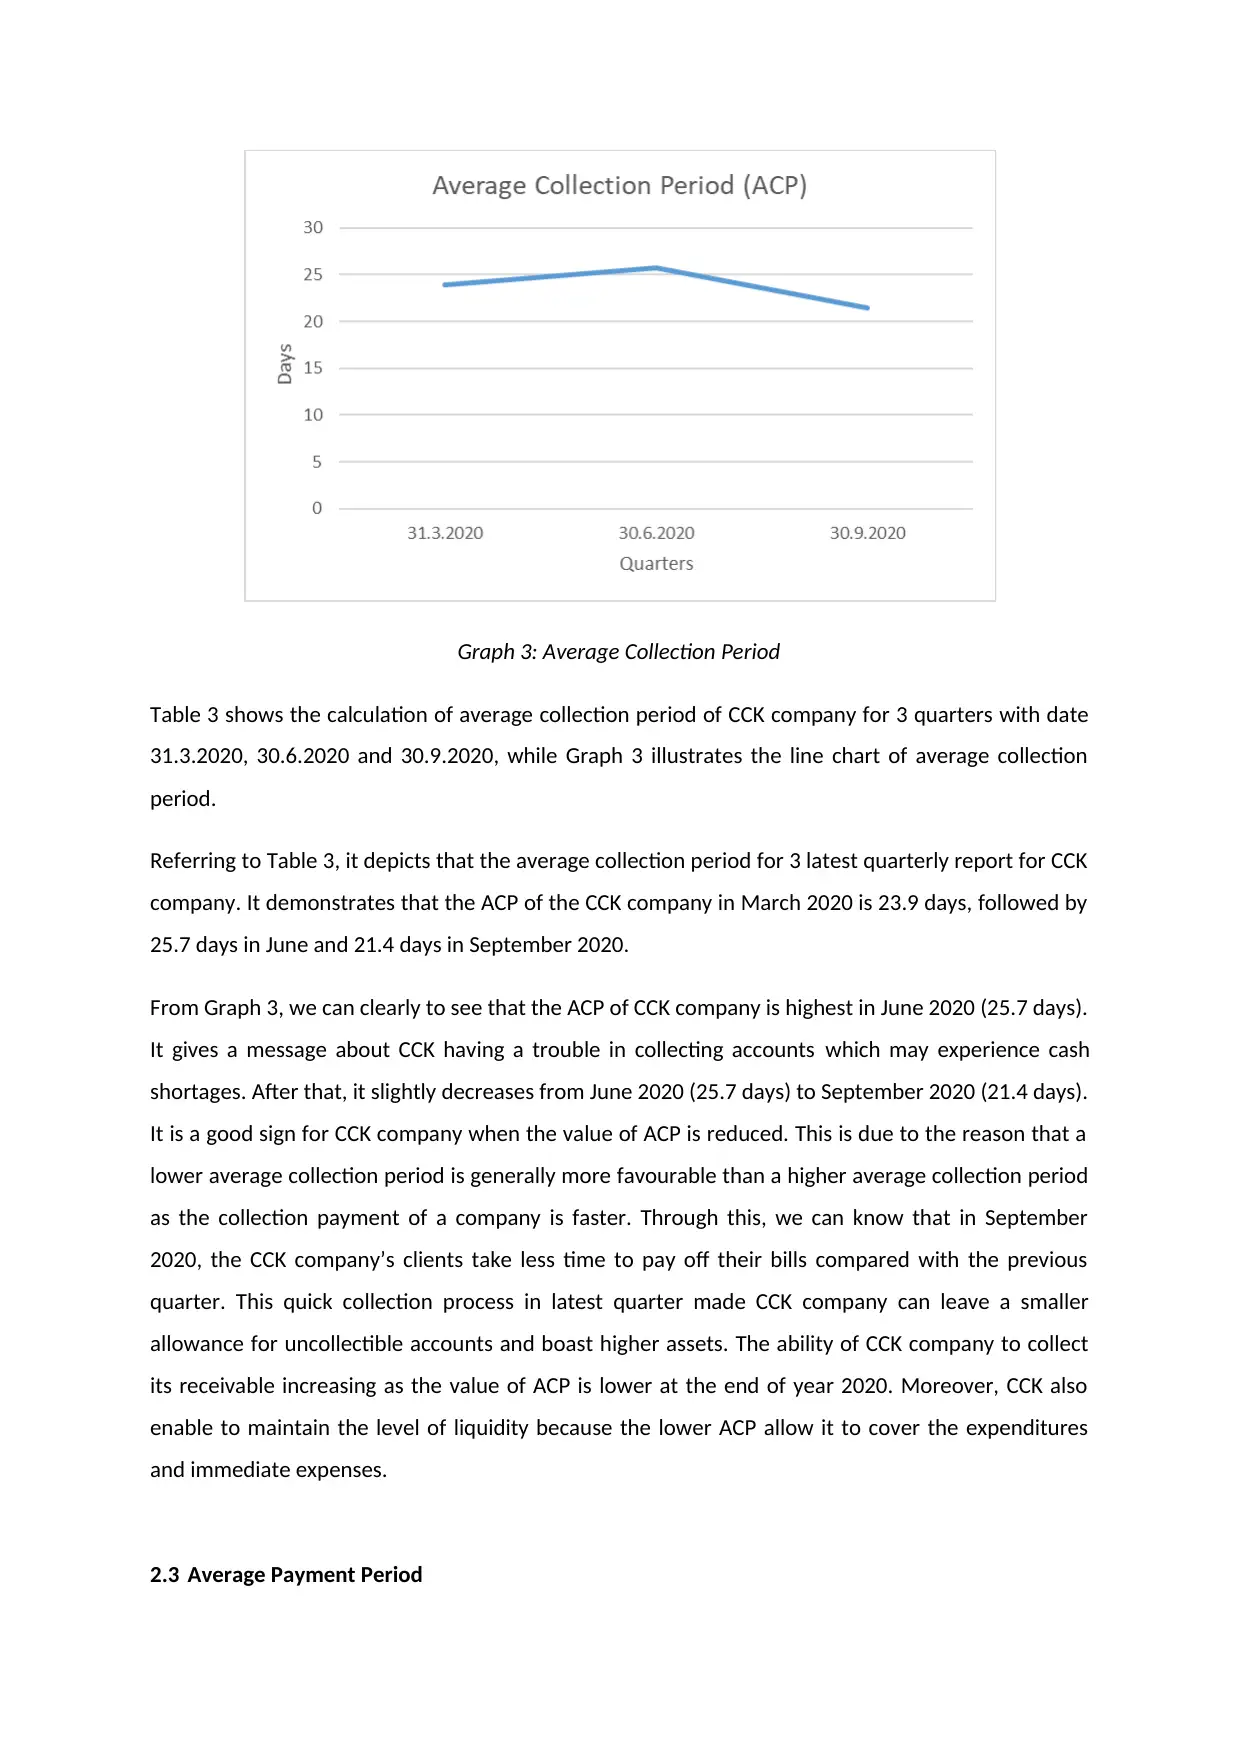
Graph 3: Average Collection Period
Table 3 shows the calculation of average collection period of CCK company for 3 quarters with date
31.3.2020, 30.6.2020 and 30.9.2020, while Graph 3 illustrates the line chart of average collection
period.
Referring to Table 3, it depicts that the average collection period for 3 latest quarterly report for CCK
company. It demonstrates that the ACP of the CCK company in March 2020 is 23.9 days, followed by
25.7 days in June and 21.4 days in September 2020.
From Graph 3, we can clearly to see that the ACP of CCK company is highest in June 2020 (25.7 days).
It gives a message about CCK having a trouble in collecting accounts which may experience cash
shortages. After that, it slightly decreases from June 2020 (25.7 days) to September 2020 (21.4 days).
It is a good sign for CCK company when the value of ACP is reduced. This is due to the reason that a
lower average collection period is generally more favourable than a higher average collection period
as the collection payment of a company is faster. Through this, we can know that in September
2020, the CCK company’s clients take less time to pay off their bills compared with the previous
quarter. This quick collection process in latest quarter made CCK company can leave a smaller
allowance for uncollectible accounts and boast higher assets. The ability of CCK company to collect
its receivable increasing as the value of ACP is lower at the end of year 2020. Moreover, CCK also
enable to maintain the level of liquidity because the lower ACP allow it to cover the expenditures
and immediate expenses.
2.3 Average Payment Period
⊘ This is a preview!⊘
Do you want full access?
Subscribe today to unlock all pages.
Trusted by 1+ million students worldwide
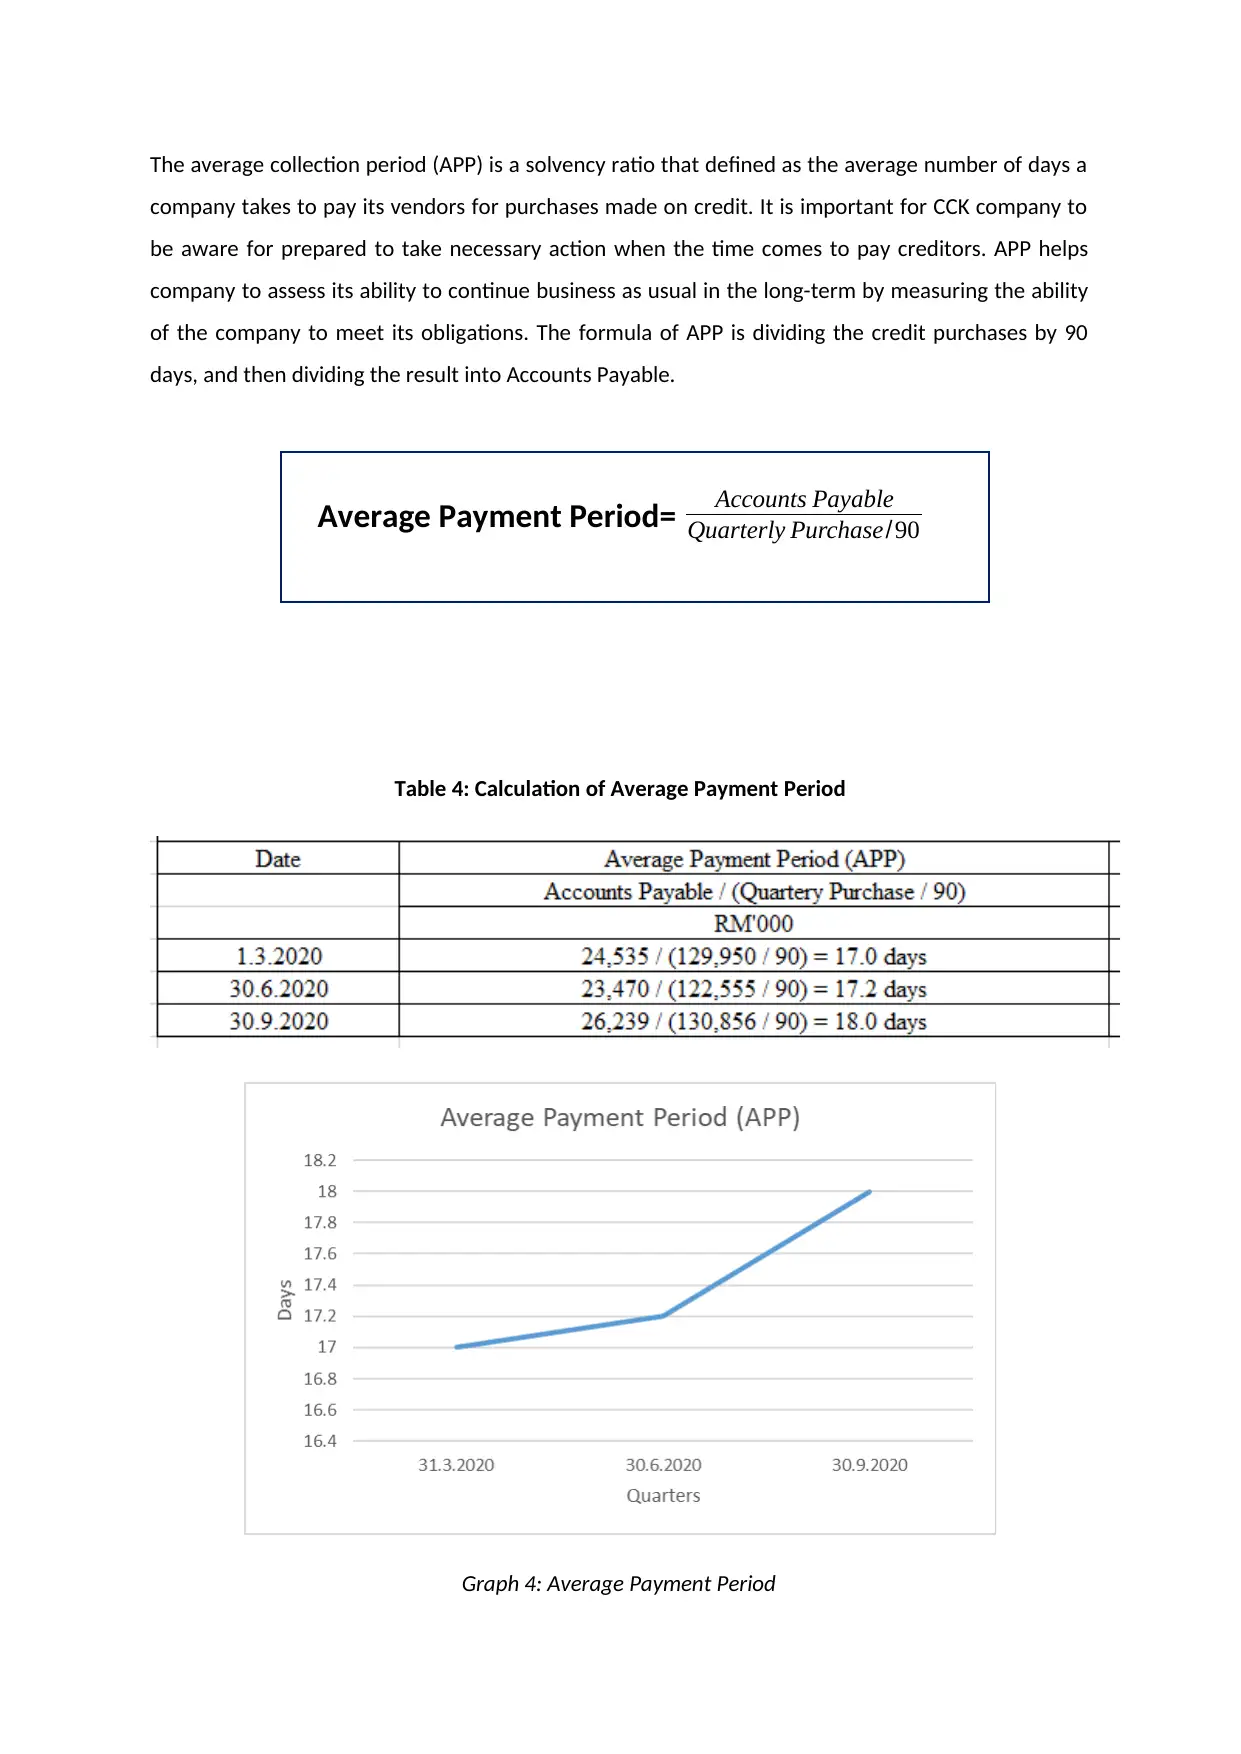
The average collection period (APP) is a solvency ratio that defined as the average number of days a
company takes to pay its vendors for purchases made on credit. It is important for CCK company to
be aware for prepared to take necessary action when the time comes to pay creditors. APP helps
company to assess its ability to continue business as usual in the long-term by measuring the ability
of the company to meet its obligations. The formula of APP is dividing the credit purchases by 90
days, and then dividing the result into Accounts Payable.
Average Payment Period= Accounts Payable
Quarterly Purchase/90
Table 4: Calculation of Average Payment Period
Graph 4: Average Payment Period
Paraphrase This Document
Need a fresh take? Get an instant paraphrase of this document with our AI Paraphraser
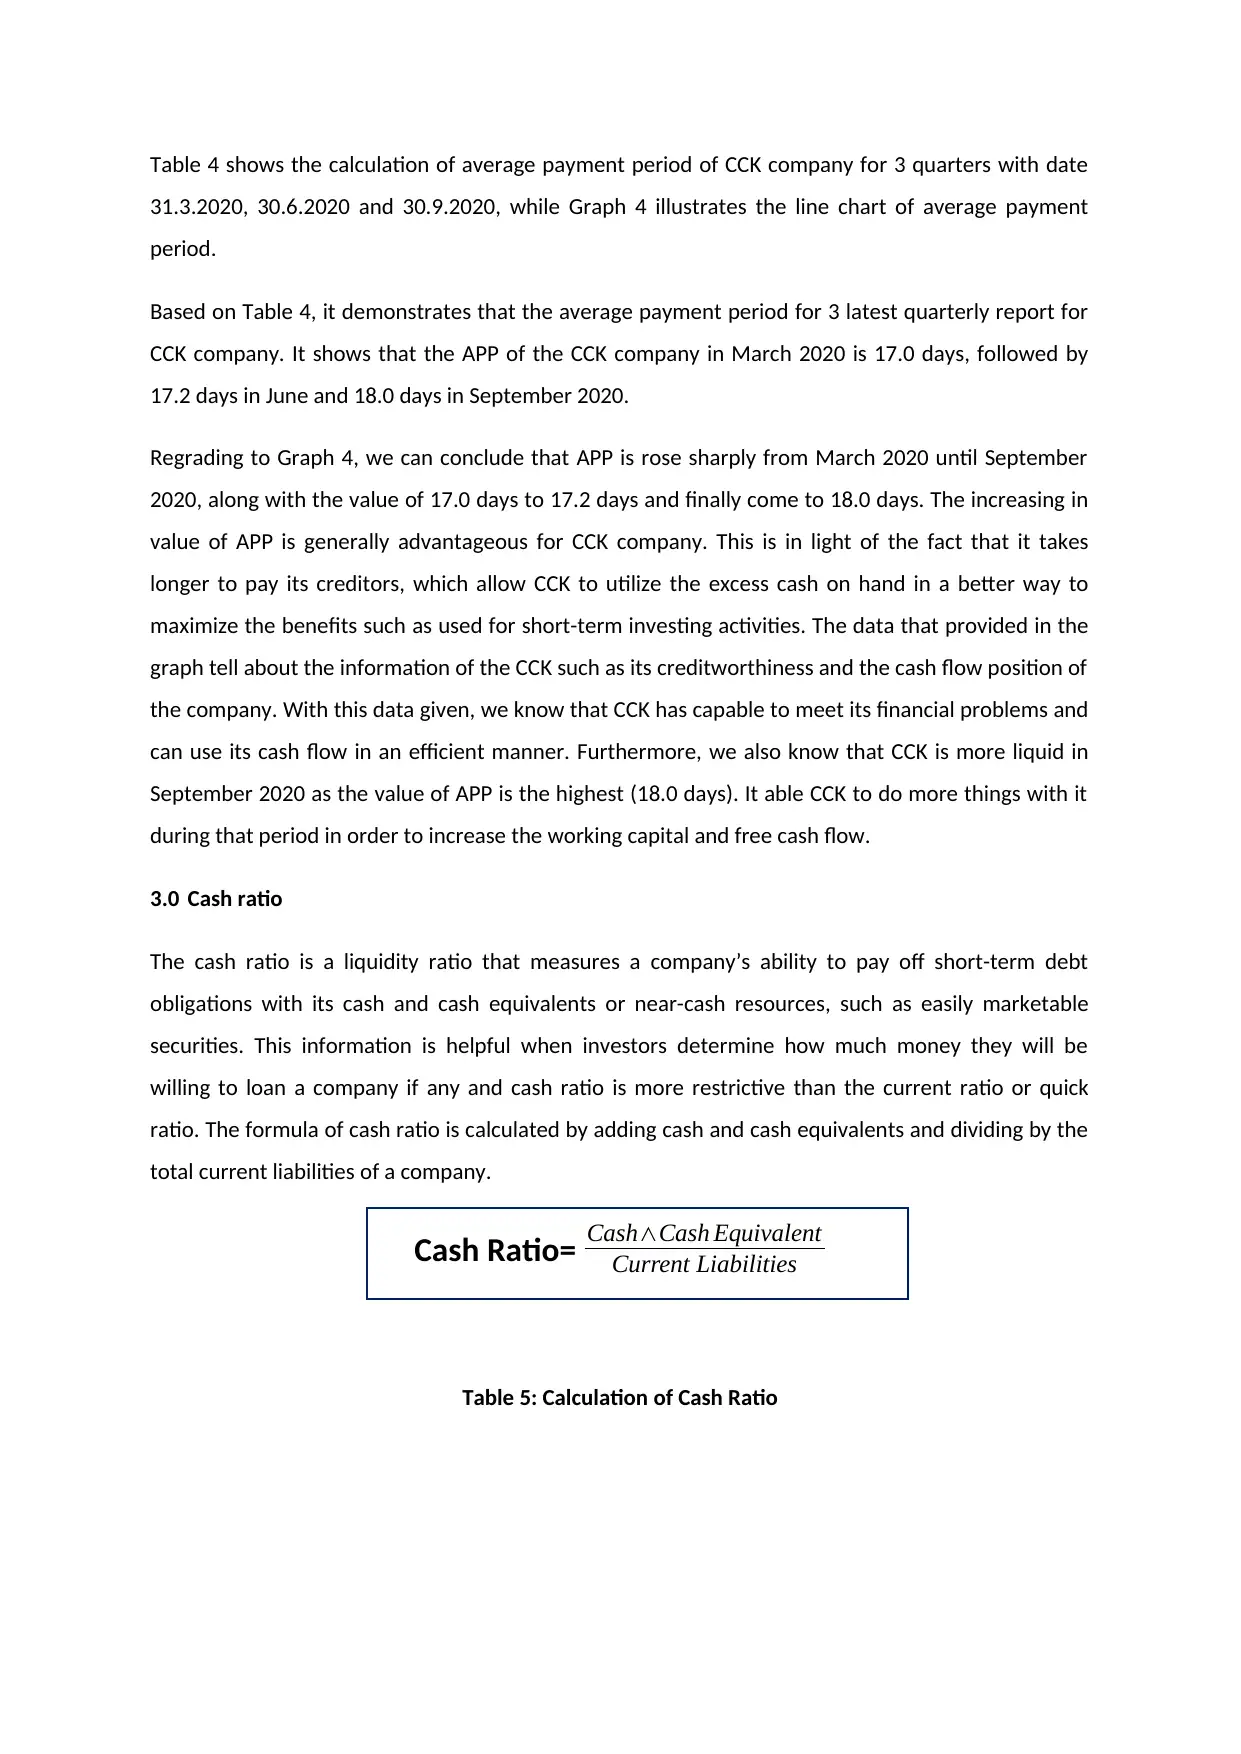
Table 4 shows the calculation of average payment period of CCK company for 3 quarters with date
31.3.2020, 30.6.2020 and 30.9.2020, while Graph 4 illustrates the line chart of average payment
period.
Based on Table 4, it demonstrates that the average payment period for 3 latest quarterly report for
CCK company. It shows that the APP of the CCK company in March 2020 is 17.0 days, followed by
17.2 days in June and 18.0 days in September 2020.
Regrading to Graph 4, we can conclude that APP is rose sharply from March 2020 until September
2020, along with the value of 17.0 days to 17.2 days and finally come to 18.0 days. The increasing in
value of APP is generally advantageous for CCK company. This is in light of the fact that it takes
longer to pay its creditors, which allow CCK to utilize the excess cash on hand in a better way to
maximize the benefits such as used for short-term investing activities. The data that provided in the
graph tell about the information of the CCK such as its creditworthiness and the cash flow position of
the company. With this data given, we know that CCK has capable to meet its financial problems and
can use its cash flow in an efficient manner. Furthermore, we also know that CCK is more liquid in
September 2020 as the value of APP is the highest (18.0 days). It able CCK to do more things with it
during that period in order to increase the working capital and free cash flow.
3.0 Cash ratio
The cash ratio is a liquidity ratio that measures a company’s ability to pay off short-term debt
obligations with its cash and cash equivalents or near-cash resources, such as easily marketable
securities. This information is helpful when investors determine how much money they will be
willing to loan a company if any and cash ratio is more restrictive than the current ratio or quick
ratio. The formula of cash ratio is calculated by adding cash and cash equivalents and dividing by the
total current liabilities of a company.
Cash Ratio= Cash∧Cash Equivalent
Current Liabilities
Table 5: Calculation of Cash Ratio
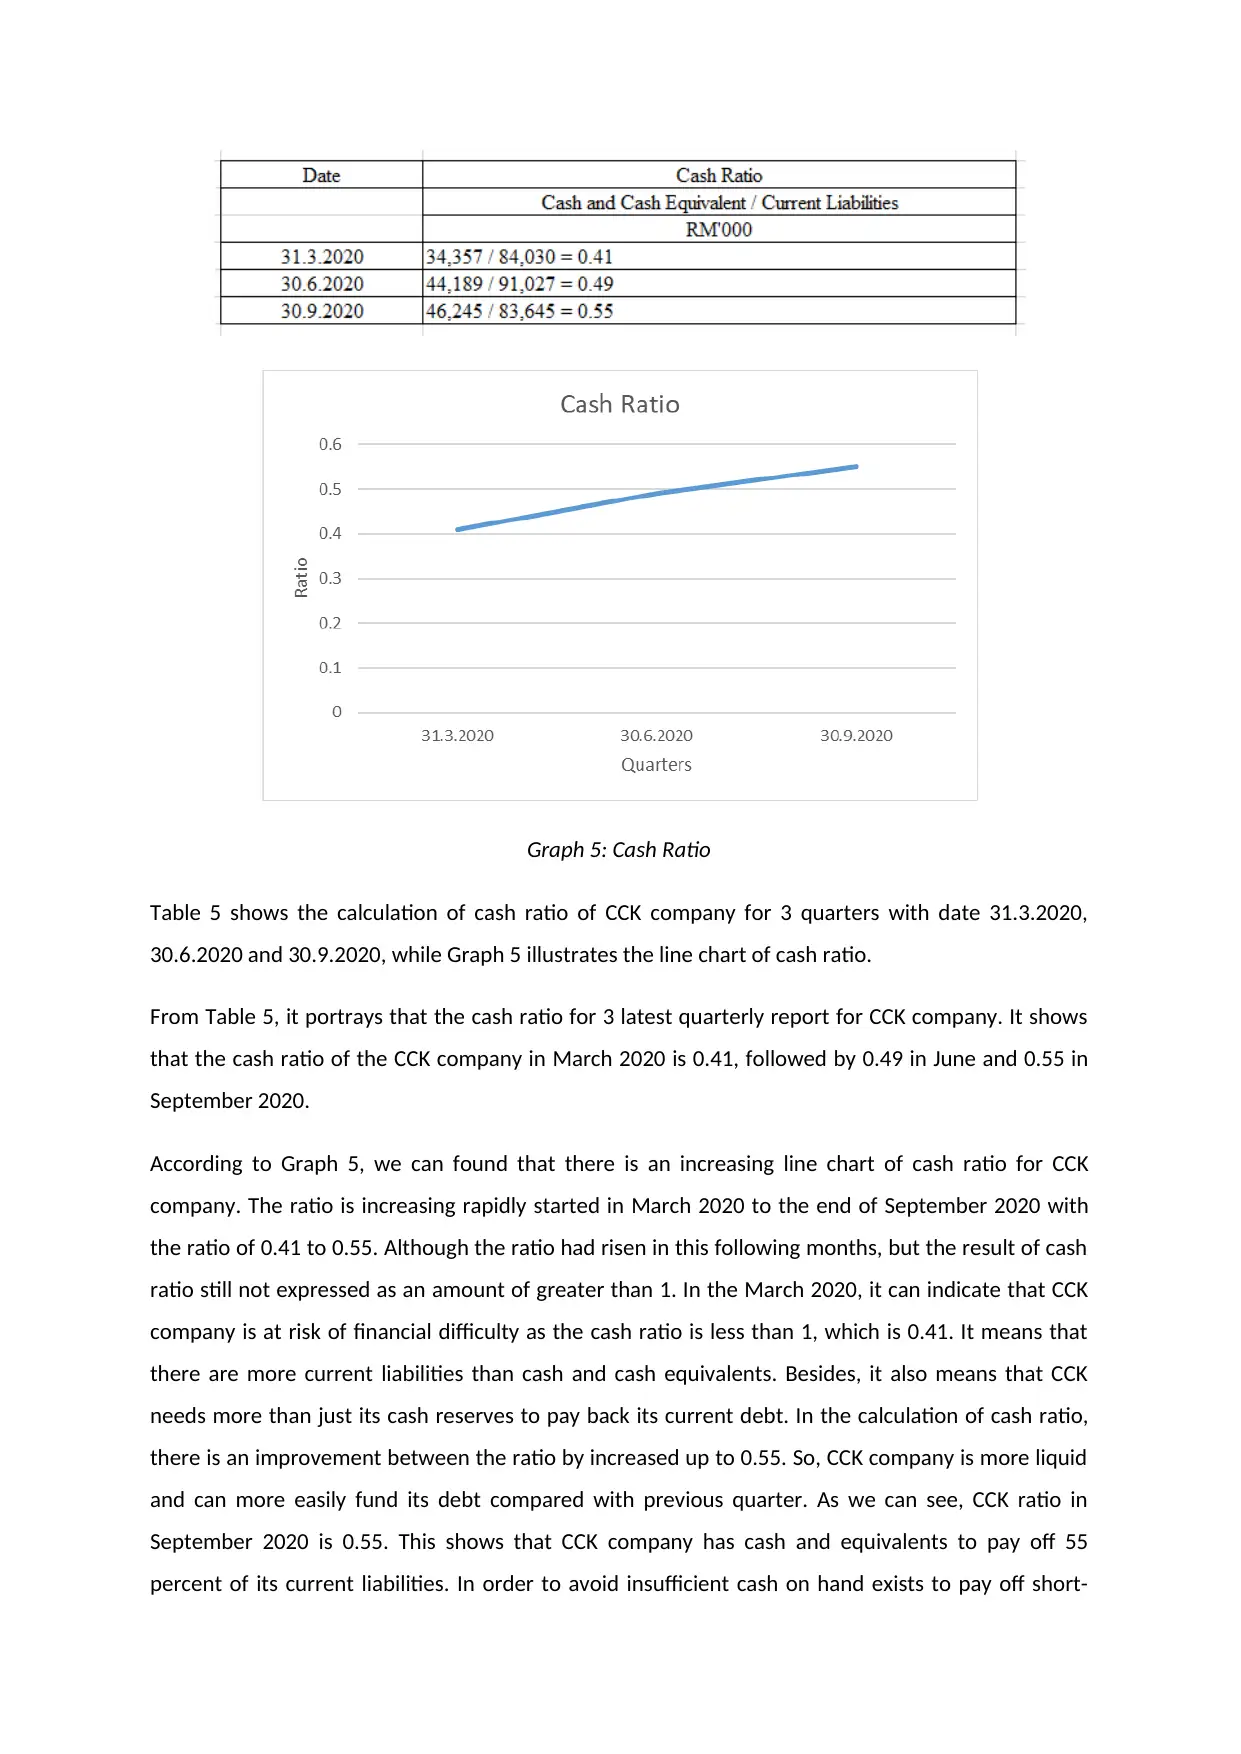
Graph 5: Cash Ratio
Table 5 shows the calculation of cash ratio of CCK company for 3 quarters with date 31.3.2020,
30.6.2020 and 30.9.2020, while Graph 5 illustrates the line chart of cash ratio.
From Table 5, it portrays that the cash ratio for 3 latest quarterly report for CCK company. It shows
that the cash ratio of the CCK company in March 2020 is 0.41, followed by 0.49 in June and 0.55 in
September 2020.
According to Graph 5, we can found that there is an increasing line chart of cash ratio for CCK
company. The ratio is increasing rapidly started in March 2020 to the end of September 2020 with
the ratio of 0.41 to 0.55. Although the ratio had risen in this following months, but the result of cash
ratio still not expressed as an amount of greater than 1. In the March 2020, it can indicate that CCK
company is at risk of financial difficulty as the cash ratio is less than 1, which is 0.41. It means that
there are more current liabilities than cash and cash equivalents. Besides, it also means that CCK
needs more than just its cash reserves to pay back its current debt. In the calculation of cash ratio,
there is an improvement between the ratio by increased up to 0.55. So, CCK company is more liquid
and can more easily fund its debt compared with previous quarter. As we can see, CCK ratio in
September 2020 is 0.55. This shows that CCK company has cash and equivalents to pay off 55
percent of its current liabilities. In order to avoid insufficient cash on hand exists to pay off short-
⊘ This is a preview!⊘
Do you want full access?
Subscribe today to unlock all pages.
Trusted by 1+ million students worldwide
term debt, CCK must maintains a relatively high cash balance during the year. Thus, CCK company
can cover all of the current liabilities without having to sell or liquidate other assets.
3.1 Sales growth
Sales growth is a metric that measures the ability of increase in sales over a specific period of time.
Without revenue growth, company is at dangerous place of being overtaken by competitors and
facing financial problem. It is not to be denied that sales growth is significant to the company as it is
tied directly to revenue and profitability which will affect the business performance and operation.
Sales growth also is a strategic indicator that is used in decision making by the board of directors and
highly influenced the execution of business strategy as well as stakeholders and sales team. The
formula of sales growth is subtracting the current period sales from that prior period sales. Then,
divide the result by the prior period sales and multiply by 100 to get the percent sales growth.
Sales Growth= (Current Period Sales−Prior Period Sales)
Prior Period Sales ×100
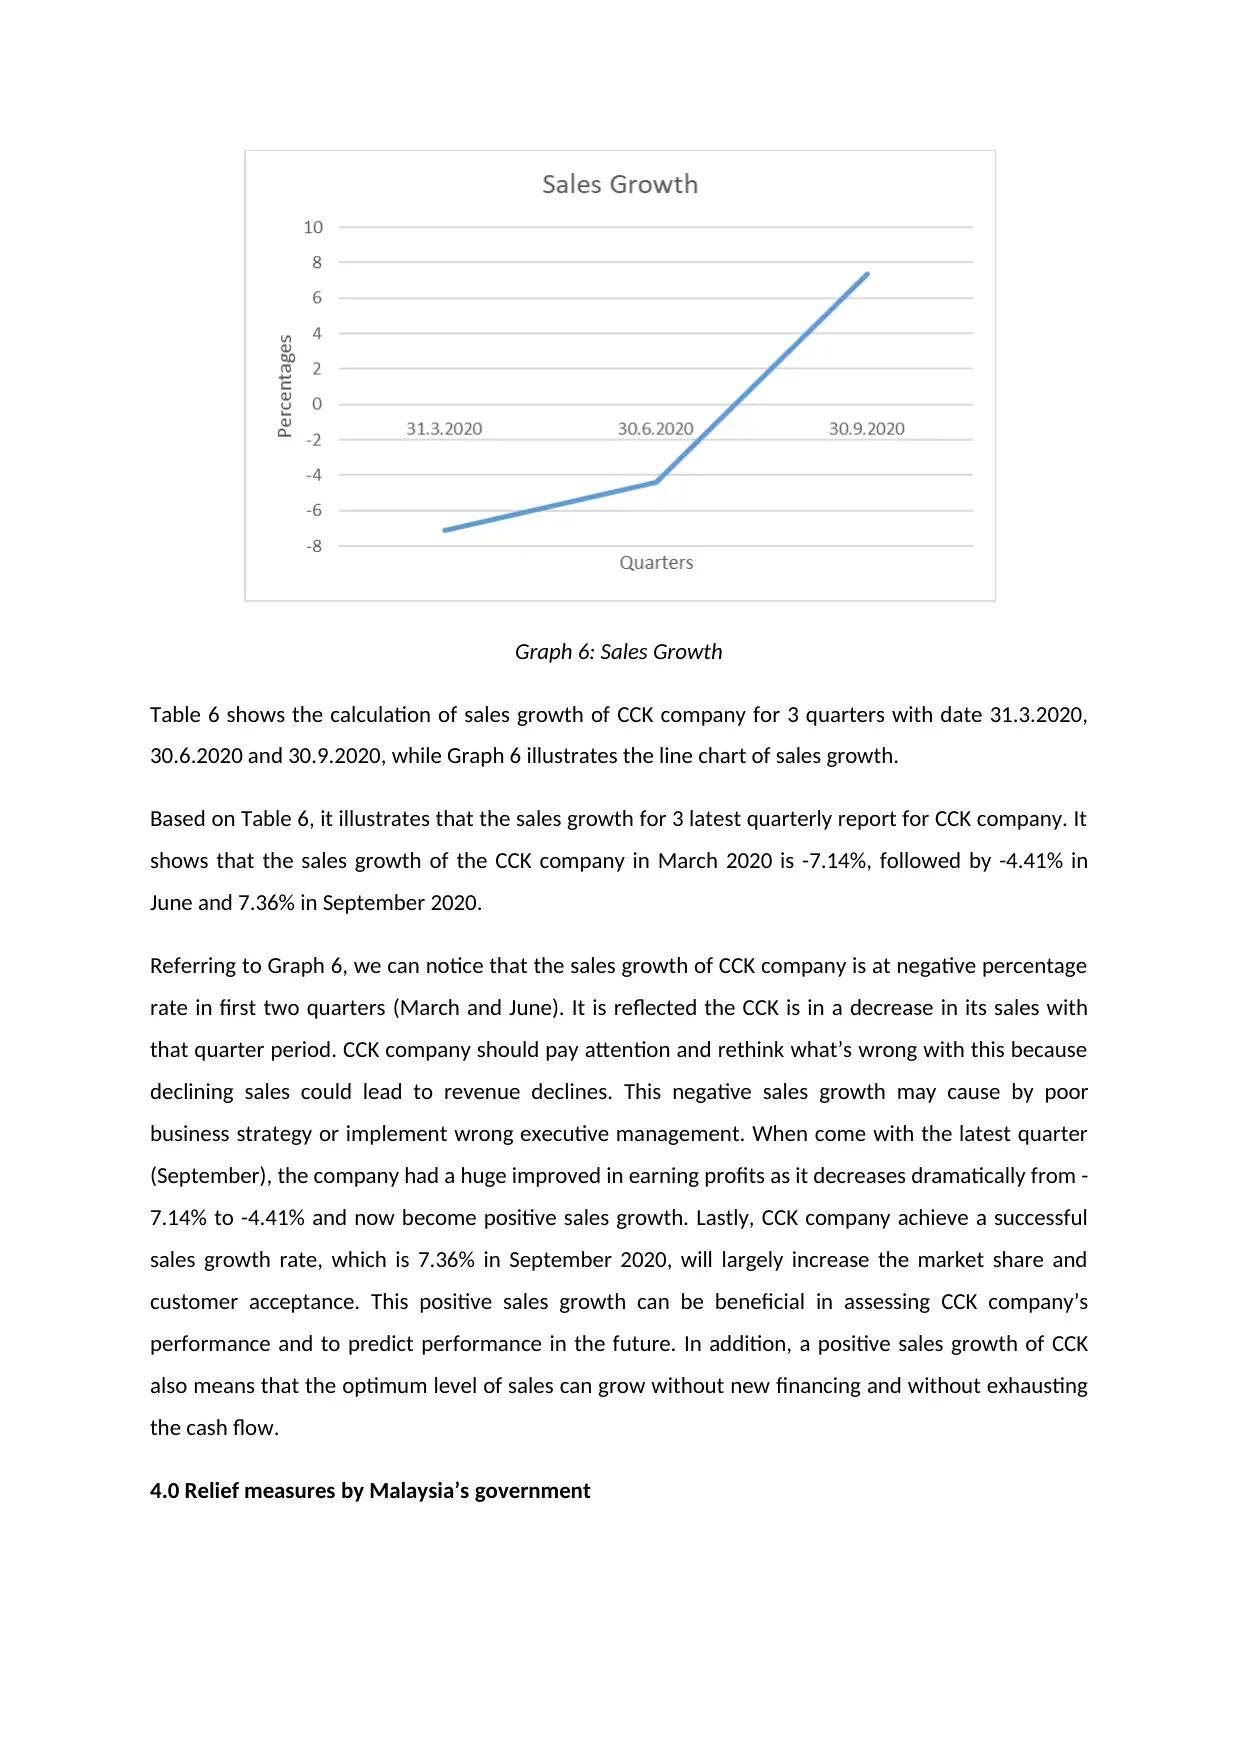
Table 6: Sales Growth
can cover all of the current liabilities without having to sell or liquidate other assets.
3.1 Sales growth
Sales growth is a metric that measures the ability of increase in sales over a specific period of time.
Without revenue growth, company is at dangerous place of being overtaken by competitors and
facing financial problem. It is not to be denied that sales growth is significant to the company as it is
tied directly to revenue and profitability which will affect the business performance and operation.
Sales growth also is a strategic indicator that is used in decision making by the board of directors and
highly influenced the execution of business strategy as well as stakeholders and sales team. The
formula of sales growth is subtracting the current period sales from that prior period sales. Then,
divide the result by the prior period sales and multiply by 100 to get the percent sales growth.
Sales Growth= (Current Period Sales−Prior Period Sales)
Prior Period Sales ×100
Table 6: Sales Growth
Paraphrase This Document
Need a fresh take? Get an instant paraphrase of this document with our AI Paraphraser
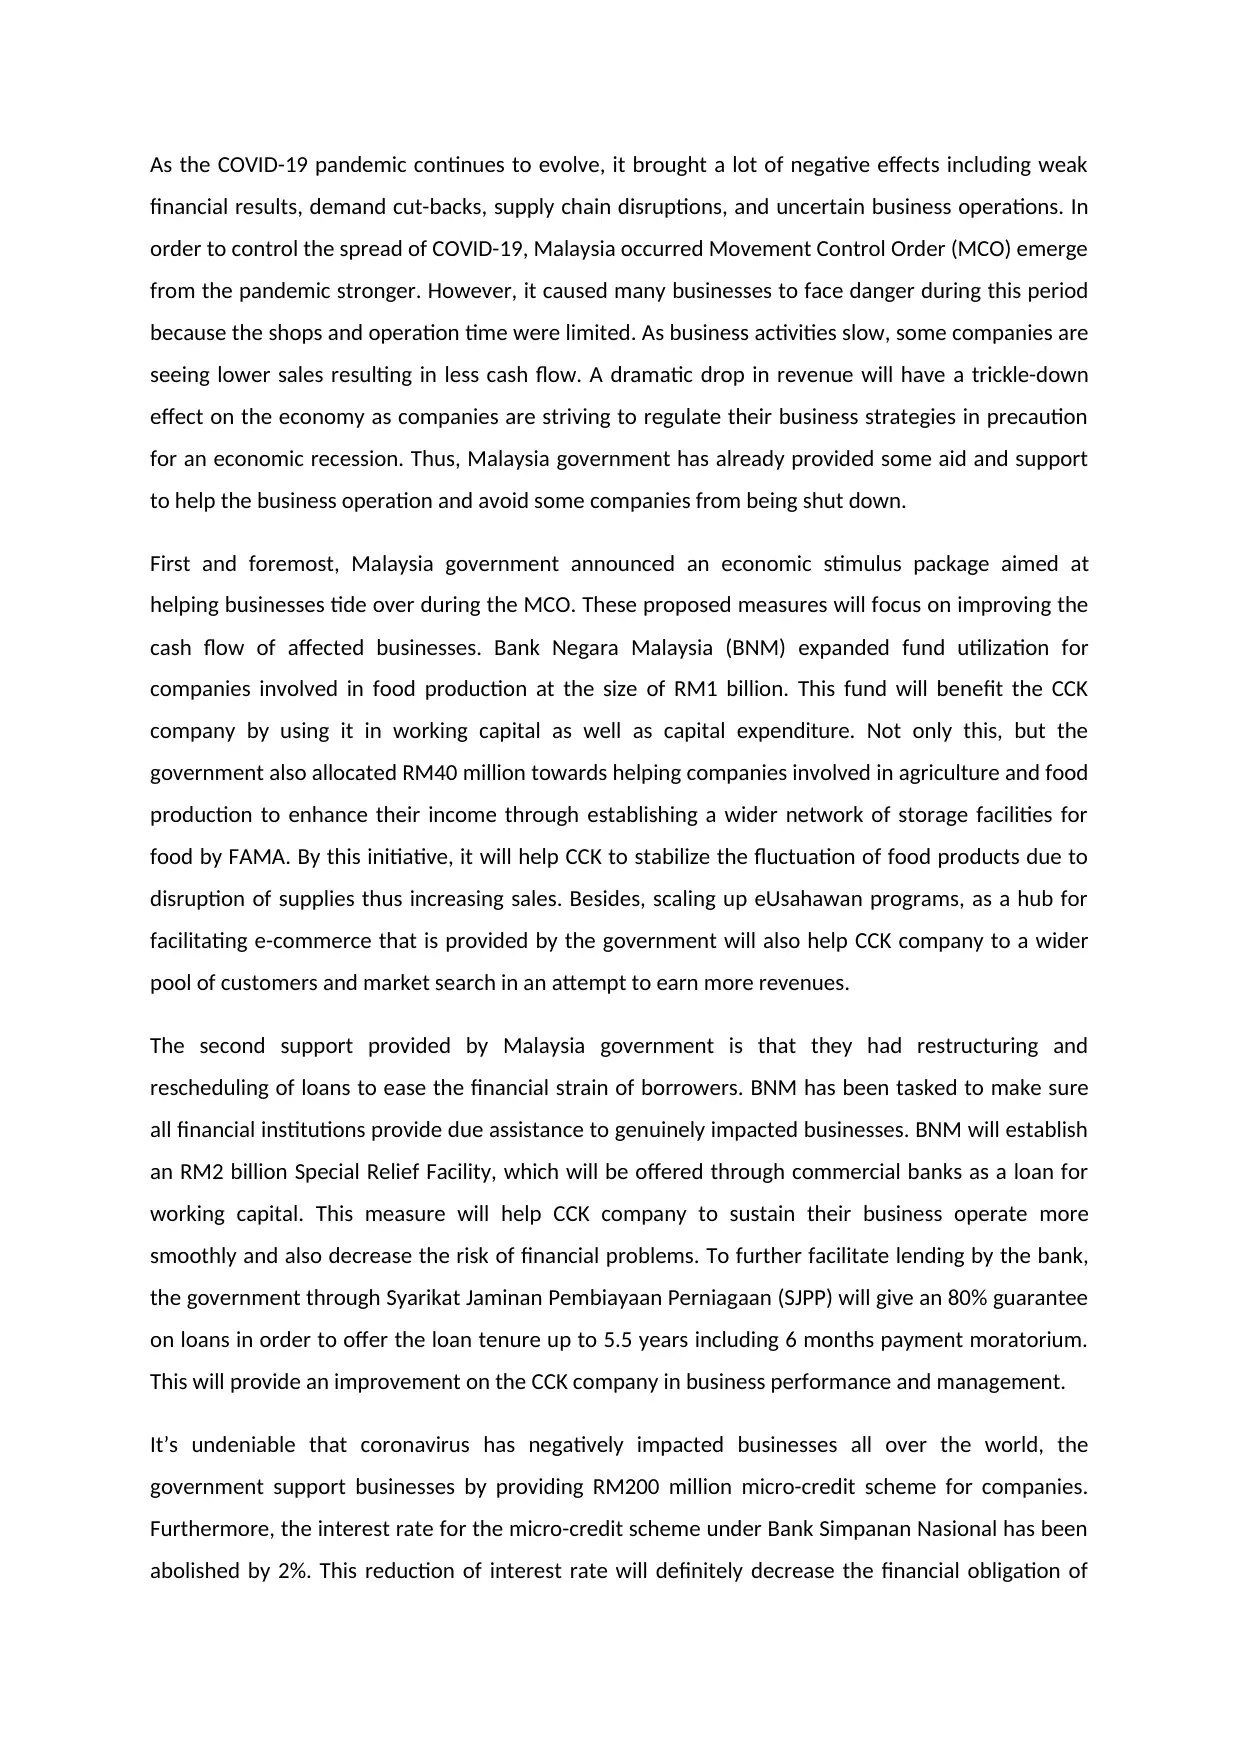
Graph 6: Sales Growth
Table 6 shows the calculation of sales growth of CCK company for 3 quarters with date 31.3.2020,
30.6.2020 and 30.9.2020, while Graph 6 illustrates the line chart of sales growth.
Based on Table 6, it illustrates that the sales growth for 3 latest quarterly report for CCK company. It
shows that the sales growth of the CCK company in March 2020 is -7.14%, followed by -4.41% in
June and 7.36% in September 2020.
Referring to Graph 6, we can notice that the sales growth of CCK company is at negative percentage
rate in first two quarters (March and June). It is reflected the CCK is in a decrease in its sales with
that quarter period. CCK company should pay attention and rethink what’s wrong with this because
declining sales could lead to revenue declines. This negative sales growth may cause by poor
business strategy or implement wrong executive management. When come with the latest quarter
(September), the company had a huge improved in earning profits as it decreases dramatically from -
7.14% to -4.41% and now become positive sales growth. Lastly, CCK company achieve a successful
sales growth rate, which is 7.36% in September 2020, will largely increase the market share and
customer acceptance. This positive sales growth can be beneficial in assessing CCK company’s
performance and to predict performance in the future. In addition, a positive sales growth of CCK
also means that the optimum level of sales can grow without new financing and without exhausting
the cash flow.
4.0 Relief measures by Malaysia’s government
As the COVID-19 pandemic continues to evolve, it brought a lot of negative effects including weak
financial results, demand cut-backs, supply chain disruptions, and uncertain business operations. In
order to control the spread of COVID-19, Malaysia occurred Movement Control Order (MCO) emerge
from the pandemic stronger. However, it caused many businesses to face danger during this period
because the shops and operation time were limited. As business activities slow, some companies are
seeing lower sales resulting in less cash flow. A dramatic drop in revenue will have a trickle-down
effect on the economy as companies are striving to regulate their business strategies in precaution
for an economic recession. Thus, Malaysia government has already provided some aid and support
to help the business operation and avoid some companies from being shut down.
First and foremost, Malaysia government announced an economic stimulus package aimed at
helping businesses tide over during the MCO. These proposed measures will focus on improving the
cash flow of affected businesses. Bank Negara Malaysia (BNM) expanded fund utilization for
companies involved in food production at the size of RM1 billion. This fund will benefit the CCK
company by using it in working capital as well as capital expenditure. Not only this, but the
government also allocated RM40 million towards helping companies involved in agriculture and food
production to enhance their income through establishing a wider network of storage facilities for
food by FAMA. By this initiative, it will help CCK to stabilize the fluctuation of food products due to
disruption of supplies thus increasing sales. Besides, scaling up eUsahawan programs, as a hub for
facilitating e-commerce that is provided by the government will also help CCK company to a wider
pool of customers and market search in an attempt to earn more revenues.
The second support provided by Malaysia government is that they had restructuring and
rescheduling of loans to ease the financial strain of borrowers. BNM has been tasked to make sure
all financial institutions provide due assistance to genuinely impacted businesses. BNM will establish
an RM2 billion Special Relief Facility, which will be offered through commercial banks as a loan for
working capital. This measure will help CCK company to sustain their business operate more
smoothly and also decrease the risk of financial problems. To further facilitate lending by the bank,
the government through Syarikat Jaminan Pembiayaan Perniagaan (SJPP) will give an 80% guarantee
on loans in order to offer the loan tenure up to 5.5 years including 6 months payment moratorium.
This will provide an improvement on the CCK company in business performance and management.
It’s undeniable that coronavirus has negatively impacted businesses all over the world, the
government support businesses by providing RM200 million micro-credit scheme for companies.
Furthermore, the interest rate for the micro-credit scheme under Bank Simpanan Nasional has been
abolished by 2%. This reduction of interest rate will definitely decrease the financial obligation of
⊘ This is a preview!⊘
Do you want full access?
Subscribe today to unlock all pages.
Trusted by 1+ million students worldwide
1 out of 17
Your All-in-One AI-Powered Toolkit for Academic Success.
+13062052269
info@desklib.com
Available 24*7 on WhatsApp / Email
![[object Object]](/_next/static/media/star-bottom.7253800d.svg)
Unlock your academic potential
Copyright © 2020–2026 A2Z Services. All Rights Reserved. Developed and managed by ZUCOL.