Impact of CDP on Carbon Emission Minimization in Developed Countries
VerifiedAdded on 2023/06/12
|14
|4057
|52
Report
AI Summary
This report examines the impact of the Carbon Disclosure Project (CDP) on minimizing carbon emissions, primarily focusing on developed countries. It employs the legitimacy theory to assess carbon disclosure practices, highlighting the role of companies in adopting emission-reducing techniques. The research uses secondary data from 2009 to 2015, analyzing companies from Belgium, UK, and Germany. Descriptive statistics and inferential analysis, including t-tests and correlation analysis, are used to evaluate the effectiveness of CDP in promoting carbon emission reduction. The findings indicate varying levels of carbon disclosure among companies and identify areas for future research, particularly concerning non-financial performance and strategic environmental management. Desklib provides a platform to explore similar assignments and access study resources.
Introduction
Climate change have become an issue of concern to both the developed and emerging
economies. The economic growth is important in eradicating poverty but it comes with some
challenges such as increased carbon emission from the companies (Panel, 2013). Development
and expansion of companies in a country lead to creation of job opportunities to the local
population (Katzenbach, and Smith, 2015). Carbon emission have led to great effect on the
climate change such as the global warming. Countries and companies are bringing their efforts
together to reduce the level of carbon emission to the environment (Hansen et al., 2013; Zhang,
Wang and Song, 2013). Developed countries are the high emitters of carbon dioxide gas to the
environment. For instance, the United States’ industrial and commercial sources were reported to
have emitted carbon dioxide gas three times more than the residents in the year 2010 (Nordhaus,
2010). Continued increase of carbon emission led to the emergence of Carbon Disclosure Project
that required the companies to be keeping records of carbon disclosure and reporting the records
within a certain period of time (Ascui and Lovell, 2012; Andrew, and Cortese, 2013). Even
though the companies are keeping records and reporting the carbon emission, they do little in
minimizing the emissions. Reports addressing the climate change challenges considered the
growing markets for products and services’ effects on the companies’ responses to the climate
change (Saka and Oshika, 2014). Despite the efforts and pressure mounted by the non-
governmental organization (CDP) on the companies’ report on carbon emissions, not all
companies respond to the provided emissions and climate change questionnaire on their next
course of action towards combating carbon emissions (Matsumura, Prakash and Vera-Muñoz,
2013). The rising concern from both private and public sectors help the CDP in mounting
pressure and encouraging companies to adopt and mitigate carbon emissions that lead to climate
Paraphrase This Document
Need a fresh take? Get an instant paraphrase of this document with our AI Paraphraser
change. This research is then aimed at assessing the effects of CDP towards minimizing carbon
emissions.
Summary of literature review
This research adopted legitimacy theory in the examination of carbon disclosure by both private
and public sectors. No theory has come clear in explaining corporate social responsibility
disclosure practices until when legitimacy theory came about and had wide dependence by the
researchers (Fernando, and Lawrence, 2014). Environmental and social disclosure can easily be
explained currently by using legitimacy theory (Deegan, 2014). Due to legitimacy ability of
providing disclosing strategies, legitimacy theory is preferred over other theories (Bakker, Raab,
and Milward, 2012). The strategies identified by the legitimacy theory can be adopted by the
organizations which might legitimize the existence of the organizations hence could be
empirically tested (Maier, Meyer and Steinbereithner, 2016). Agency theory on the other hand
provides the assumption details of the relationship between business agents and principals
(Westley et al., 2013). Through the adopted legitimacy theory, the existing problems in the
carbon disclosure can be somewhat resolved with ease and keeping all the set goals at check.
Business organizations and companies are the major sources of carbon emissions as in the
previous reviews (Huisingh, Zhang, Moore, Qiao and Li, 2015; Böttcher, and Müller, 2015). The
so referred companies are supposed to adopt new techniques that are aimed at minimizing carbon
emissions and keep it at the lowest level possible. The climate change made the companies and
other business organizations suffer some significant risks whose effects are felt in the value of
the organizations’ investments of shareholders (Okereke, Wittneben and Bowen, 2012). The
earlier researches show that there is existence of correlation between the share price and the
environmental performance (Eccles, Ioannou and Serafeim, 2014; Edwards, 2014). Performance
evaluation in conjunction with performance based incentives are used to protect shareholders’
interests. The levels of carbon emissions is almost unmanageable due to the companies’
managers’ lack of sufficient experience to manage emissions. As a result, the set target have
been difficult to be achieved.
Further studies on financial performance exhibited targets and incentives effects without
including the non-financial performance (Sierzchula, Bakker, Maat and van Wee, 2014.). Being
that carbon emissions and climate change is a bother to all the sectors, non-financial performance
and target operations was the identified gap. Furthermore, future research should be on the
relationship between non-financial performance and the environmental performance. Strategic
importance still remain hanging and sidelined in the firms’ management and operations since
firms are not quite familiar with it. Challenging targets might lead to increase in the number of
targets completed and less weight given to environment related targets.
Hypothesis development
Seminal articles have been covered in legitimacy theory on the control and separation of
ownership. Society can operate in the funny manner by revoking the contract awarded to an
organization if the society feel unsatisfied with organizations’ services (Marcuse, 2013). The
behavior of the agents can be bonded with the guide of principals’ interest related to incentive
performance and setting targets (Fayezi, O'Loughlin and Zutshi, 2012). Legitimacy theory plays
a vital role in explaining environmental and social disclosures in regards to carbon emissions. In
the hypothesis development, it is important to consider the advantages of legitimacy theory that
is not in other theories. One such advantage is providing disclosure strategies that companies
adopt to make their existence legitimate. Slacks are created due to available information
asymmetry that is targeted by the agents. In regards to aforementioned theory in the operational
⊘ This is a preview!⊘
Do you want full access?
Subscribe today to unlock all pages.
Trusted by 1+ million students worldwide
proxies, slack formed the dependent variables (DV) while the incentives provided by the
managers and budgetary process in setting easy targets are referred to in the past researches. In
order to understand carbon emissions, there is dire need for incorporating slack literature in the
operationalization and its application in carbon emissions. Independent variable in this research
will be information asymmetry even though there is their decrease with time. The numbers in the
organization for the past years in which no targets have been set are collected to measure the
information asymmetry on carbon emissions. Greater performance have the effects of greater
completion and the effects are moderated using the performance incentives. Managers in their sit
in the management role of the organization know the potentials of the organizations than the
shareholders or investors. Inverse proportionality exist between information asymmetry and the
created slacks by the managers.
Data collection
In order to exhaust the companies and countries’ response to climate change due to carbon
disclosure, electronic methods was applied to obtain CDP data from their database which
covered the period of six years from 2009 to 2015. In that regards therefore, the data used in this
research were secondary and covered a total population of 5,054 companies from various
countries such as China, Colombia, France, Mexico, South Korea, United Kingdom, USA,
Australia, Canada etc. the data consisted of bot categorical and numerical variables which led to
both categorical and numerical data. It was in the aim of CDP for all the companies from all
countries to comply and report their actions towards carbon disclosure. As a result therefore, this
research took a sample of companies from three developed countries i.e. Belgium, UK and
Germany. The sample size used was 30 companies from the three stated countries and have their
efforts evaluated in the period of the past seven years from 2009 to 2015. From the entire data
Paraphrase This Document
Need a fresh take? Get an instant paraphrase of this document with our AI Paraphraser
set, thirty samples were randomly selected basing particularly on the three developed countries
which covered a relatively wider range of companies.
The retrieved data were in excel data files and were organized and prepared in the same software
for analysis. Descriptive and inferential statistical analysis were conducted to leverage the
characteristics and the companies’ response towards minimizing carbon disclosure in their daily
activities in the covered period.
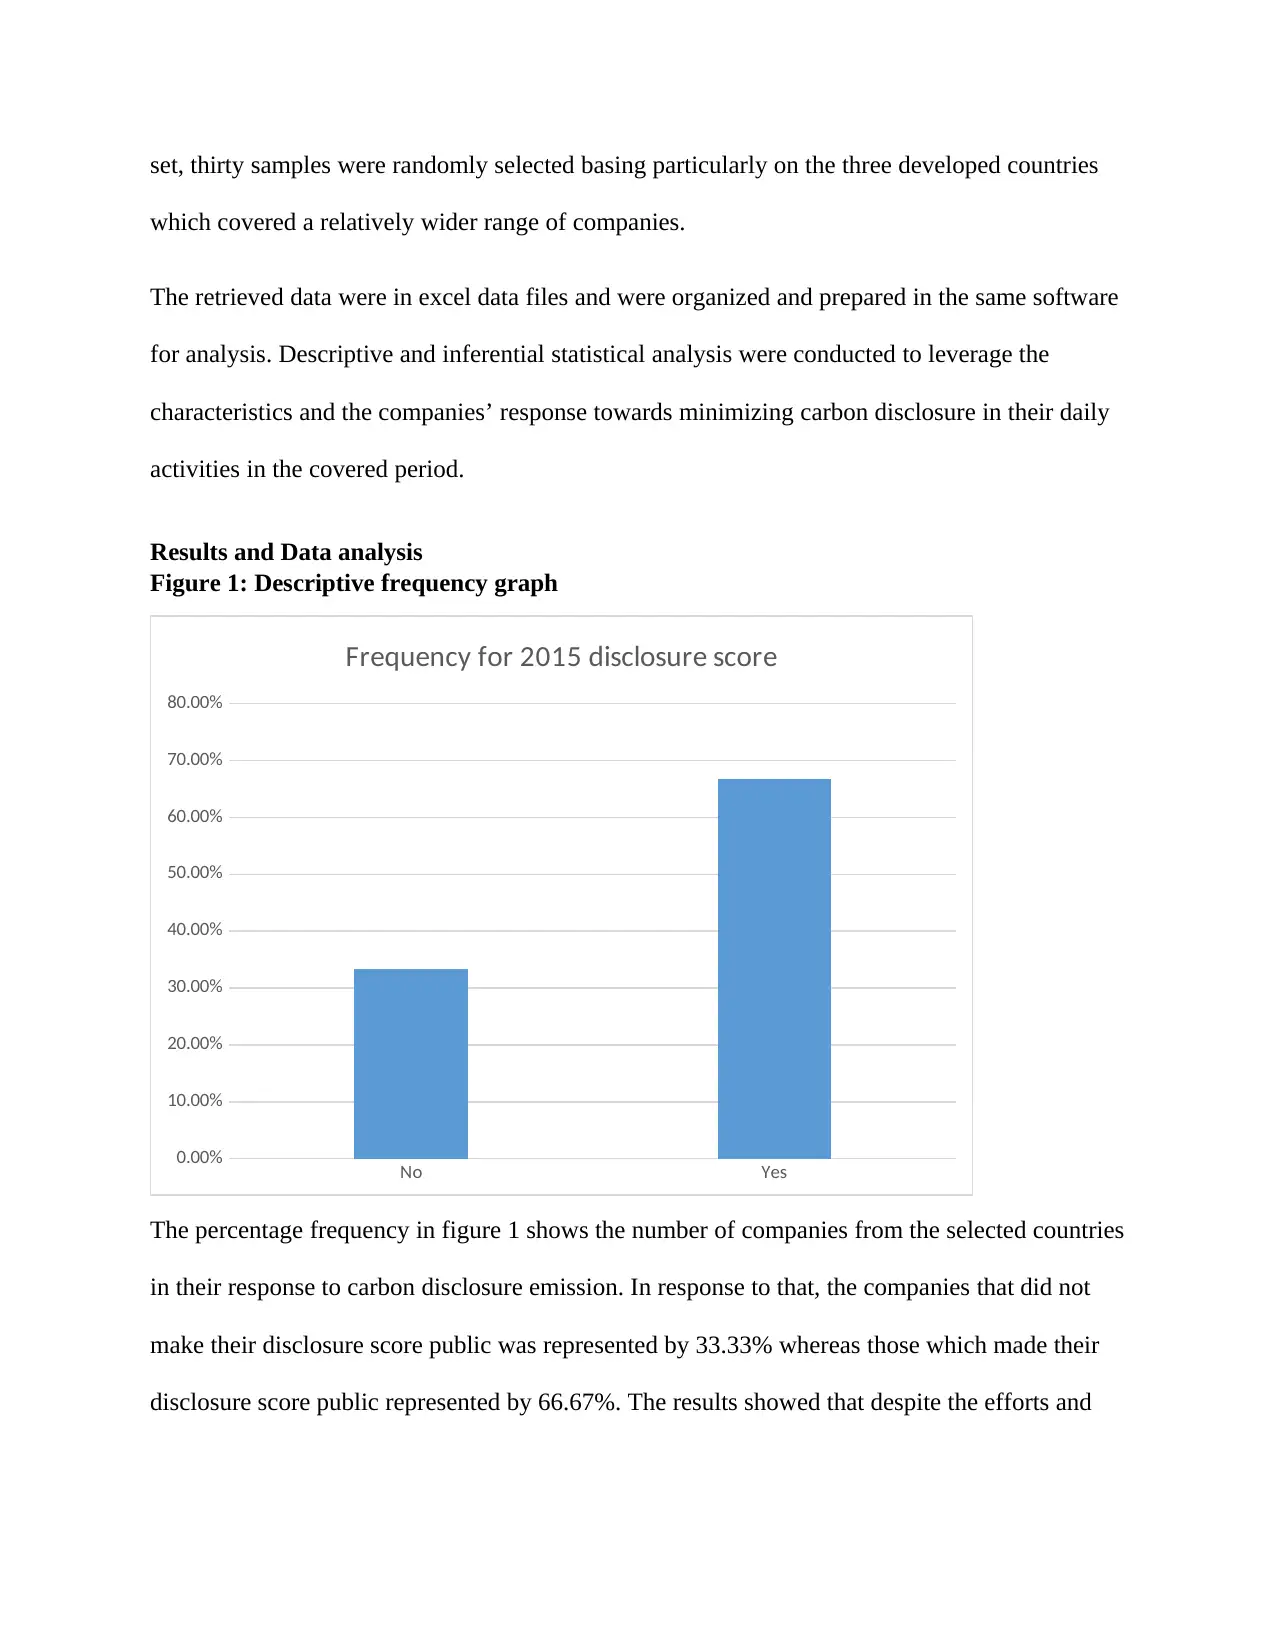
Results and Data analysis
Figure 1: Descriptive frequency graph
No Yes
0.00%
10.00%
20.00%
30.00%
40.00%
50.00%
60.00%
70.00%
80.00%
Frequency for 2015 disclosure score
The percentage frequency in figure 1 shows the number of companies from the selected countries
in their response to carbon disclosure emission. In response to that, the companies that did not
make their disclosure score public was represented by 33.33% whereas those which made their
disclosure score public represented by 66.67%. The results showed that despite the efforts and
which covered a relatively wider range of companies.
The retrieved data were in excel data files and were organized and prepared in the same software
for analysis. Descriptive and inferential statistical analysis were conducted to leverage the
characteristics and the companies’ response towards minimizing carbon disclosure in their daily
activities in the covered period.
Results and Data analysis
Figure 1: Descriptive frequency graph
No Yes
0.00%
10.00%
20.00%
30.00%
40.00%
50.00%
60.00%
70.00%
80.00%
Frequency for 2015 disclosure score
The percentage frequency in figure 1 shows the number of companies from the selected countries
in their response to carbon disclosure emission. In response to that, the companies that did not
make their disclosure score public was represented by 33.33% whereas those which made their
disclosure score public represented by 66.67%. The results showed that despite the efforts and
the debates on reporting carbon emission to the environment by the companies, some of the
companies could still defy and not report their carbon emissions to the public.
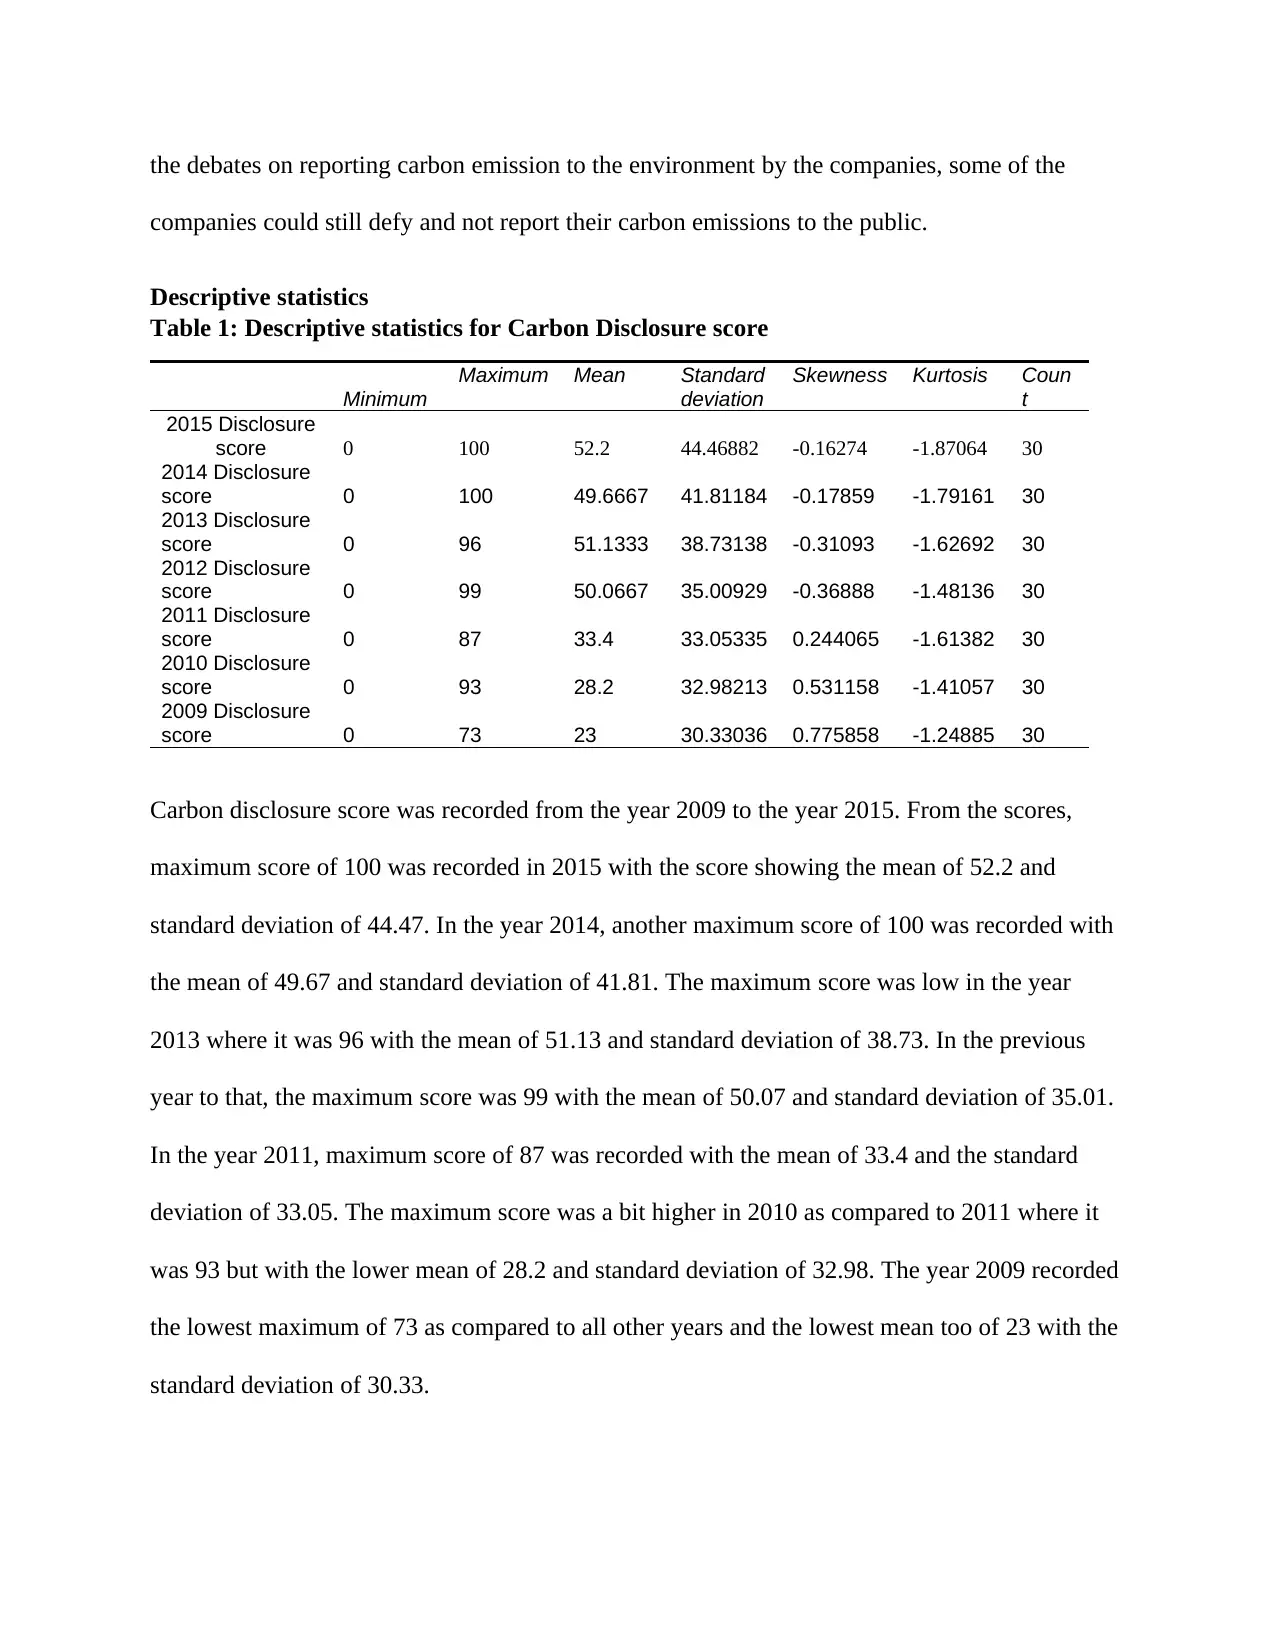
Descriptive statistics
Table 1: Descriptive statistics for Carbon Disclosure score
Minimum
Maximum Mean Standard
deviation
Skewness Kurtosis Coun
t
2015 Disclosure
score 0 100 52.2 44.46882 -0.16274 -1.87064 30
2014 Disclosure
score 0 100 49.6667 41.81184 -0.17859 -1.79161 30
2013 Disclosure
score 0 96 51.1333 38.73138 -0.31093 -1.62692 30
2012 Disclosure
score 0 99 50.0667 35.00929 -0.36888 -1.48136 30
2011 Disclosure
score 0 87 33.4 33.05335 0.244065 -1.61382 30
2010 Disclosure
score 0 93 28.2 32.98213 0.531158 -1.41057 30
2009 Disclosure
score 0 73 23 30.33036 0.775858 -1.24885 30
Carbon disclosure score was recorded from the year 2009 to the year 2015. From the scores,
maximum score of 100 was recorded in 2015 with the score showing the mean of 52.2 and
standard deviation of 44.47. In the year 2014, another maximum score of 100 was recorded with
the mean of 49.67 and standard deviation of 41.81. The maximum score was low in the year
2013 where it was 96 with the mean of 51.13 and standard deviation of 38.73. In the previous
year to that, the maximum score was 99 with the mean of 50.07 and standard deviation of 35.01.
In the year 2011, maximum score of 87 was recorded with the mean of 33.4 and the standard
deviation of 33.05. The maximum score was a bit higher in 2010 as compared to 2011 where it
was 93 but with the lower mean of 28.2 and standard deviation of 32.98. The year 2009 recorded
the lowest maximum of 73 as compared to all other years and the lowest mean too of 23 with the
standard deviation of 30.33.
companies could still defy and not report their carbon emissions to the public.
Descriptive statistics
Table 1: Descriptive statistics for Carbon Disclosure score
Minimum
Maximum Mean Standard
deviation
Skewness Kurtosis Coun
t
2015 Disclosure
score 0 100 52.2 44.46882 -0.16274 -1.87064 30
2014 Disclosure
score 0 100 49.6667 41.81184 -0.17859 -1.79161 30
2013 Disclosure
score 0 96 51.1333 38.73138 -0.31093 -1.62692 30
2012 Disclosure
score 0 99 50.0667 35.00929 -0.36888 -1.48136 30
2011 Disclosure
score 0 87 33.4 33.05335 0.244065 -1.61382 30
2010 Disclosure
score 0 93 28.2 32.98213 0.531158 -1.41057 30
2009 Disclosure
score 0 73 23 30.33036 0.775858 -1.24885 30
Carbon disclosure score was recorded from the year 2009 to the year 2015. From the scores,
maximum score of 100 was recorded in 2015 with the score showing the mean of 52.2 and
standard deviation of 44.47. In the year 2014, another maximum score of 100 was recorded with
the mean of 49.67 and standard deviation of 41.81. The maximum score was low in the year
2013 where it was 96 with the mean of 51.13 and standard deviation of 38.73. In the previous
year to that, the maximum score was 99 with the mean of 50.07 and standard deviation of 35.01.
In the year 2011, maximum score of 87 was recorded with the mean of 33.4 and the standard
deviation of 33.05. The maximum score was a bit higher in 2010 as compared to 2011 where it
was 93 but with the lower mean of 28.2 and standard deviation of 32.98. The year 2009 recorded
the lowest maximum of 73 as compared to all other years and the lowest mean too of 23 with the
standard deviation of 30.33.
⊘ This is a preview!⊘
Do you want full access?
Subscribe today to unlock all pages.
Trusted by 1+ million students worldwide
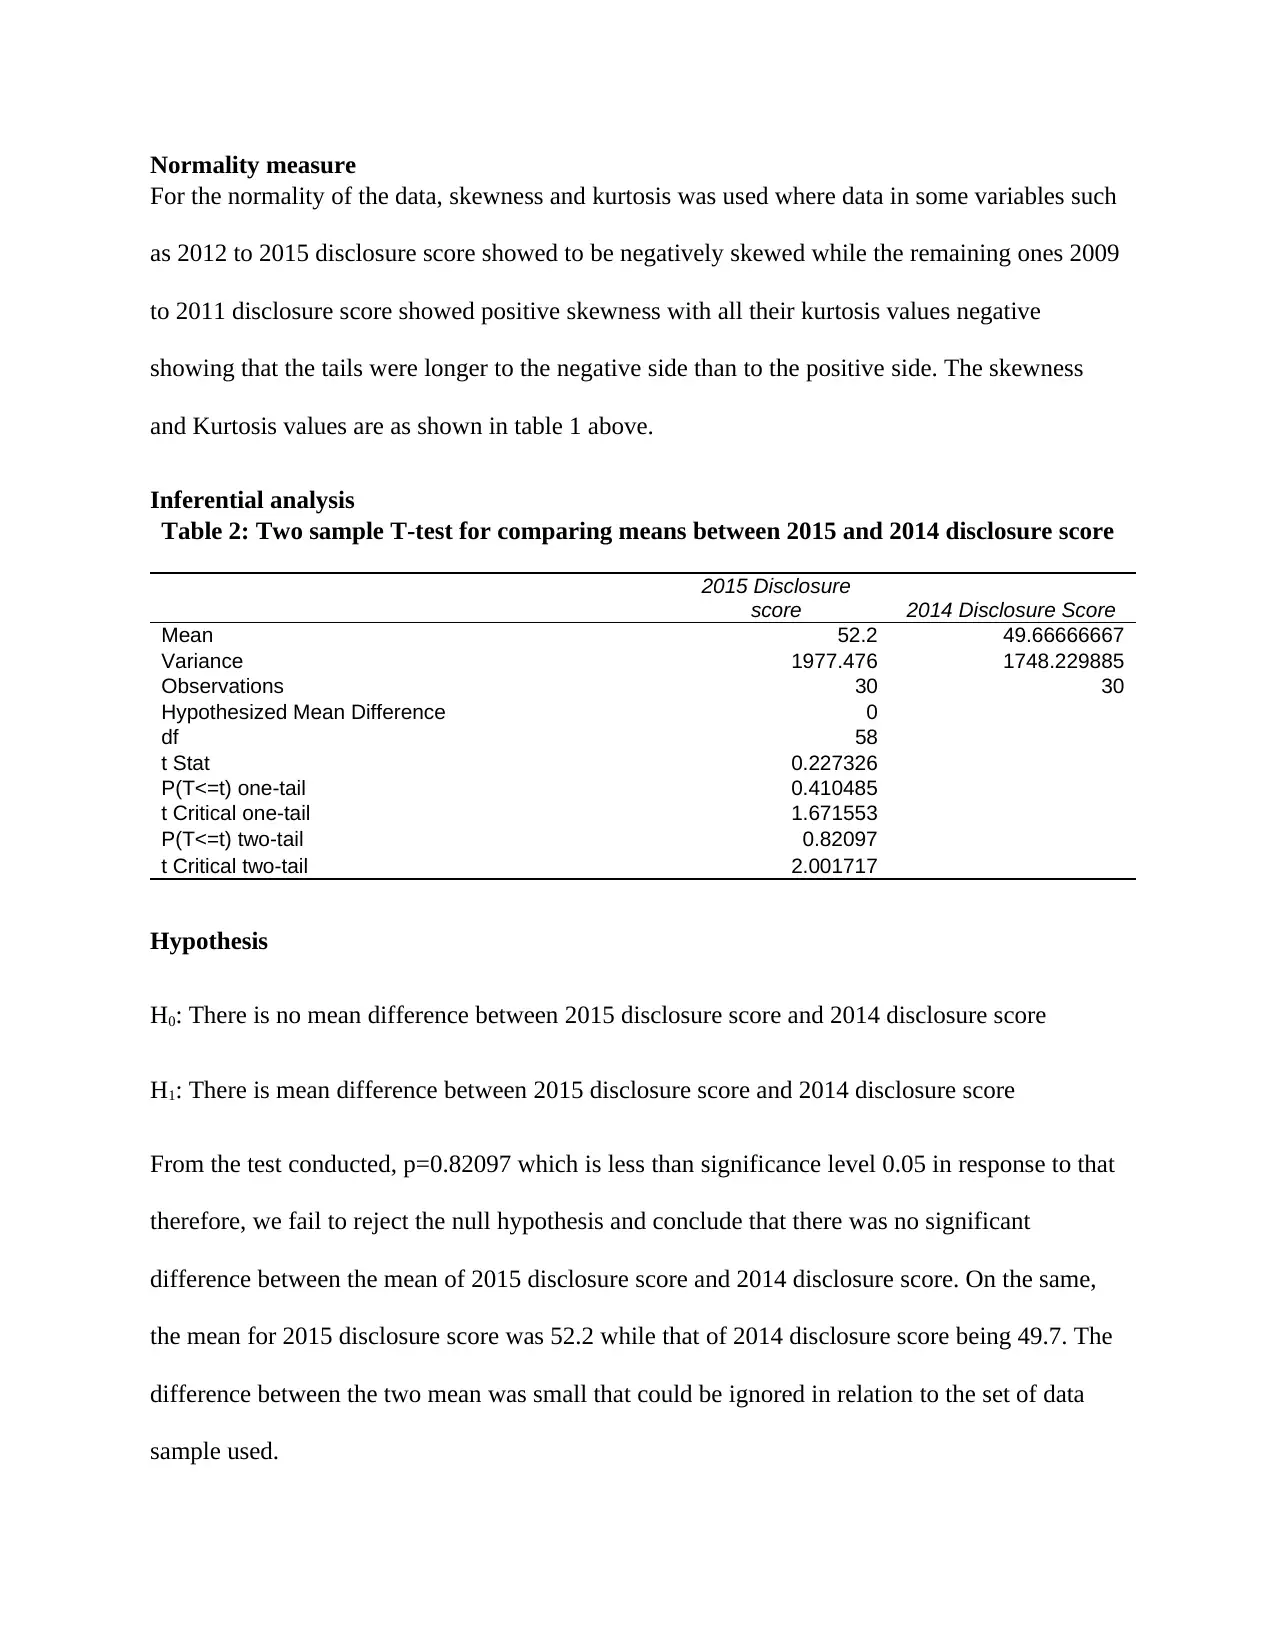
Normality measure
For the normality of the data, skewness and kurtosis was used where data in some variables such
as 2012 to 2015 disclosure score showed to be negatively skewed while the remaining ones 2009
to 2011 disclosure score showed positive skewness with all their kurtosis values negative
showing that the tails were longer to the negative side than to the positive side. The skewness
and Kurtosis values are as shown in table 1 above.
Inferential analysis
Table 2: Two sample T-test for comparing means between 2015 and 2014 disclosure score
2015 Disclosure
score 2014 Disclosure Score
Mean 52.2 49.66666667
Variance 1977.476 1748.229885
Observations 30 30
Hypothesized Mean Difference 0
df 58
t Stat 0.227326
P(T<=t) one-tail 0.410485
t Critical one-tail 1.671553
P(T<=t) two-tail 0.82097
t Critical two-tail 2.001717
Hypothesis
H0: There is no mean difference between 2015 disclosure score and 2014 disclosure score
H1: There is mean difference between 2015 disclosure score and 2014 disclosure score
From the test conducted, p=0.82097 which is less than significance level 0.05 in response to that
therefore, we fail to reject the null hypothesis and conclude that there was no significant
difference between the mean of 2015 disclosure score and 2014 disclosure score. On the same,
the mean for 2015 disclosure score was 52.2 while that of 2014 disclosure score being 49.7. The
difference between the two mean was small that could be ignored in relation to the set of data
sample used.
Paraphrase This Document
Need a fresh take? Get an instant paraphrase of this document with our AI Paraphraser
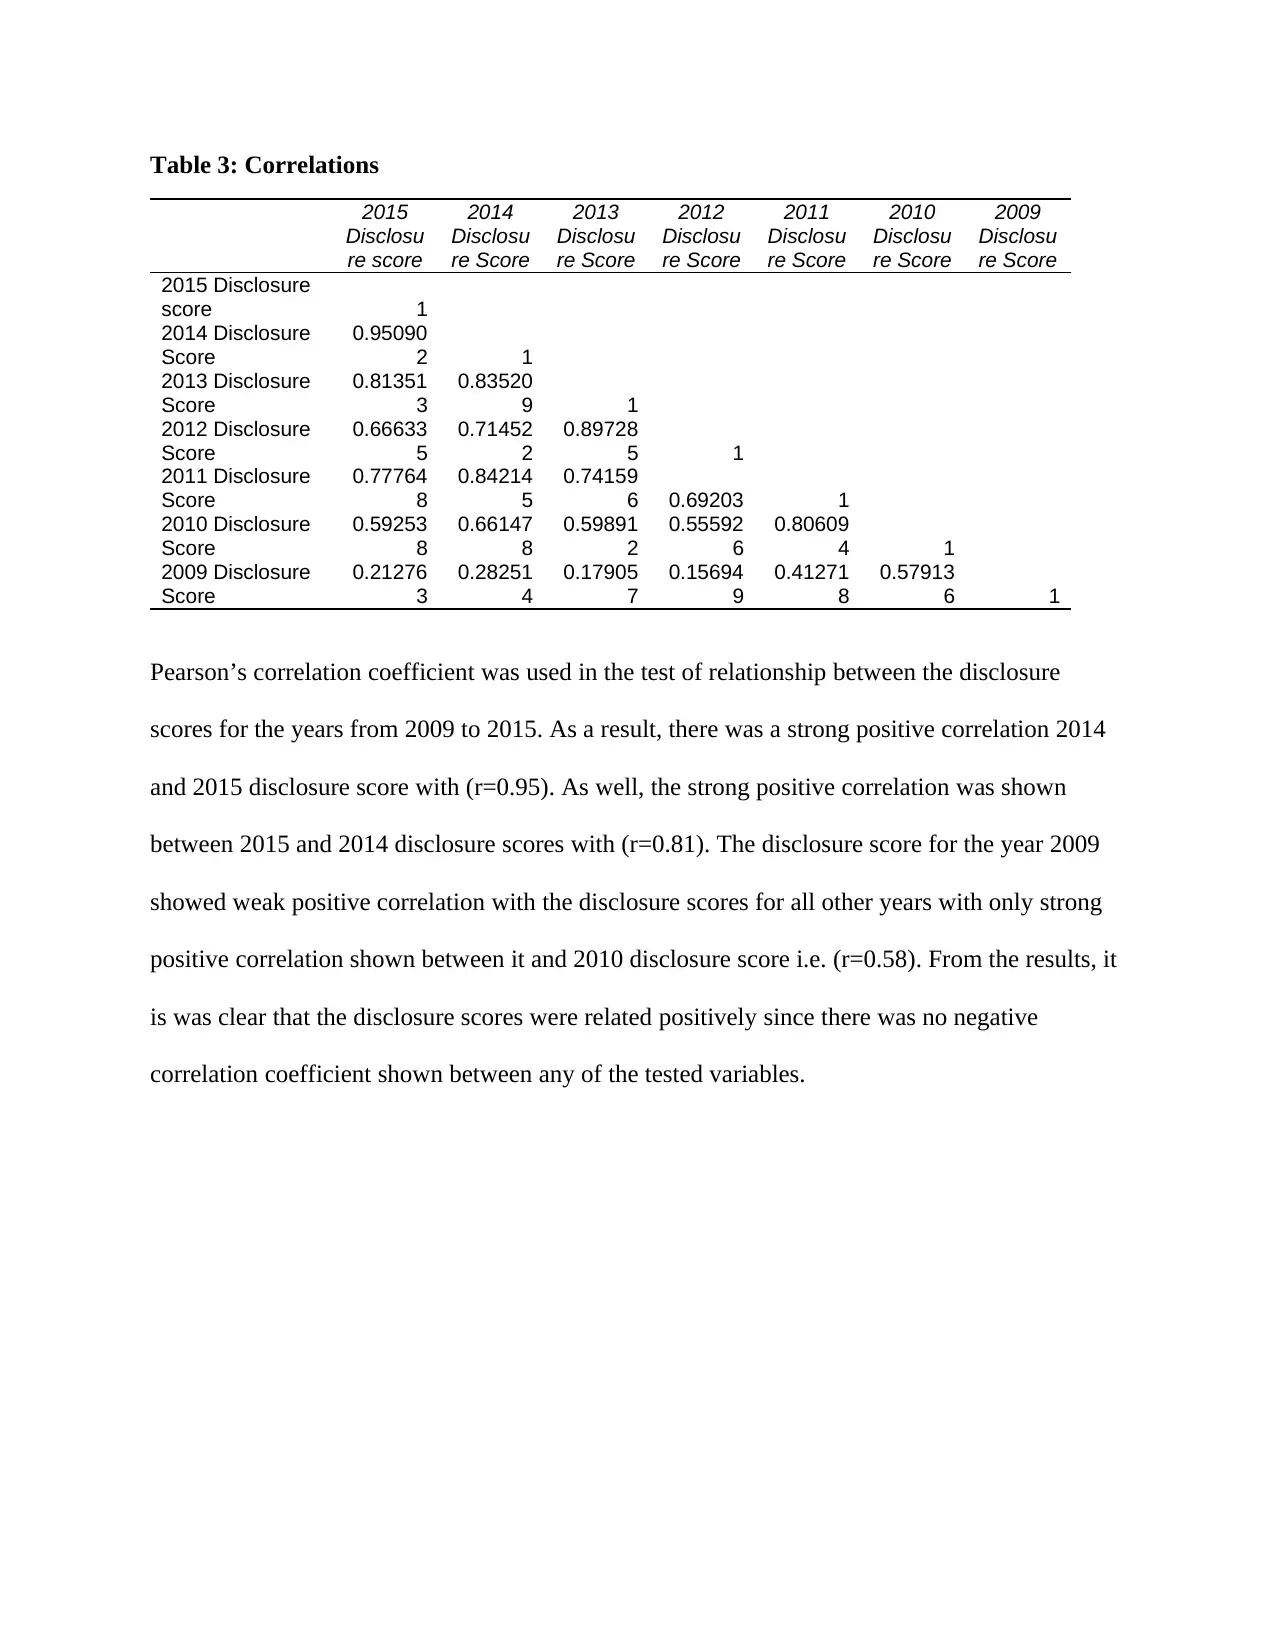
Table 3: Correlations
2015
Disclosu
re score
2014
Disclosu
re Score
2013
Disclosu
re Score
2012
Disclosu
re Score
2011
Disclosu
re Score
2010
Disclosu
re Score
2009
Disclosu
re Score
2015 Disclosure
score 1
2014 Disclosure
Score
0.95090
2 1
2013 Disclosure
Score
0.81351
3
0.83520
9 1
2012 Disclosure
Score
0.66633
5
0.71452
2
0.89728
5 1
2011 Disclosure
Score
0.77764
8
0.84214
5
0.74159
6 0.69203 1
2010 Disclosure
Score
0.59253
8
0.66147
8
0.59891
2
0.55592
6
0.80609
4 1
2009 Disclosure
Score
0.21276
3
0.28251
4
0.17905
7
0.15694
9
0.41271
8
0.57913
6 1
Pearson’s correlation coefficient was used in the test of relationship between the disclosure
scores for the years from 2009 to 2015. As a result, there was a strong positive correlation 2014
and 2015 disclosure score with (r=0.95). As well, the strong positive correlation was shown
between 2015 and 2014 disclosure scores with (r=0.81). The disclosure score for the year 2009
showed weak positive correlation with the disclosure scores for all other years with only strong
positive correlation shown between it and 2010 disclosure score i.e. (r=0.58). From the results, it
is was clear that the disclosure scores were related positively since there was no negative
correlation coefficient shown between any of the tested variables.
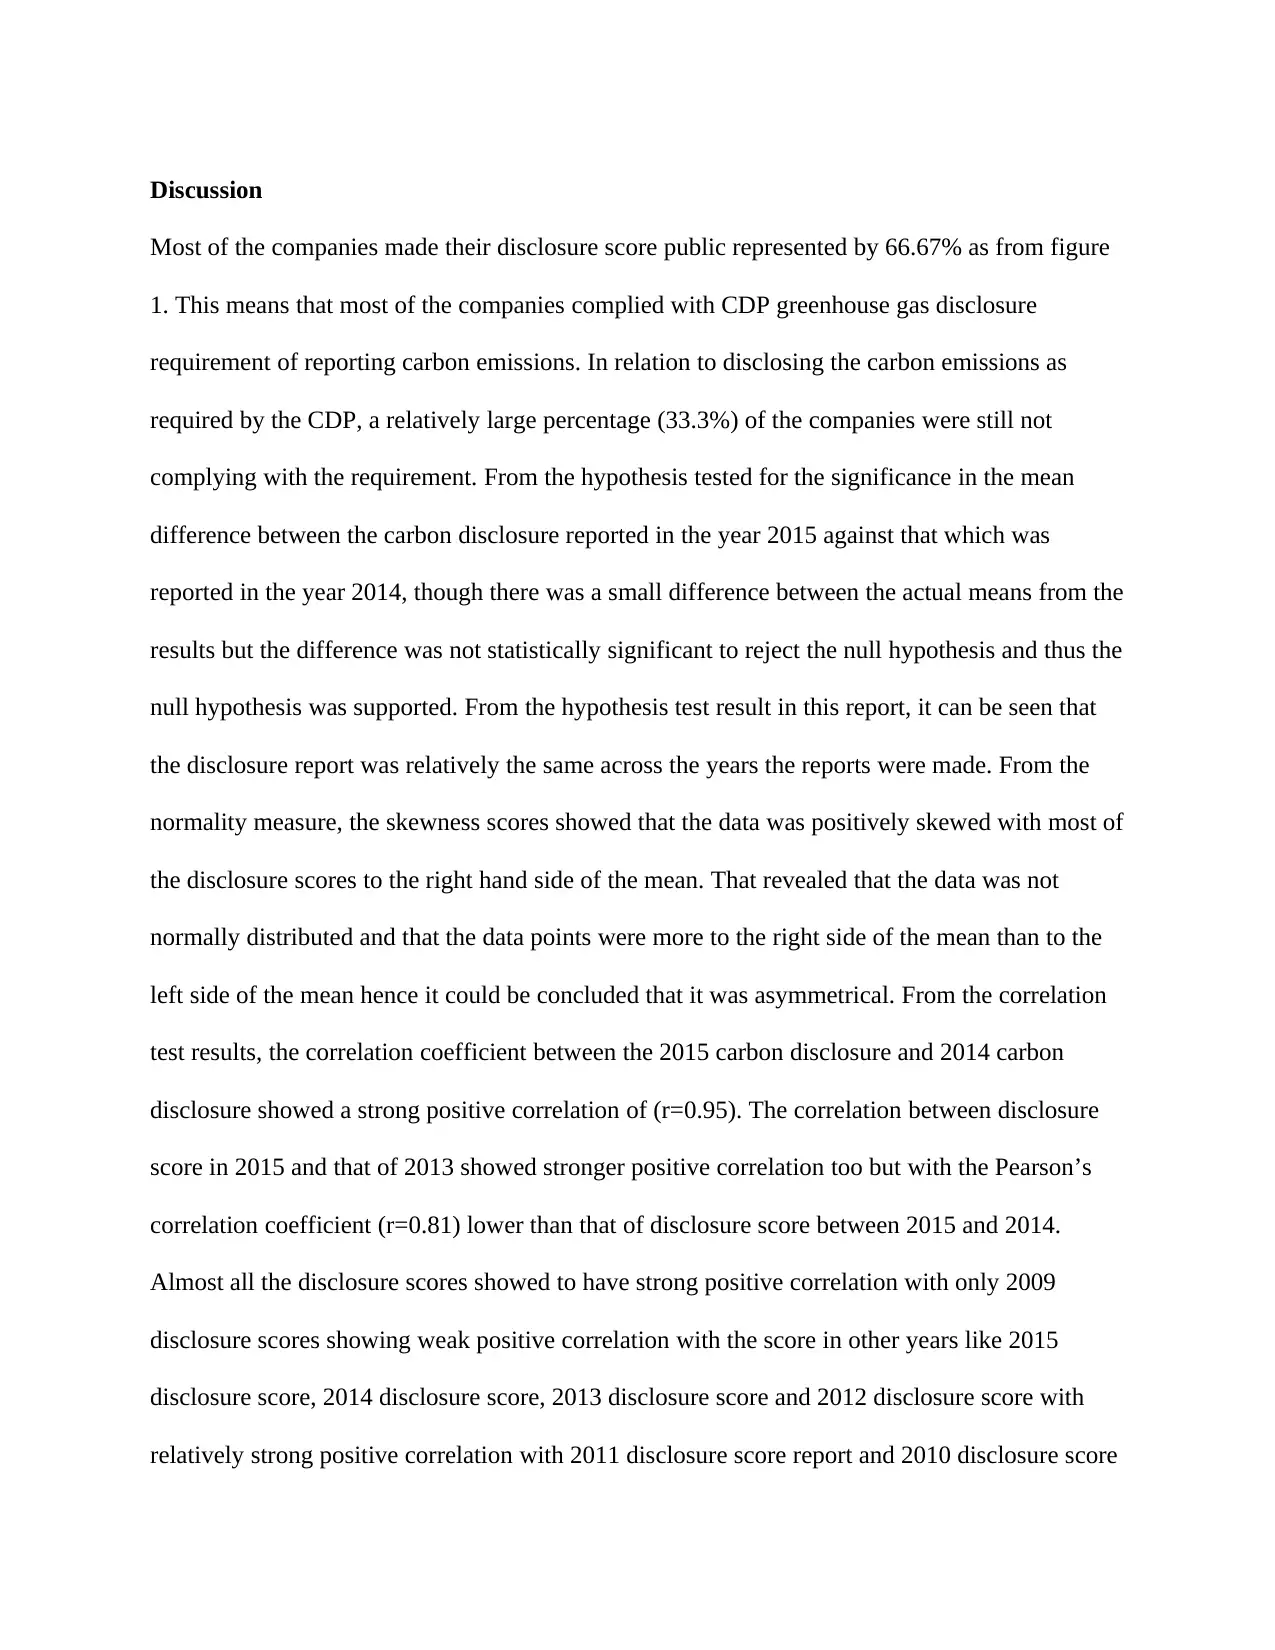
Discussion
Most of the companies made their disclosure score public represented by 66.67% as from figure
1. This means that most of the companies complied with CDP greenhouse gas disclosure
requirement of reporting carbon emissions. In relation to disclosing the carbon emissions as
required by the CDP, a relatively large percentage (33.3%) of the companies were still not
complying with the requirement. From the hypothesis tested for the significance in the mean
difference between the carbon disclosure reported in the year 2015 against that which was
reported in the year 2014, though there was a small difference between the actual means from the
results but the difference was not statistically significant to reject the null hypothesis and thus the
null hypothesis was supported. From the hypothesis test result in this report, it can be seen that
the disclosure report was relatively the same across the years the reports were made. From the
normality measure, the skewness scores showed that the data was positively skewed with most of
the disclosure scores to the right hand side of the mean. That revealed that the data was not
normally distributed and that the data points were more to the right side of the mean than to the
left side of the mean hence it could be concluded that it was asymmetrical. From the correlation
test results, the correlation coefficient between the 2015 carbon disclosure and 2014 carbon
disclosure showed a strong positive correlation of (r=0.95). The correlation between disclosure
score in 2015 and that of 2013 showed stronger positive correlation too but with the Pearson’s
correlation coefficient (r=0.81) lower than that of disclosure score between 2015 and 2014.
Almost all the disclosure scores showed to have strong positive correlation with only 2009
disclosure scores showing weak positive correlation with the score in other years like 2015
disclosure score, 2014 disclosure score, 2013 disclosure score and 2012 disclosure score with
relatively strong positive correlation with 2011 disclosure score report and 2010 disclosure score
⊘ This is a preview!⊘
Do you want full access?
Subscribe today to unlock all pages.
Trusted by 1+ million students worldwide

report i.e. (r=0.41 and r=0.58) respectively. This could tell that the disclosure scores were
improving over the latest years from the previous years as this can as well be supported by the
mean disclosure results from the data e.g. 2013 mean disclosure score from the sampled
companies was 51.13 and the disclosure score for the year 2009 had the mean of 23. Large
difference (28.13) of the mean disclosure scores reported in the years showed improvement in
the companies’ report on the carbon disclosure.
Paraphrase This Document
Need a fresh take? Get an instant paraphrase of this document with our AI Paraphraser
Limitations of the study
This research only tested on the correlation and the mean difference between the carbon
disclosure scores for the years 2009 to 2015. The root cause of the mean difference and the
importance of the disclosure values have not been discussed thus remained unclear. In the future
research, it would be important if they would carry out the research on the practical methods that
should be applied by the companies both in public and private sectors to minimize or fully do
away the carbon emissions and control the climate change. Furthermore, after the carbon
disclosure reported by the companies, nothing much seem to be done due to lack of directions to
take since there were no penalties imposed on the companies defaulting to give the carbon
disclosure reports. The report did not cover what the CDP does to the companies that file their
reports every required period whether or not they are rewarded to keep others dedicate their
potential towards meeting the same goal of reducing keeping the carbon disclosure records on
check and thus working towards minimizing the emissions by acquiring environment friendly
sources of energy thus dealing with climate change. This study adopted legitimacy theory which
mentioned of identifying the strategies for the companies to adopt in legitimizing their existence
but did not explicate any of such strategies. Finally, this study identified that the existing theories
had not in any way explained the relationship that exist between non-financial performance and
the environmental performance. This is the gap of knowledge that be focused on for future
research.
Further research
Referring to the limitation identified from this report, further research should address the
importance of the companies’ disclosure score values for clarity. When this is done, the
proportion of the companies that were was reported to have not been disclosing their annual
carbon disclosure data might be drawn and convinced to comply with the CDP requirement by

providing the disclosure reports. Further, future research should be conducted on the practical
methods that should be applied by the companies in both public and private sectors to fully
minimize the carbon emissions by the companies and have climate change under control.
Researches to come in the future should be on encouraging the companies in complying with the
disclosure report as outlined by the CDP. In that regard, researches should be conducted
suggesting penalties that should be imposed on the companies that fail to provide the carbon
emissions disclosure report to prohibit companies from defaulting to give their disclosure report.
⊘ This is a preview!⊘
Do you want full access?
Subscribe today to unlock all pages.
Trusted by 1+ million students worldwide
1 out of 14
Related Documents


Your All-in-One AI-Powered Toolkit for Academic Success.
+13062052269
info@desklib.com
Available 24*7 on WhatsApp / Email
![[object Object]](/_next/static/media/star-bottom.7253800d.svg)
Unlock your academic potential
Copyright © 2020–2026 A2Z Services. All Rights Reserved. Developed and managed by ZUCOL.