A Study on Celebrity Influence and Consumer Buying Decisions in India
VerifiedAdded on 2023/01/06
|51
|8889
|41
Report
AI Summary
This report examines the influence of celebrities on consumer buying decisions in India, utilizing both descriptive and quantitative research methodologies. The study explores the use of surveys, quantitative analysis, and the impact of variables like attractiveness and credibility. The research considers the challenges of data collection, including the COVID-19 pandemic, and addresses the importance of buyer attitudes and perceptions. The analysis includes reliability tests (Cronbach's alpha), correlation, and linear regression to assess the relationship between celebrity influence and consumer purchasing behavior. The report focuses on both dependent and independent variables, such as consumer buying decisions and celebrity attributes, respectively, to provide insights into the effectiveness of celebrity endorsements in the Indian market. The findings aim to identify cultural attributes of advertising and the impact of celebrities on consumer preferences, offering valuable information for marketers and researchers. The study utilizes SPSS and Excel software for data analysis, and the results are interpreted to understand the impact of celebrity presence on consumer buying choices.
Chapter 3/4 Methodology-
Descriptive research- Descriptive study is described as a procedure of analysis, which specifies
the conditions of the surveyed group or phenomena. This approach concentrates more on the
research topic's "what" than the research topic's "why." The key focus of the descriptive analysis
approach is to explain the essence of a population sample, without concentrating on "why" a
specific occurrence exists. In other words, the topic of the study is "identified," without
explaining "why" this occurs. A method of description analysis can be used in several forms and
for different purposes (Kumar, 2019). However, the survey objectives and survey architecture
are critical before joining any survey. In the aspect of above research topic “Celebrity Influence
on Consumer’s Buying Decision in India”. This types of research can be useful; this is so
because there is huge number of data in terms of variables including dependent and independent.
In addition to this, the descriptive research method is suitable to do analysis of a range of
quantitative and qualitative information. Thus, this approach will be useful in relation to above
research topic. Though, there are some other methods too in order to perform research of given
data set but each of them has some issues like ineffectiveness due to higher volume of data set.
Quantitative analysis is characterised by collecting quantifiable data and using statistical,
analytical, or computational techniques as a systematic analysis of phenomena. Quantitative
analysis uses qualitative tools to gather information from current and prospective consumers and
to submit online surveys, internet polling, questionnaires, etc. For the most part, quantitative
outcome analysis is carried out in the social sciences using statistical techniques mentioned
above to gather objective results from the study. Researchers and data analysts in this analysis
approach apply statistical structures and hypotheses relating to the quantities at stake. The
quantitative research can be carried out in two ways named as primary quantitative research
method and secondary quantitative research method (Mohajan, 2018). The primary types of
quantitative research are used in order to conduct market research. Such as in the context of
above research topic, this can be used in order to assess information about customers’ buying
decision and credibility of celebrities to influence customers. On the other hands, secondary
research can be used on gathered information under primary research. Herein, above topic this
kinds of research cannot be applied because of types of topic. Another approach with collecting
data on the impact of celebrities has been through rotation concept of television commercials,
Paraphrase This Document
Need a fresh take? Get an instant paraphrase of this document with our AI Paraphraser
because that they're being noticed as often as probable, as has been accomplished by
Indian research groups. The CCTV programme for three weeks was digitally recorded between 6
and 10 p.m. That is the peak time of Indian television. CCTV is selling commercial time
on monthly basis (Snyder, 2019). Thus, the 3 distinct months would be included to increase the
size of the sample. In addition, programmes were tested from different time periods to boost the
range of product-classifications. Here particular one-week in month is intentionally sampled for
avoiding holidays or festivals. For advertisements that featured the same celebrities but
championed various brands, each was obtained as an individual sample. All sample commercials
have been formatted as cultural importance variable. Only commercials that spotlighted one
public figure were formatted for the factors of gender, age-group and nationality-status. The
advertisements which have more than one celebs are omitted as they mostly delineated multiple
genders, age-groups or nation-status. Afterwards a decent coding has been undertaken Indian-
college students and other individuals for obtaining outcomes (Ørngreen and Levinsen, 2017).
This is not possible to conduct personal interviews or dispense survey publically as this quite
time consuming task as well as hard due to prevalent conditions of corona outbreak. Under this
research, information need to be collected from different types of customers. There is no
availability of information, therefore this cannot be applied in above dissertation. Further a
significant aspect to be investigate is buyer's attitudes as well as perceptions. These may vary on
multiple distinct ground for example age factor, sexuality, state, financial status etc. From a
marketer perception this is vital to comprehend that buyers are mainly regulated by their own
cultures, belief and values. Also, certain limitations are covered in investigation to offer a wider
base for upcoming investigation. In this research study factors like attractiveness, buying
percentages, level of impacts, credibleness of superstars and celebrities is to be effectively tested.
The questionnaire survey will consist of 15 queries, which would also include fundamental
questions such as age, gender of participants. It's going to be 4-page survey, thus it's not very
lengthy and time intensive (Fletcher, 2017). Queries will be constructed in an effective and quick
dialect so all respondents of any age group could understand and respond to them. negative terms
like never, hatred, etc. would be averted while readying the questionnaire, as they may not even
be liked by respondents and may result their responses to a specific direction. This will assist in
determining whether whether all such variables are substantial in view of participants whenever
they look at advertisements and impact their buying choices. That study will aid us to find out
multiple cultural based attributes of publicize and ads in relation to Indian buyers who generally
prefer Bollywood performing artist or western performing artist in advertisements. Because
if advertisements have Indian celebrities, and if so, whether they are far more apt to understand
or acknowledge this same item. The survey will provide us with in-depth analysis of their
perspective and impact of their own purchasing decisions. The response level is anticipated to be
moderate and the result should be precise without much bias, as the general viewing public will
respond to survey without any stress or impacts, and thus they are likely to speak anything they
like. To fix the prevalent bias problem the questionnaire would be constructed in such a way that
this is not premised on any specific character and straightforward to respond to. Even so, it is
probable that a few individuals like the elderly may not be willing to provide adequate responses
owing to lack of awareness and comprehension (Humphries, 2017). The questionnaire will also
not impair and endanger personal rights, and their permission will also be taken, since
confidentiality of answers will be safeguarded. The data so accumulated would only be
applied for research purposes. The outcomes will then be investigated using SPSS or Excel
software. The research results will enable us to recognise how people feel about presence of
celebrities in advertisements in aspects of their likeability, their legitimacy and the magnitude of
their impact in having made them buy a product they endorse. This investigation would not harm
anybody's interest. This study will offer worthwhile information to other people (Wiek and Lang,
2016).
Chapter 4/4 Finding, Analysis and Conclusion
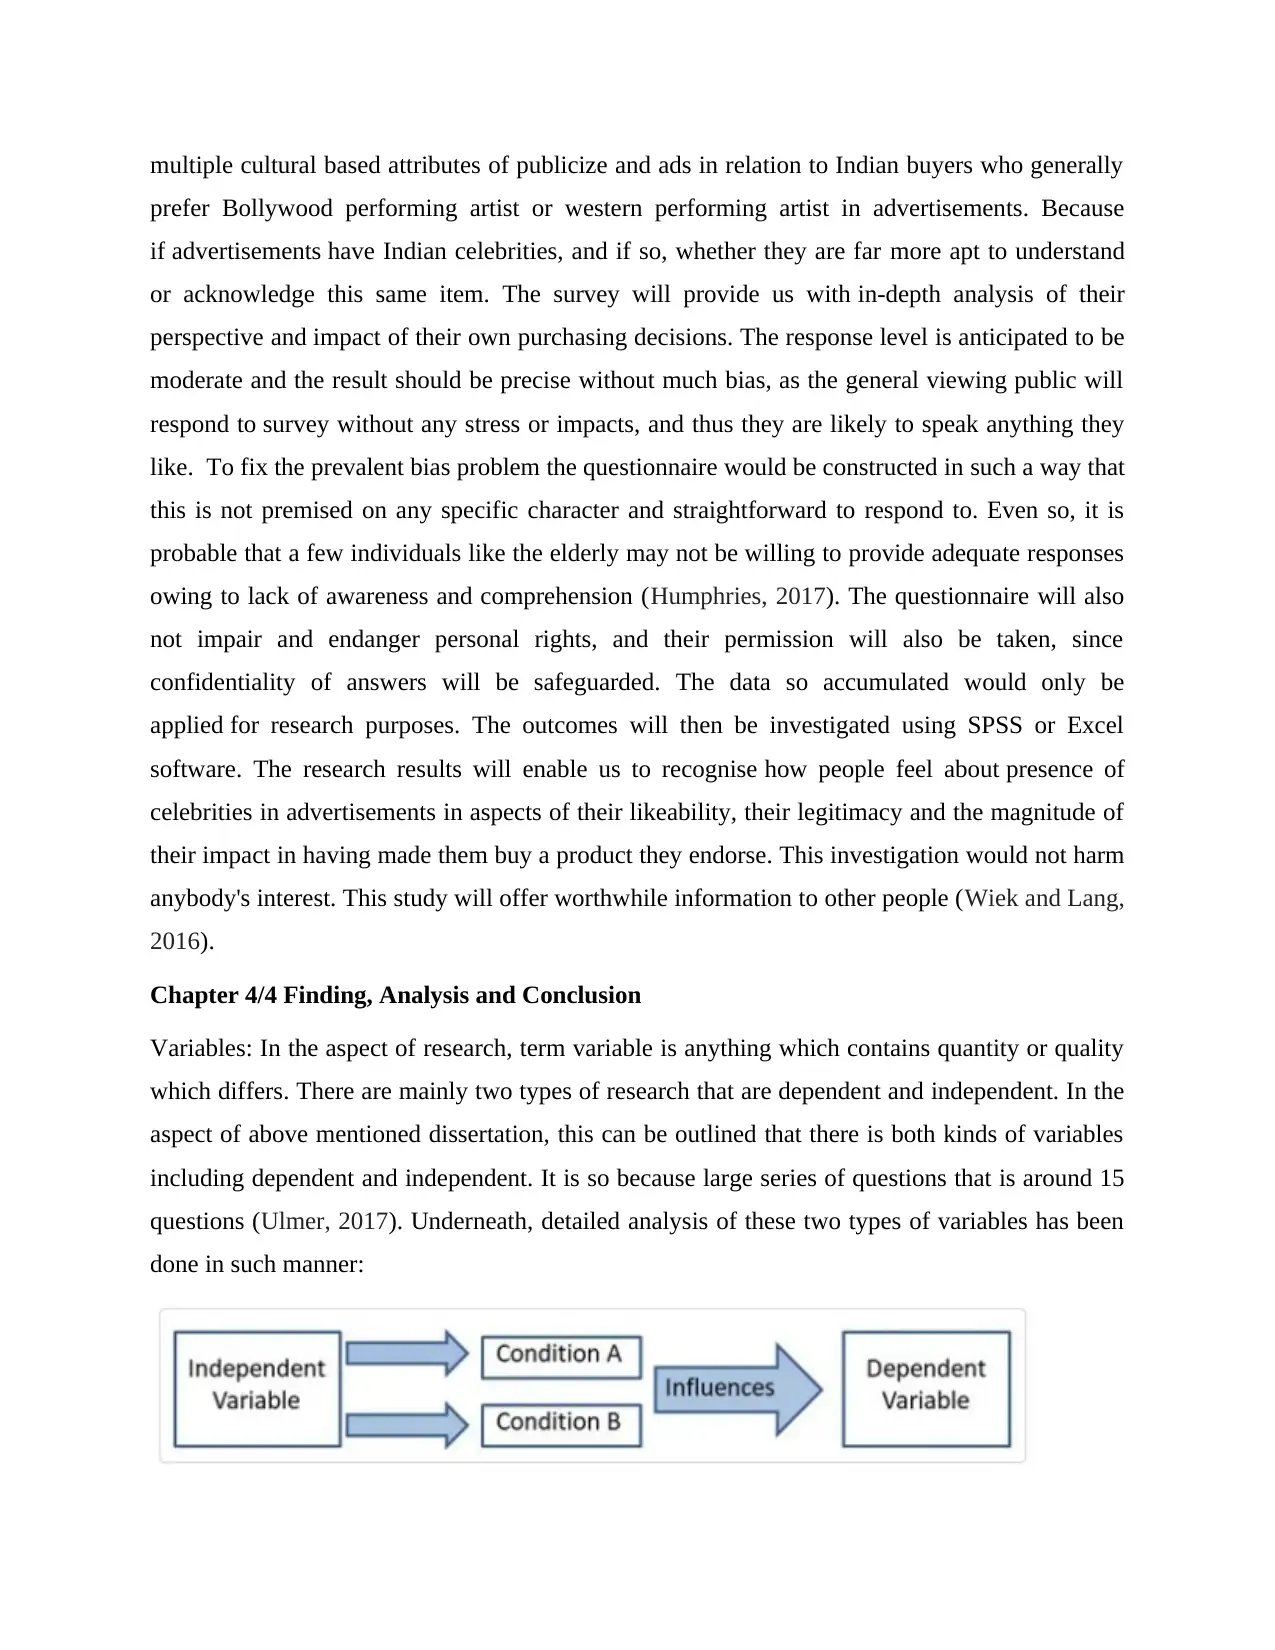
Variables: In the aspect of research, term variable is anything which contains quantity or quality
which differs. There are mainly two types of research that are dependent and independent. In the
aspect of above mentioned dissertation, this can be outlined that there is both kinds of variables
including dependent and independent. It is so because large series of questions that is around 15
questions (Ulmer, 2017). Underneath, detailed analysis of these two types of variables has been
done in such manner:
prefer Bollywood performing artist or western performing artist in advertisements. Because
if advertisements have Indian celebrities, and if so, whether they are far more apt to understand
or acknowledge this same item. The survey will provide us with in-depth analysis of their
perspective and impact of their own purchasing decisions. The response level is anticipated to be
moderate and the result should be precise without much bias, as the general viewing public will
respond to survey without any stress or impacts, and thus they are likely to speak anything they
like. To fix the prevalent bias problem the questionnaire would be constructed in such a way that
this is not premised on any specific character and straightforward to respond to. Even so, it is
probable that a few individuals like the elderly may not be willing to provide adequate responses
owing to lack of awareness and comprehension (Humphries, 2017). The questionnaire will also
not impair and endanger personal rights, and their permission will also be taken, since
confidentiality of answers will be safeguarded. The data so accumulated would only be
applied for research purposes. The outcomes will then be investigated using SPSS or Excel
software. The research results will enable us to recognise how people feel about presence of
celebrities in advertisements in aspects of their likeability, their legitimacy and the magnitude of
their impact in having made them buy a product they endorse. This investigation would not harm
anybody's interest. This study will offer worthwhile information to other people (Wiek and Lang,
2016).
Chapter 4/4 Finding, Analysis and Conclusion
Variables: In the aspect of research, term variable is anything which contains quantity or quality
which differs. There are mainly two types of research that are dependent and independent. In the
aspect of above mentioned dissertation, this can be outlined that there is both kinds of variables
including dependent and independent. It is so because large series of questions that is around 15
questions (Ulmer, 2017). Underneath, detailed analysis of these two types of variables has been
done in such manner:
⊘ This is a preview!⊘
Do you want full access?
Subscribe today to unlock all pages.
Trusted by 1+ million students worldwide
Dependent variable- It is defined as a form of variable which is completely tested and
dignified in a research. This type of variable completely depends on independent
variable. In order to find out impact, these variables are analysed. For instance, a
dependent variable is symptoms of stress which is completely depends on independent
variable (Type of treatment). In a research, researcher always look for possible impact on
the dependent variables which can be caused due to variation in independent variables. In
relation to above discussed dissertation, the dependent variable is influence on customers’
purchasing decision due to impact of celebrities.
Independent variable- The independent variable can be defined as a variable which is
controlled and changed by researcher in order to have a direct impact on dependent
variable. The common example of independent variables is gender, level of education. In
the context of above discussed dissertation, it can be find out that the independent
variables are attractiveness of celebrities, credibility of celebrities, extent of influence and
current purchase rate of customers. These independent variables have been tested with
dependent variables in order to find out relation between both (Basias and Pollalis, 2018).
In the aspect of SPSS, there are a range of tests which are applied in order to assess impact of
independent variable on dependent variable. Some common tests which are used like Chi-square
test, one-way ANOVA and many more. It depends on researcher or nature of data set that which
types of test need to applied. For instance, Chi-square test is applied only when there are two
independent variables. As well as one-way ANOVA test is applied when number of independent
variables are more than two. In relation to data of impact of Indian celebrities over purchasing
decision of customers, it can be point out that there are two types of variables including
dependent and independent. In this situation, the linear regression model will be suitable because
data is related to two different segments about effectiveness of Indian celebrities and customers’
purchasing decision. The linear regression model is only way that can be used to test hypothesis
in order to make justification of impact of Indian celebrities’ over customers’ purchasing
decisions (Attia and Edge, 2017).
In the aspect of above mentioned data set, this can be assessed that there are both types of data
including dependent and independent variables. In accordance of given information, this can be
assessed that dependent variable is influence on the customers’ purchasing decision due to
Paraphrase This Document
Need a fresh take? Get an instant paraphrase of this document with our AI Paraphraser
celebrity advertisements. While the independent variables are extent of influence on customers,
purchase rate of customers, attractiveness, credibility of celebrity etc. In the report, these
dependent and independent variables have been tested in order to apply linear regression test.
Analysis: In this part of report different types of tests of SPSS have been performed in order to
evaluate findings. In accordance of given instructions mainly three types of SPSS tests are
needed to be done that are correlation, linear regression and reliability test. As per the given data,
it can be stated that it is related to impact of celebrity over influence of customers’ purchasing.
For this objective, there are 15 questions are designed which have different kinds of aspect.
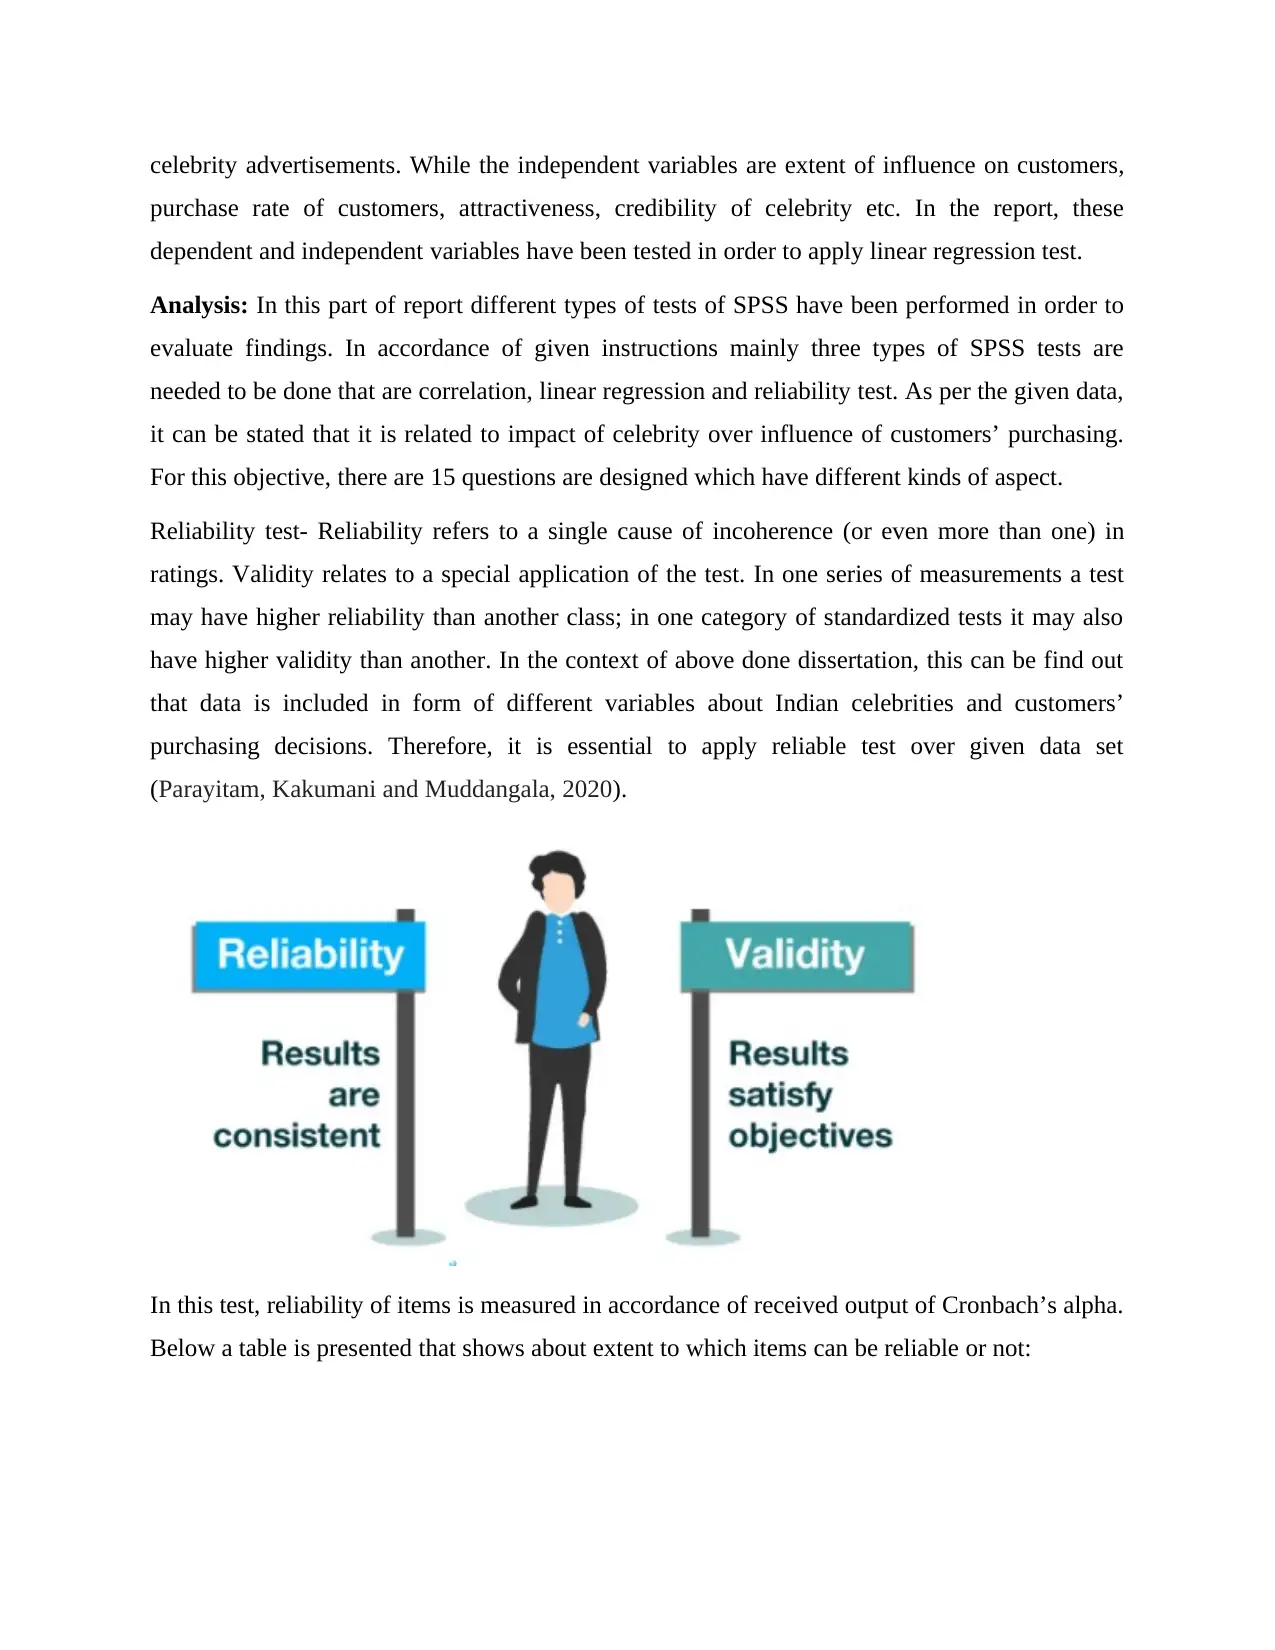
Reliability test- Reliability refers to a single cause of incoherence (or even more than one) in
ratings. Validity relates to a special application of the test. In one series of measurements a test
may have higher reliability than another class; in one category of standardized tests it may also
have higher validity than another. In the context of above done dissertation, this can be find out
that data is included in form of different variables about Indian celebrities and customers’
purchasing decisions. Therefore, it is essential to apply reliable test over given data set
(Parayitam, Kakumani and Muddangala, 2020).
In this test, reliability of items is measured in accordance of received output of Cronbach’s alpha.
Below a table is presented that shows about extent to which items can be reliable or not:
purchase rate of customers, attractiveness, credibility of celebrity etc. In the report, these
dependent and independent variables have been tested in order to apply linear regression test.
Analysis: In this part of report different types of tests of SPSS have been performed in order to
evaluate findings. In accordance of given instructions mainly three types of SPSS tests are
needed to be done that are correlation, linear regression and reliability test. As per the given data,
it can be stated that it is related to impact of celebrity over influence of customers’ purchasing.
For this objective, there are 15 questions are designed which have different kinds of aspect.
Reliability test- Reliability refers to a single cause of incoherence (or even more than one) in
ratings. Validity relates to a special application of the test. In one series of measurements a test
may have higher reliability than another class; in one category of standardized tests it may also
have higher validity than another. In the context of above done dissertation, this can be find out
that data is included in form of different variables about Indian celebrities and customers’
purchasing decisions. Therefore, it is essential to apply reliable test over given data set
(Parayitam, Kakumani and Muddangala, 2020).
In this test, reliability of items is measured in accordance of received output of Cronbach’s alpha.
Below a table is presented that shows about extent to which items can be reliable or not:
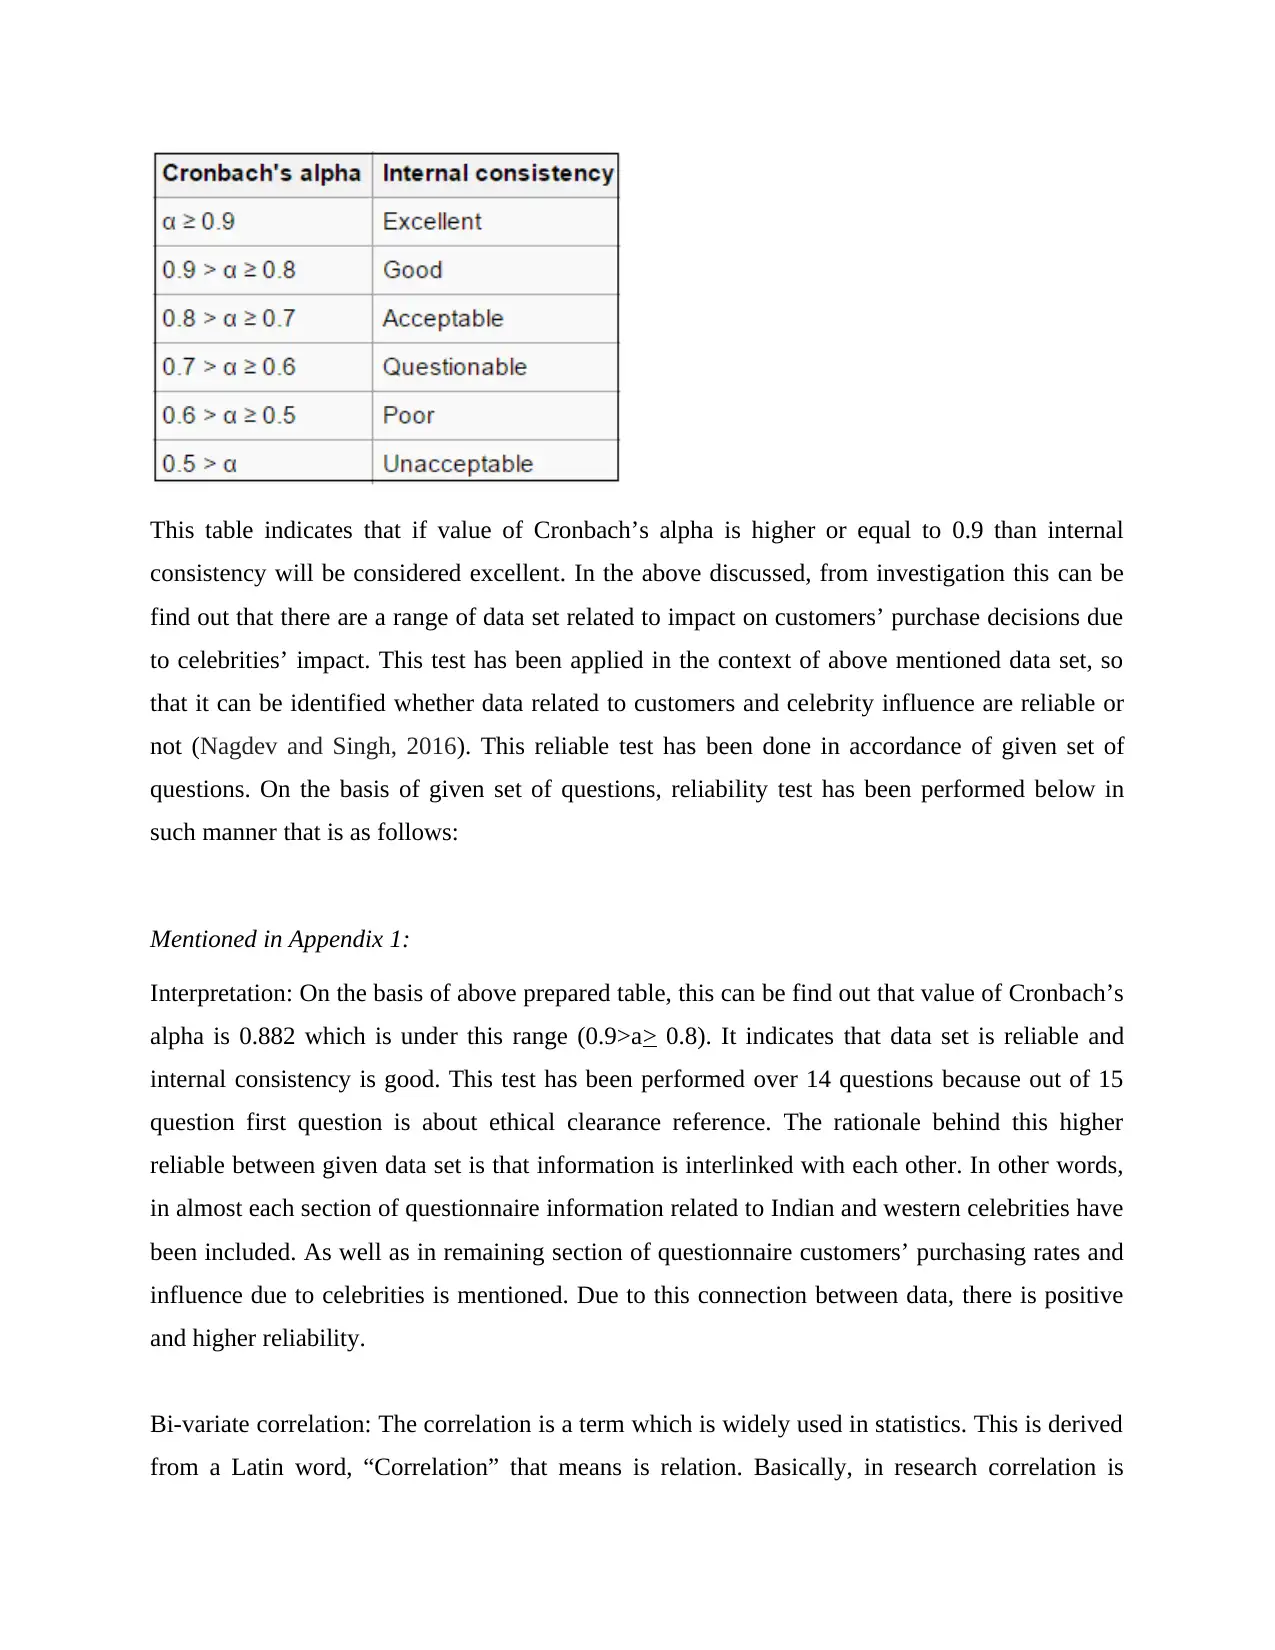
This table indicates that if value of Cronbach’s alpha is higher or equal to 0.9 than internal
consistency will be considered excellent. In the above discussed, from investigation this can be
find out that there are a range of data set related to impact on customers’ purchase decisions due
to celebrities’ impact. This test has been applied in the context of above mentioned data set, so
that it can be identified whether data related to customers and celebrity influence are reliable or
not (Nagdev and Singh, 2016). This reliable test has been done in accordance of given set of
questions. On the basis of given set of questions, reliability test has been performed below in
such manner that is as follows:
Mentioned in Appendix 1:
Interpretation: On the basis of above prepared table, this can be find out that value of Cronbach’s
alpha is 0.882 which is under this range (0.9>a> 0.8). It indicates that data set is reliable and
internal consistency is good. This test has been performed over 14 questions because out of 15
question first question is about ethical clearance reference. The rationale behind this higher
reliable between given data set is that information is interlinked with each other. In other words,
in almost each section of questionnaire information related to Indian and western celebrities have
been included. As well as in remaining section of questionnaire customers’ purchasing rates and
influence due to celebrities is mentioned. Due to this connection between data, there is positive
and higher reliability.
Bi-variate correlation: The correlation is a term which is widely used in statistics. This is derived
from a Latin word, “Correlation” that means is relation. Basically, in research correlation is
⊘ This is a preview!⊘
Do you want full access?
Subscribe today to unlock all pages.
Trusted by 1+ million students worldwide
measured in order to find out link between two or more phenomena. A correlation states the
strong point of relation or co-occurrence between to variables in a single value between -1 and
+1. The value that measures the strength of relation is known as correlation coefficient. This is
presented by letter “r”.
The person’s r is defined as correlation coefficient between two constant types of variables. In
the case when value of “r” is positive than it indicates that there is positive relationship between
two variables. If value of “r” is negative that it is considered that relationship is negative between
two variables. On the other hands, if value of “r” is zero that it is assumed that there is no
relationship between variables (Mittal, 2017).
In the context of dissertation, this can be assessed that there is both types of variables including
dependent and independent. In order to find out relation between these two variables, the
correlation has been performed. Herein, this is important to note that in 15 questions both types
of variables are included that needs to be categorized. The dependent variable is influence on
customers’ purchasing and this variables’ relation has been tested with independent variables.
The independent variables are serval in the given question. The information is about celebrities
and their credibility is considered as independent variable.
In accordance of given data set, correlation between different questions have been assessed in
such manner that is as follows:
1. Correlation between credibility of celebrities and influence on purchase decision
(Correlation between question 8, 12 & 13):
Appendix 2
Interpretation: On the basis of above table, this can be interpreted that there is poor relation
between two variables that are exist in question 8 and 13. This is so because value of correlation
is under 0.3 that is of 0.268. Similar as with question 13 and 8, because value of correlation is
0.001. though, there is average relation too between question 8 and question 13 variables. This
data of correlation is indicating that there is average relation between the Indian celebrities and
influence on customers’ performance. It can be because of less influence of Indian celebrities
over general customers. The correlation can be higher if there are more number of customers
Paraphrase This Document
Need a fresh take? Get an instant paraphrase of this document with our AI Paraphraser
who are making purchase of different items after influencing from advertisement done by Indian
celebrities. Herein, this is important to consider that current value of correlation is nearly of 0.3
which shows that some % of customers are getting influence to buy products after seeing the
advertisement.
2. Correlation between extent of influence and impact on customers purchasing decisions
(Correlation between Q3, Q4, Q7, Q10, Q11 and Q13).
Appendix 3
Interpretation: On the basis of above mentioned table, this can be interpreted that there is an
average relationship between extent of influence and impact on customers’ purchasing decision.
This is so because correlation table states that between each types of questions value of
significance difference are more than 0.3 but less than 0.8. The best average relation is between
question 4 and question 3. In these questions, the value of correlation is of 0.613 that is higher in
table. These stats of correlation between different kinds of aspects are indicating that there is
crucial relation between influence due to presence of celebrities and preference of celebrity
advertisement over non-celebrity advertisements. It is so because of value of higher correlation
that is of 0.613 (More than 0.3). Apart from it, the second best correlation in table is of influence
due to presence of celebrities and efficiency of Indian actor as compared to western actors. As
the value of correlation is around 0.513 that shows the better than average relation between these
two aspects (Sharma and Modani, 2018).
3. Correlation between attractiveness and influence on purchasing decision of customers
(Correlation among Q5, Q6 and Q13).
Appendix 4
Interpretation: On the basis of above prepared table, this can be interpreted that there is average
relation between attractiveness and influence on purchasing decision. In order to find out
correlation between these two variables, different types of questions are used that presents
average relation. The relation is average because of correlation value that is of 0.639 (0.3-0.7).
This value of correlation is stating that attractiveness of celebrities is much effective which is
leading to higher customers’ purchasing. As in both variables, value of correlation is nearby 0.9
that shows a strong relation. The attractiveness of celebrities has been covered under two
questions including 5 and 6. In these, information about presence of celebrities for advertisement
and rating to western actors is included. In the table, there is another figure of correlation around
0.434, it is between rating to western celebrities and influence on customers’ purchasing.
Though, there is not poor relation because value is greater than 0.3.
4. Correlation between purchase rate of customers and influence on purchasing decision
(Correlation between Q 9 and Q 13).
Appendix 5
Interpretation: The above mentioned table is showing that there is average relation between
purchase rate of customers and influence of celebrity on customers’ purchasing. For this aim,
two questions are selected that are question 9 and question 13. There is average relation because
the value of Pearson correlation is under range of 0.3 to 0.7. The relation between these two
variables including comparison of efficiency of celebrities and influence over customers’
purchasing decisions. The value of correlation is around 0.430 that is just above to 0.3 but less
than to 0.9. It shows that between these two variables, there is relation but not so strong. It is
showing that customers’ do not get too much influenced to make purchasing judgements due to
comparison of efficiency of the advertisement of both Indian and western celebrities.
Linear regression- In the aspect of statistics, linear regression is known as an approach which are
related to modeling of relationship between scalar response and one or more than explanatory
variables. This model is completely different from multivariate linear regression; this is so
because under it multiple variables are predicted. Mainly, it is used for making prediction of
certain variables. In the linear regression, there is two types of data is needed which are related to
dependent and independent (Agnihotri and Bhattacharya, 2020). In the context of dissertation,
⊘ This is a preview!⊘
Do you want full access?
Subscribe today to unlock all pages.
Trusted by 1+ million students worldwide
this can be find out that linear regression model can be applied in accordance of categorizing
dependent and independent variables from given set of questionnaire. There is only one
dependent variable which is related to impact of celebrities’ influence on customers’ purchasing
decision.
In the context of given data set about, influence of celebrities over customers’ purchasing linear
regression test has been performed below in such manner:
On the basis of provided information about celebrities’ involvement in advertisement and
customers’ influence over purchasing, there can be different types of hypothesis. In order to
inspect data, below some hypothesis are prepared that are as follows:
H1:
Null hypothesis- Attractiveness of celebrities’ influence to customers’ purchasing decision.
Alternative hypothesis- Attractiveness of celebrities’ does not influence to customers’ purchasing
decision.
Appendix 6
Interpretation: The above prepared ANOVA table is indicating that value of significance
difference is of 0.000 which shows that null hypothesis is true. It is stating that attractiveness of
celebrities is making a significant impact on the customers’ buying decisions. In this aspect, the
dependent variable is impact on customers’ purchasing due to celebrities’ influence and for this
purpose question 13 has been considered. While independent variable is attractiveness of
celebrities and for this purpose two questions have been considered which are question 5 & 6
respectively. In the aspect of table of model summary, it can be find out that value of R is of
0.645 which shows that there is average relation between these variables. Along with value of R2
is of 0.749 or 74.9%, that states about total variation in dependent variable by independent
variable. In other words, the dependent variable (influence over customers’ purchasing) is related
with independent variables.
Paraphrase This Document
Need a fresh take? Get an instant paraphrase of this document with our AI Paraphraser
H2:
Null hypothesis- Credibility of celebrities have impact on the purchasing of customers.
Alternative hypothesis- Credibility of celebrities does not have impact on the purchasing of
customers.
Appendix 7
Interpretation: The above mentioned table of ANOVA is indicating that value of significance
difference is of 0.000 which is lower than 0.05. It shows that null hypothesis is true due to lower
value of significance difference. This corrective hypothesis is presenting that credibility of
celebrities have impact on customers’ purchasing decision. In this testing of hypothesis,
dependent variable is question 13. While independent variables are question 8 and question 12
respectively that shows information related to credibility of celebrities. In the aspect of table of
model summary, it can be find out that value of R is of 0.481 which shows that there is average
relation between these variables. Along with value of R2 is of 0.210 or 21.00 %, that states about
total variation in dependent variable by independent variable. In other words, the dependent
variable (influence over customers’ purchasing) is related with independent variables.
H3:
Null hypothesis: The extent of celebrity influence has impact on customers’ purchasing decision.
Alternative hypothesis- The extent of celebrity influence has no impact on customers’ purchasing
decision.
Appendix 8
Interpretation: The ANOVA table is presenting that above mentioned hypothesis is true because
of lower significance difference value of 0.000. This value is less than 0.05 that is leading as
corrective hypothesis. The true hypothesis is showing that extent of influence of celebrities has
an impact on purchasing of customers. In this testing, dependent variable is similar to above
hypothesis that is question 13. While there are a range of independent variables that are included
related to extent of influence including question 3, 4, 7, 10 and 11. The linear regression test has
been performed between these two dependent and independent variables in order to test the
hypothesis. The prepared values under model summary, it can be find out that value of R is of
0.634 that shows about average relation between influence of celebrities’ over customers’
purchasing decision. As well as R2 is of 0.360 or 36% that states about total amount of variation
in dependent variable because of independent variable.
H4:
Null hypothesis- There is relation between current purchase rate of customers and influence of
celebrities on customers’ purchase decision.
Alternative hypothesis- There is no relation between current purchase rate of customers and
influence of celebrities on customers’ purchase decision.
Appendix 9
Interpretation: On the behalf of above prepared ANOVA table, this can be interpreted that null
hypothesis is acceptable. The reason due to which this hypothesis needs to be accept is lower
value of significance compared to 0.05 (0.05>0.000). Due to it, this can be stated that there is
relation between current purchasing rate of customers and influence on customers’ purchasing
decision due to celebrities. In this hypothesis testing, dependent variable is common as previous.
Along with the independent variable is question 9 related to purchase rate of customers. The
prepared values under model summary, it can be find out that value of R is of 0.211 that shows
about poor relation between influence of celebrities’ over customers’ purchasing decision. As
well as R2 is of 0.211or 21% that states about total amount of variation in dependent variable
because of independent variable (Negi, Fernandes and Jeedigunta, 2018).
On the basis of above done testing of hypothesis, this can be find out that all hypothesis is true
because value of significance is of 0.000.
⊘ This is a preview!⊘
Do you want full access?
Subscribe today to unlock all pages.
Trusted by 1+ million students worldwide
1 out of 51
Related Documents


Your All-in-One AI-Powered Toolkit for Academic Success.
+13062052269
info@desklib.com
Available 24*7 on WhatsApp / Email
![[object Object]](/_next/static/media/star-bottom.7253800d.svg)
Unlock your academic potential
Copyright © 2020–2026 A2Z Services. All Rights Reserved. Developed and managed by ZUCOL.