Economics of Business: Centrica Plc vs. Southern Energy Plc Analysis
VerifiedAdded on 2020/02/03
|16
|4090
|242
Report
AI Summary
This report presents a comparative financial analysis of Centrica Plc and Southern Energy Plc, examining their performance from 2006 to 2016. The analysis covers key financial metrics such as revenue, gross profit, net income, earnings per share, return on equity, and return on invested capital. The report evaluates the business strategies employed by both companies, highlighting trends in revenue growth, gross profit margins, and net profit margins. It discusses the impact of external factors and internal strategies on their financial outcomes, including the effects of fluctuating oil prices, debt burdens, and strategic decisions related to cost management and investment. The report also delves into the earning per share and provides insights into the factors influencing the profitability and financial stability of both companies, offering a comprehensive overview of their economic performance and strategic approaches within the energy sector. The report concludes by evaluating the effectiveness of business strategies employed by each company and providing a detailed financial comparison.

Economics of the Business Environment
Paraphrase This Document
Need a fresh take? Get an instant paraphrase of this document with our AI Paraphraser
TABLE OF CONTENTS
INTRODUCTION...........................................................................................................................3
Overview of Organization................................................................................................................3
Analayzing the factors that affect the financial performance of Centrica Plc and Southern
Energy Plc ...................................................................................................................................3
CONCLUSION .............................................................................................................................10
REFERENCES..............................................................................................................................11
INTRODUCTION
In today's time there are many fluctuation in economic environment they may be
favorable and unfavorable. Unfavorable condition in business will need some strategies for their
development and growth of economy. Therefore, firm need to understand all market situation
which are rising externally through this, they can set up their business easily in competitive
market situation and will reach out to their ultimate goals. To understand economics of business
environment is very difficult task because they have to consist of all factors which are impact on
their working style. Centrica Plc main competitor is SSE plc therefore, their competition is very
high and they consist of different strategies for understanding market situation. In this report it
consist of performance of firm to its competitor from 2006 to 2016 through this, they can
analysis properly and can set market with macro context.
OVERVIEW OF ORGANIZATION
Analayzing the factors that affect the financial performance of Centrica Plc and Southern
Energy Plc
Centrica Plc is public limited company at United Kingdom and it main aim is to supply
electricity and gas to businesses and consumer. Therefore, it consist of externals factors for
setting up different strategies within organization for maximizing in sale and generating more
energy for UK service users and firms. Thus, organization is involving of new ideas and some
innovative techniques for attracting their customers (Oil and gas sector of UK, 2016). They
consist of small and large scale plants for producing enough electricity.
Scottish Southern Energy Plc is public limited company and its headquarter is in Perth,
United Kingdom. They are delivering products which consist of electricity, natural gas and
broadband to houses and business. It is one of the main constituent of FTSE 100 index. This
business organization is highly involved in the generation and supply of electricity gas. Hence,
other energy related services include gas storage, exploration and production, contracting,
connections and metering. Hence, it is one of the sixth largest firm which has dominated the
energy sector to the large extent. Thus, it is one main rival firms of Centrica Plc
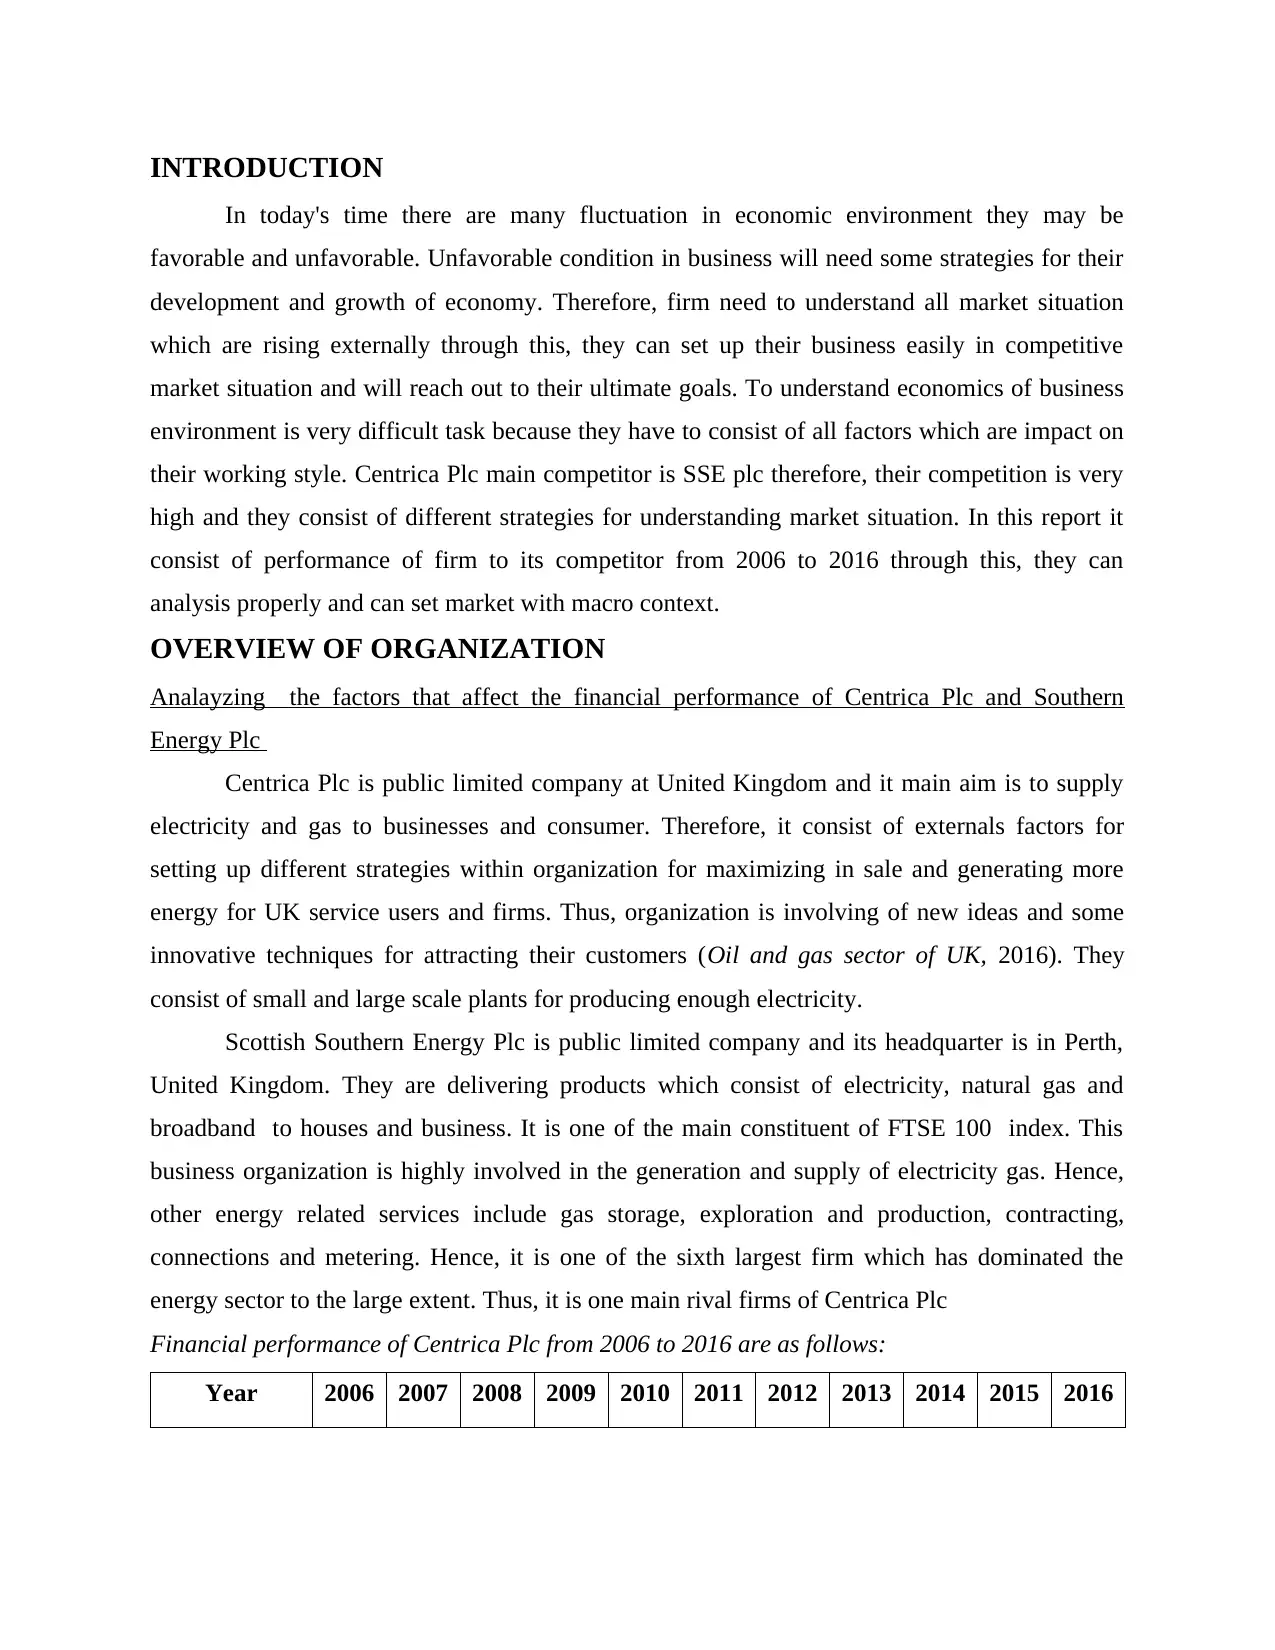
Financial performance of Centrica Plc from 2006 to 2016 are as follows:
Year 2006 2007 2008 2009 2010 2011 2012 2013 2014 2015 2016
In today's time there are many fluctuation in economic environment they may be
favorable and unfavorable. Unfavorable condition in business will need some strategies for their
development and growth of economy. Therefore, firm need to understand all market situation
which are rising externally through this, they can set up their business easily in competitive
market situation and will reach out to their ultimate goals. To understand economics of business
environment is very difficult task because they have to consist of all factors which are impact on
their working style. Centrica Plc main competitor is SSE plc therefore, their competition is very
high and they consist of different strategies for understanding market situation. In this report it
consist of performance of firm to its competitor from 2006 to 2016 through this, they can
analysis properly and can set market with macro context.
OVERVIEW OF ORGANIZATION
Analayzing the factors that affect the financial performance of Centrica Plc and Southern
Energy Plc
Centrica Plc is public limited company at United Kingdom and it main aim is to supply
electricity and gas to businesses and consumer. Therefore, it consist of externals factors for
setting up different strategies within organization for maximizing in sale and generating more
energy for UK service users and firms. Thus, organization is involving of new ideas and some
innovative techniques for attracting their customers (Oil and gas sector of UK, 2016). They
consist of small and large scale plants for producing enough electricity.
Scottish Southern Energy Plc is public limited company and its headquarter is in Perth,
United Kingdom. They are delivering products which consist of electricity, natural gas and
broadband to houses and business. It is one of the main constituent of FTSE 100 index. This
business organization is highly involved in the generation and supply of electricity gas. Hence,
other energy related services include gas storage, exploration and production, contracting,
connections and metering. Hence, it is one of the sixth largest firm which has dominated the
energy sector to the large extent. Thus, it is one main rival firms of Centrica Plc
Financial performance of Centrica Plc from 2006 to 2016 are as follows:
Year 2006 2007 2008 2009 2010 2011 2012 2013 2014 2015 2016
⊘ This is a preview!⊘
Do you want full access?
Subscribe today to unlock all pages.
Trusted by 1+ million students worldwide
Revenue
1640
3 16272
2087
2 21963
2242
3
2282
4 23342
2657
1 29408
2797
1 25900
Gross profit 3641 4361 2880 3844 5897 4200 5485 5394 3235 4363 4817
Gross Margin
% 22.2 26.8 13.8 17.5 26.3 18.4 23.5 20.3 11 15.6 18.6
Net Income -155 1505 -137 844 1935 421 1245 950 -1012 -747 -649
Net margin
-
0.94
%
9.25
%
-
0.66
%
3.84
%
8.63
%
1.84
%
5.33
%
3.58
%
-
3.44
%
-
2.67
%
-
2.51
%
Earning per
share -0.15 1.28 -0.13 0.66 1.49 0.32 0.95 0.73 -0.81 -0.59 -0.56
Return on
Equity % -7.81 61.33 -3.59 19.85 38.66 7.37 22.09 17.09
-
25.53
-
38.18
-
22.33
Return on
invested
capital % -0.31 32.45 -1.69 11.59 22.37 5.13 13.28 10.12 -7.64 -6.12 -3.97
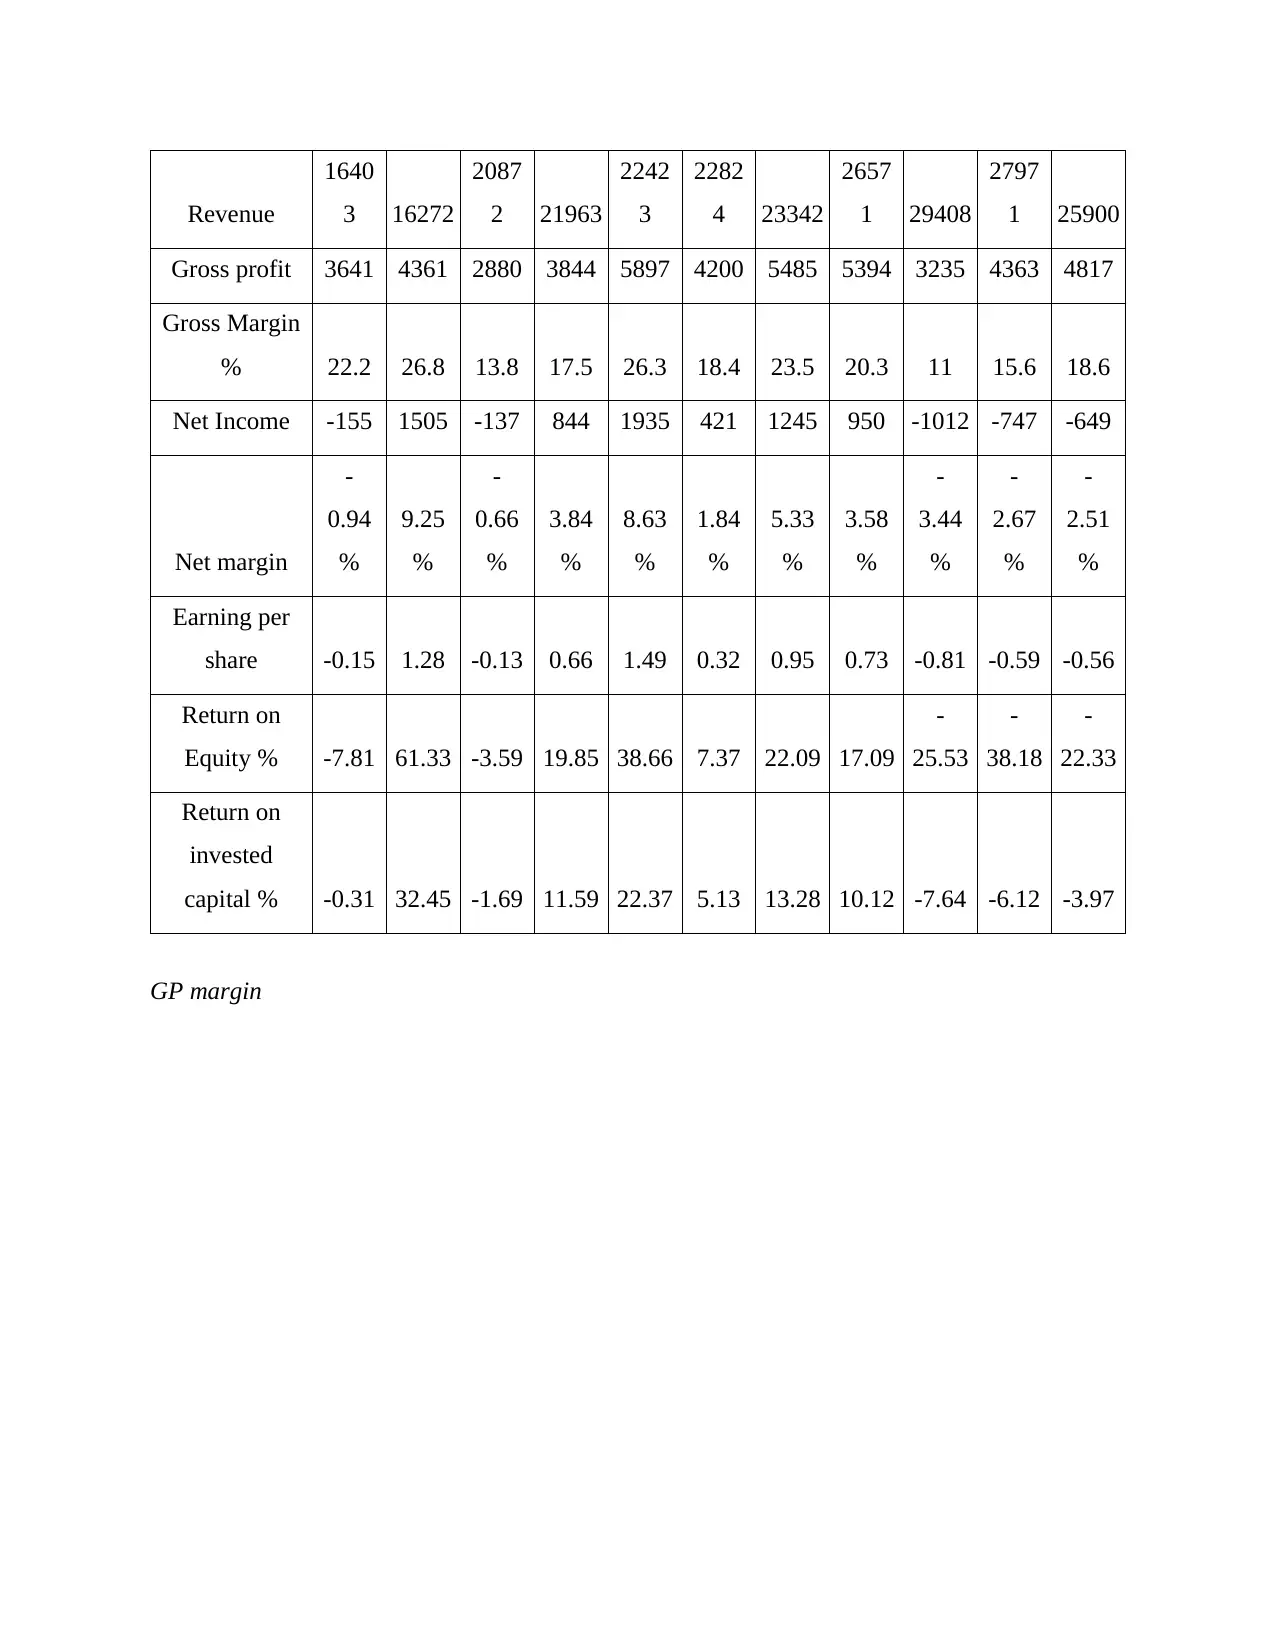
GP margin
1640
3 16272
2087
2 21963
2242
3
2282
4 23342
2657
1 29408
2797
1 25900
Gross profit 3641 4361 2880 3844 5897 4200 5485 5394 3235 4363 4817
Gross Margin
% 22.2 26.8 13.8 17.5 26.3 18.4 23.5 20.3 11 15.6 18.6
Net Income -155 1505 -137 844 1935 421 1245 950 -1012 -747 -649
Net margin
-
0.94
%
9.25
%
-
0.66
%
3.84
%
8.63
%
1.84
%
5.33
%
3.58
%
-
3.44
%
-
2.67
%
-
2.51
%
Earning per
share -0.15 1.28 -0.13 0.66 1.49 0.32 0.95 0.73 -0.81 -0.59 -0.56
Return on
Equity % -7.81 61.33 -3.59 19.85 38.66 7.37 22.09 17.09
-
25.53
-
38.18
-
22.33
Return on
invested
capital % -0.31 32.45 -1.69 11.59 22.37 5.13 13.28 10.12 -7.64 -6.12 -3.97
GP margin
Paraphrase This Document
Need a fresh take? Get an instant paraphrase of this document with our AI Paraphraser
ROE
2006 2007 2008 2009 2010 2011 2012 2013 2014 2015 2016
0.00%
5.00%
10.00%
15.00%
20.00%
25.00%
30.00%
G P m argin %
2006 2007 2008 2009 2010 2011 2012 2013 2014 2015 2016
0.00%
5.00%
10.00%
15.00%
20.00%
25.00%
30.00%
G P m argin %
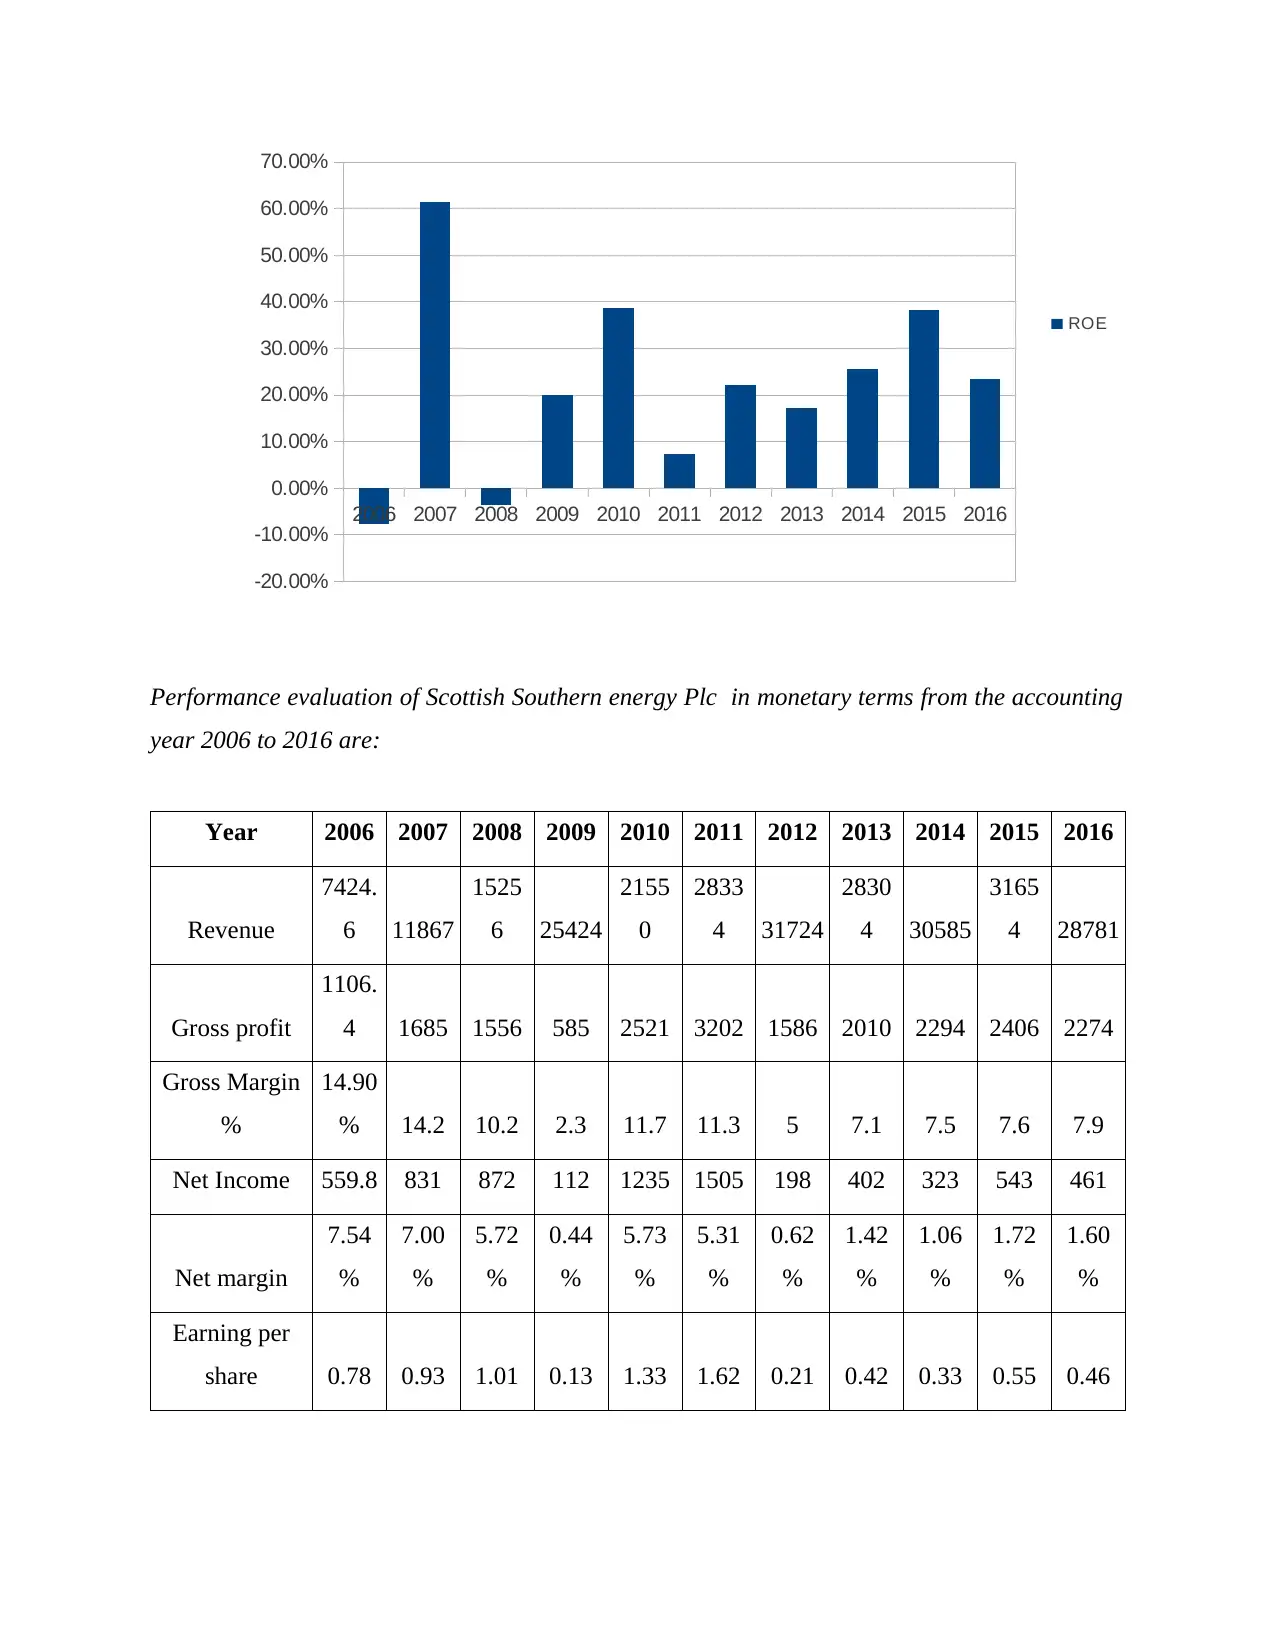
Performance evaluation of Scottish Southern energy Plc in monetary terms from the accounting
year 2006 to 2016 are:
Year 2006 2007 2008 2009 2010 2011 2012 2013 2014 2015 2016
Revenue
7424.
6 11867
1525
6 25424
2155
0
2833
4 31724
2830
4 30585
3165
4 28781
Gross profit
1106.
4 1685 1556 585 2521 3202 1586 2010 2294 2406 2274
Gross Margin
%
14.90
% 14.2 10.2 2.3 11.7 11.3 5 7.1 7.5 7.6 7.9
Net Income 559.8 831 872 112 1235 1505 198 402 323 543 461
Net margin
7.54
%
7.00
%
5.72
%
0.44
%
5.73
%
5.31
%
0.62
%
1.42
%
1.06
%
1.72
%
1.60
%
Earning per
share 0.78 0.93 1.01 0.13 1.33 1.62 0.21 0.42 0.33 0.55 0.46
2006 2007 2008 2009 2010 2011 2012 2013 2014 2015 2016
-20.00%
-10.00%
0.00%
10.00%
20.00%
30.00%
40.00%
50.00%
60.00%
70.00%
ROE
⊘ This is a preview!⊘
Do you want full access?
Subscribe today to unlock all pages.
Trusted by 1+ million students worldwide
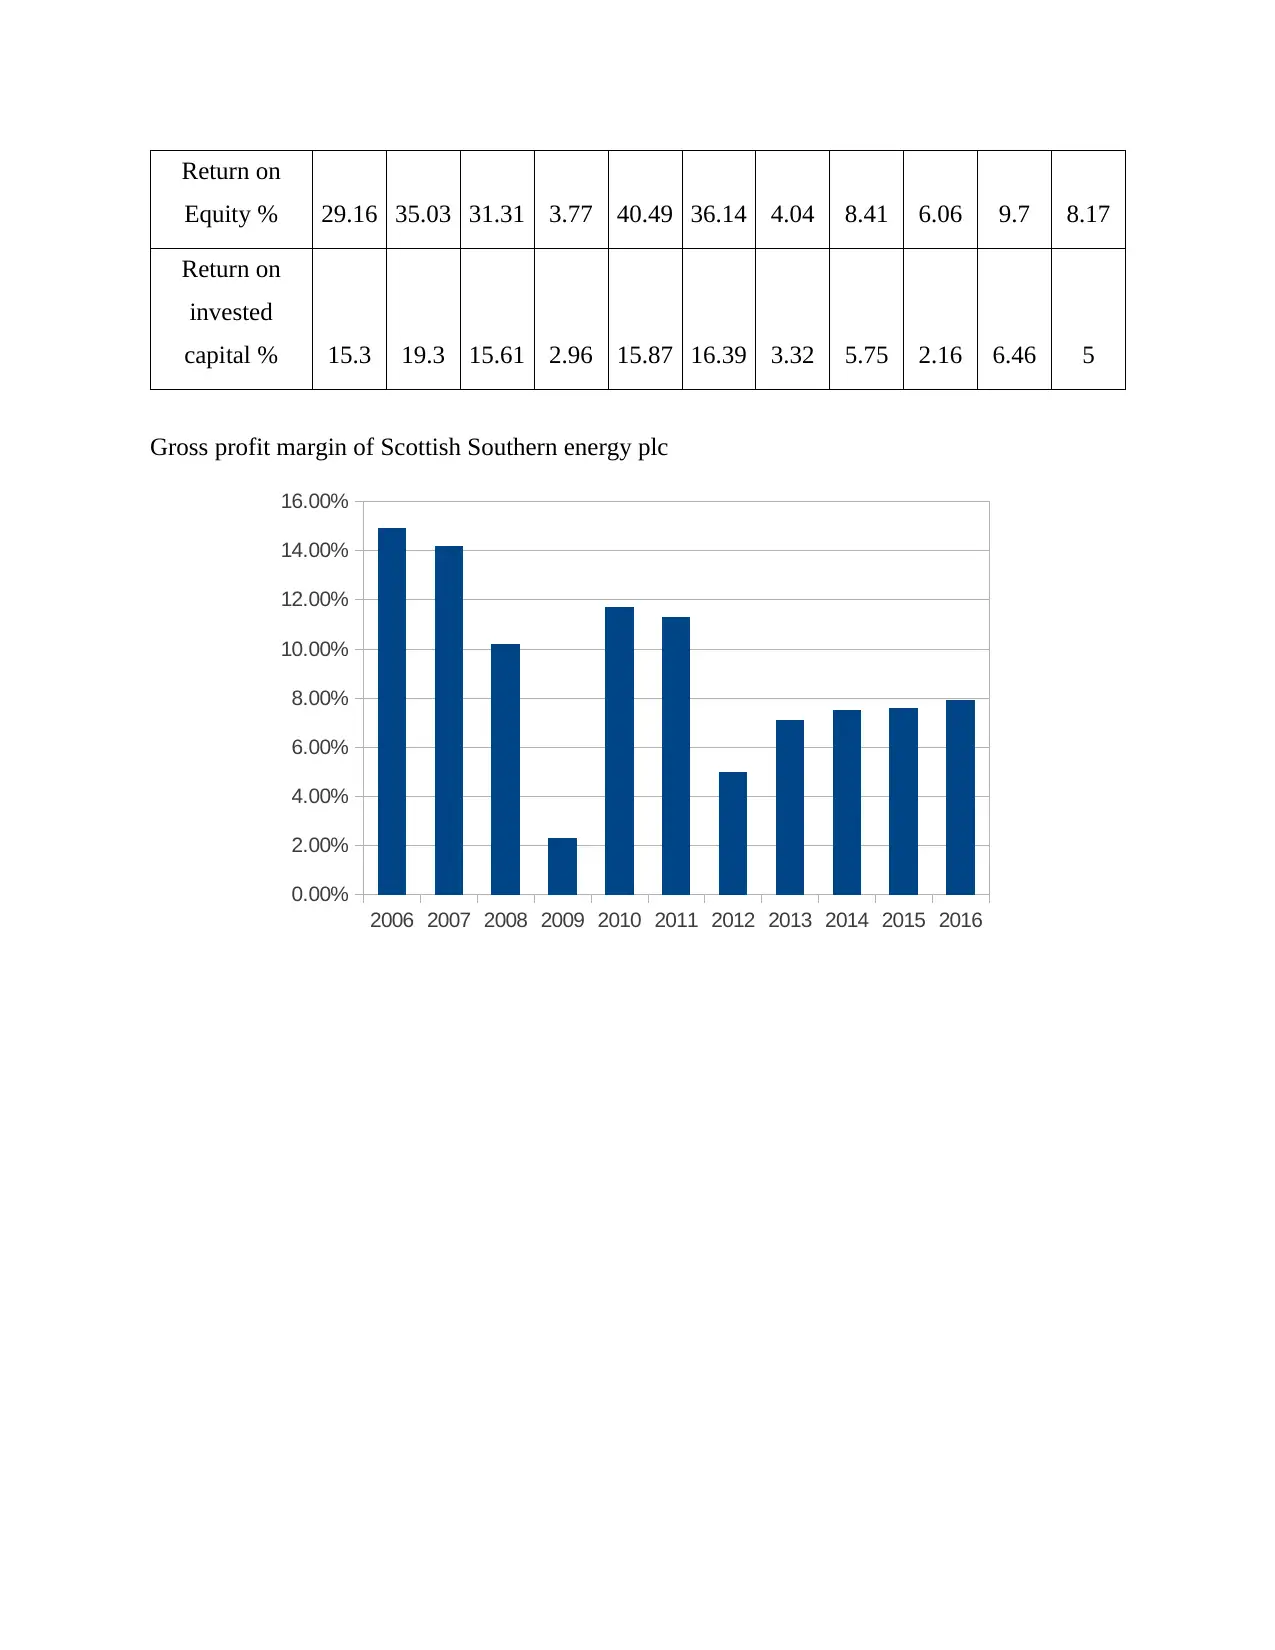
Return on
Equity % 29.16 35.03 31.31 3.77 40.49 36.14 4.04 8.41 6.06 9.7 8.17
Return on
invested
capital % 15.3 19.3 15.61 2.96 15.87 16.39 3.32 5.75 2.16 6.46 5
Gross profit margin of Scottish Southern energy plc
2006 2007 2008 2009 2010 2011 2012 2013 2014 2015 2016
0.00%
2.00%
4.00%
6.00%
8.00%
10.00%
12.00%
14.00%
16.00%
Paraphrase This Document
Need a fresh take? Get an instant paraphrase of this document with our AI Paraphraser
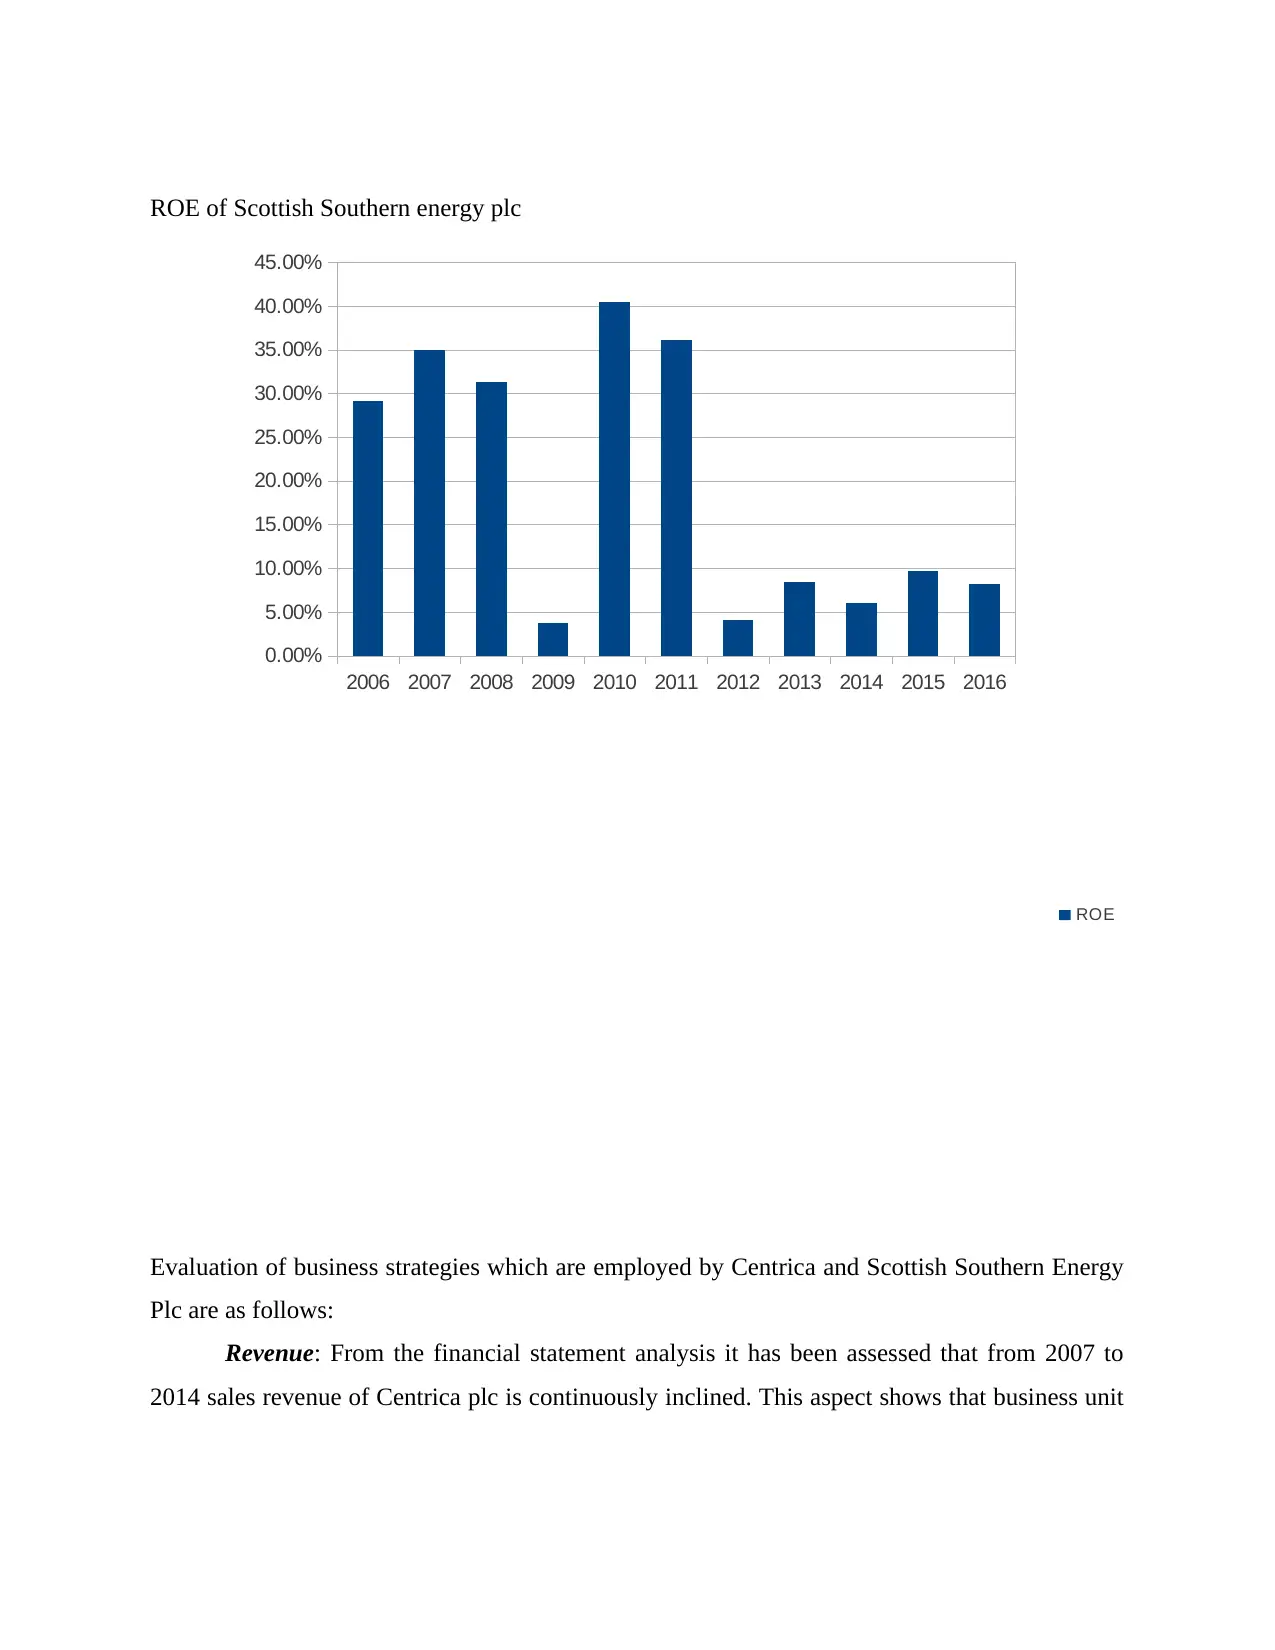
ROE of Scottish Southern energy plc
Evaluation of business strategies which are employed by Centrica and Scottish Southern Energy
Plc are as follows:
Revenue: From the financial statement analysis it has been assessed that from 2007 to
2014 sales revenue of Centrica plc is continuously inclined. This aspect shows that business unit
2006 2007 2008 2009 2010 2011 2012 2013 2014 2015 2016
0.00%
5.00%
10.00%
15.00%
20.00%
25.00%
30.00%
35.00%
40.00%
45.00%
ROE
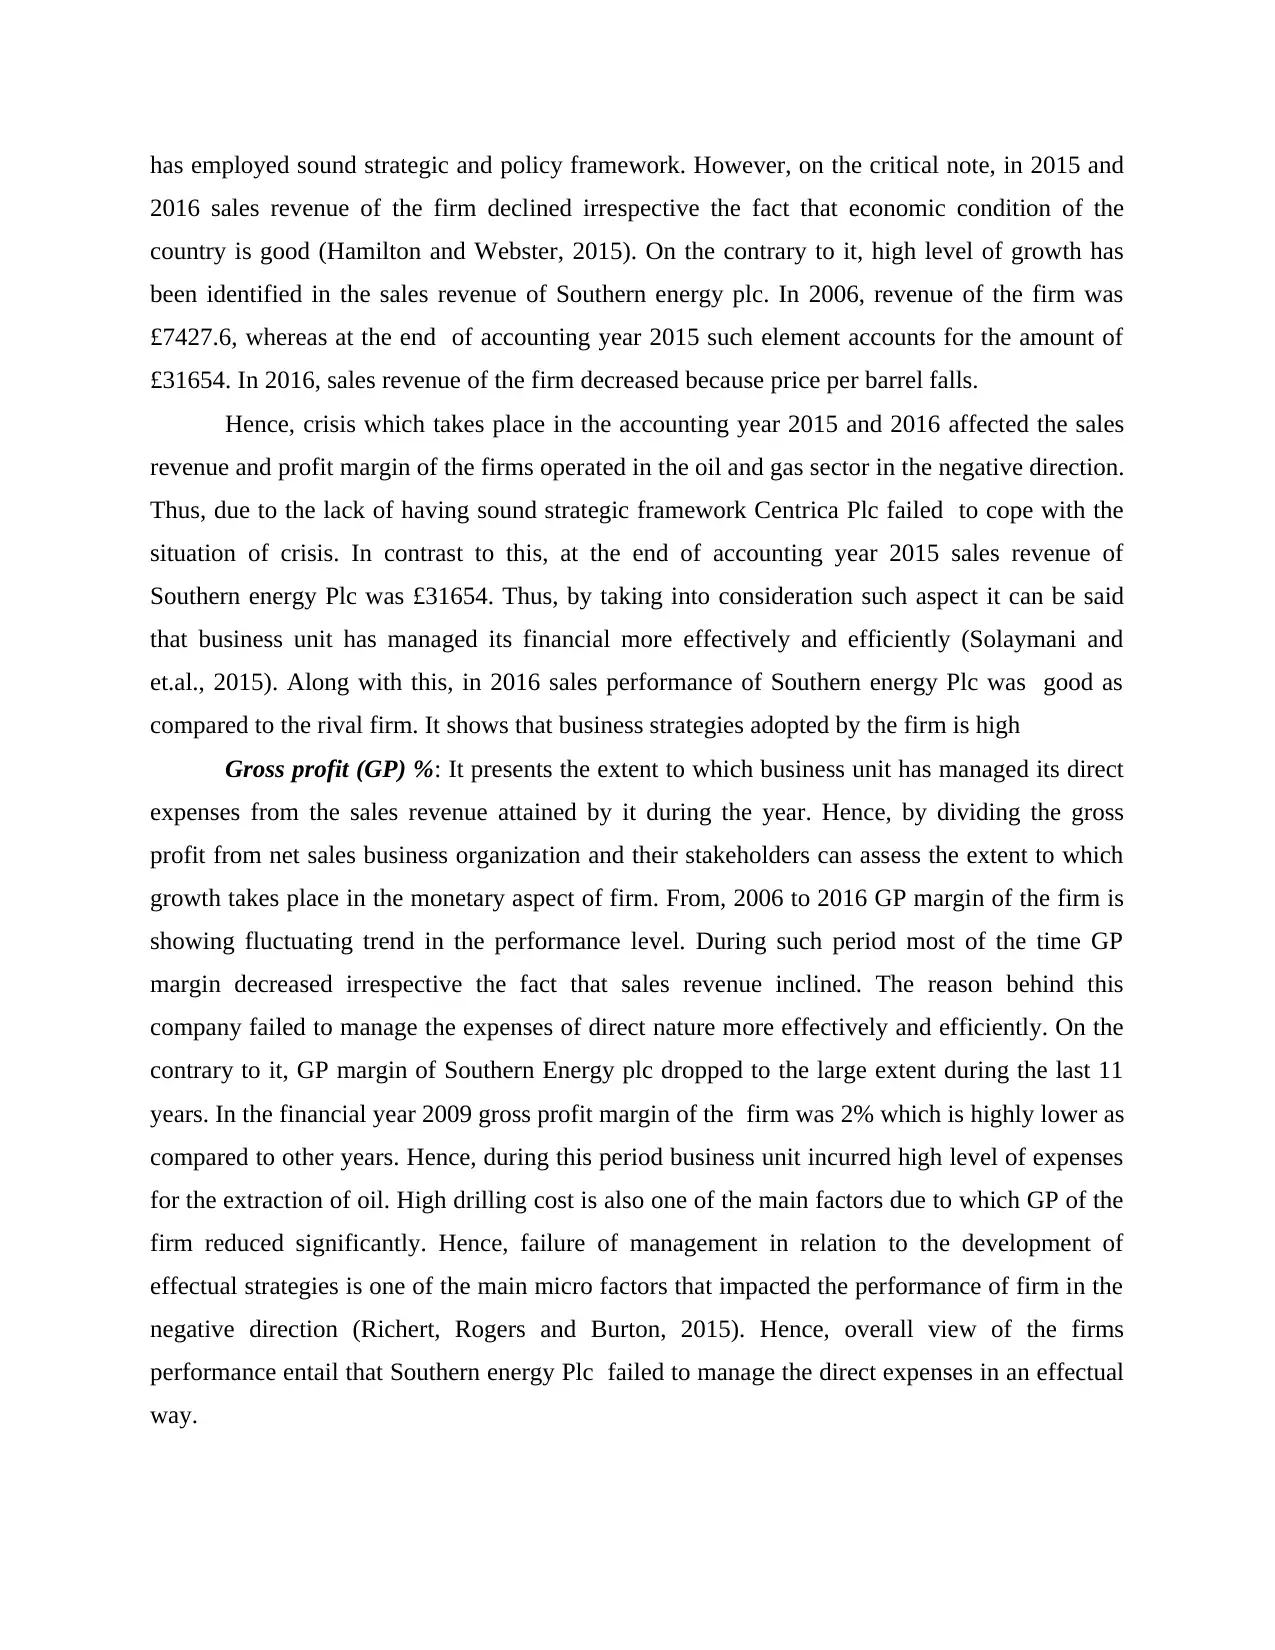
has employed sound strategic and policy framework. However, on the critical note, in 2015 and
2016 sales revenue of the firm declined irrespective the fact that economic condition of the
country is good (Hamilton and Webster, 2015). On the contrary to it, high level of growth has
been identified in the sales revenue of Southern energy plc. In 2006, revenue of the firm was
£7427.6, whereas at the end of accounting year 2015 such element accounts for the amount of
£31654. In 2016, sales revenue of the firm decreased because price per barrel falls.
Hence, crisis which takes place in the accounting year 2015 and 2016 affected the sales
revenue and profit margin of the firms operated in the oil and gas sector in the negative direction.
Thus, due to the lack of having sound strategic framework Centrica Plc failed to cope with the
situation of crisis. In contrast to this, at the end of accounting year 2015 sales revenue of
Southern energy Plc was £31654. Thus, by taking into consideration such aspect it can be said
that business unit has managed its financial more effectively and efficiently (Solaymani and
et.al., 2015). Along with this, in 2016 sales performance of Southern energy Plc was good as
compared to the rival firm. It shows that business strategies adopted by the firm is high
Gross profit (GP) %: It presents the extent to which business unit has managed its direct
expenses from the sales revenue attained by it during the year. Hence, by dividing the gross
profit from net sales business organization and their stakeholders can assess the extent to which
growth takes place in the monetary aspect of firm. From, 2006 to 2016 GP margin of the firm is
showing fluctuating trend in the performance level. During such period most of the time GP
margin decreased irrespective the fact that sales revenue inclined. The reason behind this
company failed to manage the expenses of direct nature more effectively and efficiently. On the
contrary to it, GP margin of Southern Energy plc dropped to the large extent during the last 11
years. In the financial year 2009 gross profit margin of the firm was 2% which is highly lower as
compared to other years. Hence, during this period business unit incurred high level of expenses
for the extraction of oil. High drilling cost is also one of the main factors due to which GP of the
firm reduced significantly. Hence, failure of management in relation to the development of
effectual strategies is one of the main micro factors that impacted the performance of firm in the
negative direction (Richert, Rogers and Burton, 2015). Hence, overall view of the firms
performance entail that Southern energy Plc failed to manage the direct expenses in an effectual
way.
⊘ This is a preview!⊘
Do you want full access?
Subscribe today to unlock all pages.
Trusted by 1+ million students worldwide
Net profit (NP) % This measure provides deeper insight about the extent to which
business unit has fund to distribute among the shareholders. Along with this, it also provides
deeper insight about the firms ability in relation to the management of indirect expenses. During
the period of 11 years five times Centrica Plc suffered from the situation of negative return. This
aspect presents that company has incurred high level of expenses in comparison to the other
years. Thus, it reflects that higher management fails to exert effectual control on the expenditure
level during this period. Hence, after facing such critical situation business unit has taken
decision in relation to the reduction of job level to maintain the expenditure.
Along with this, depressed oil prices are also one of the significant factors due to which
net profit margin of the firm was affected in the negative direction. Further, company has also
made its efforts in relation to cutting the prices with the aim to cope up with the price level.
Unfortunately, management failed to manage the expenses that is resulted into lower or negative
profit margin in the last 10 years. Hence, due to the external pressure in terms of reducing the
price of barrel and other crisis Centrica Plc has taken several decisions with the aim to improve
its position in the market. Hence, by taking into account such aspect business enterprise has
taken decision in relation to the cutting down dividend and reducing the level of capital
expenditure (Sadaghiani and et.al., 2015). Thus, it is highly required for the business
organization to change the portfolio mix to the large extent. This in turn helps company in
improving its financial position and performance level to the large extent.
On the other hand, net profitability margin of Southern Energy Plc reduced from 7.54%
to 1.60% at the end of accounting year 2016. Hence, from the financial report it has been
assessed that with the aim to cope with the critical business situations company has undertaken
number of research projects in relation to the renewable energy options including biomass, solar,
wind etc. (Financial statement of Southern Energy Plc, 2009). Further, in 2009, Southern Energy
Plc started projects in relation to finding the most economical ways to perform the
manufacturing aspects or operations. Hence, due to this net profitability aspect of the firm
decreased to the significant level.
Along with this, debt burden is another significant factors due to which profit margin of
the firm declined. Moreover, in the period of 2009 business unit required billion of dollar to
build and maintain smarter, robust transmission and distribution system. In addition to this, to
Paraphrase This Document
Need a fresh take? Get an instant paraphrase of this document with our AI Paraphraser
expand the grid operations business unit had taken decision to raise debt. Hence high debt and
interest expense is one of the main factors due to which both Centrica and Southern Plc failed to
maintain high level of profit margin especially in the period of 2009. Thus, debt burden is the
main causes behind the decreasing trend in the profit margin (Betz and et.al., 2015). Moreover,
debt instrument such as bank loan and debentures impose fixed periodical financial burden in
front of the firm in terms of interest payment. Thus, it is recommended to the business
organization to undertake limited projects at one time. In this way, by taking the significant
measures or actions both Centrica plc and Southern energy plc would become able to meet the
objectives of themselves and their stakeholders to the large extent.
Earning per share: The amount or proportion of net earnings that Centrica Plc distribute
or allocate to their investors on each holding is called earnings per share (EPS). It is an indicator
of profitability which can be determined by dividing the residual earnings to the number of
outstanding shares. Investors often use this ratio to examine the possibility of return on their
investment in the company. With reference to Centrica Plc, in 2007, growth in net profitability
was the main reason for positive EPS of 1.28. In this year, although revenue dropped down but
still effective control over cost assist management to maximize their net earnings and deliver
more return to the organization (Lamorgese, Geneletti and Partidario, 2015). However,
thereafter, in 2009, EPS got decreased to -0.13 due to adverse market conditions and financial
crisis. As per the chart presented, it can be seen that in the year 2005, Centrica Plc’s net earnings
was only £672m which got improved in 2007 to £1122m but still, in 2009, it came down to
£1111m. In this, year, adjusted EPS remained unchanged to 21.7 pence due to more issuance of
shares as it grown up by 22%. However, in 2007, EPS indicates strong performance because of
favorable commodity prices that driven more revenue and return to the Centrica Plc. As a result,
it became able to deliver better return to their investors (McChlery and et.al., 2015). However, its
Total Shareholder return (TSR) showed an exceptional performance in comparison to FTSE 100
Index as company has outperformed the FTSE Index beyond 20% over a period of 5 year.
However, 2010, stipulated growth in basic EPS and adjusted EPS to 25.2 and 1.49 pence even
after 22% increase in average number of shares. But at the end of the period, its performance
came down because of lower EPS -0.56 whilst adjusted EPS dropped down by 4%.
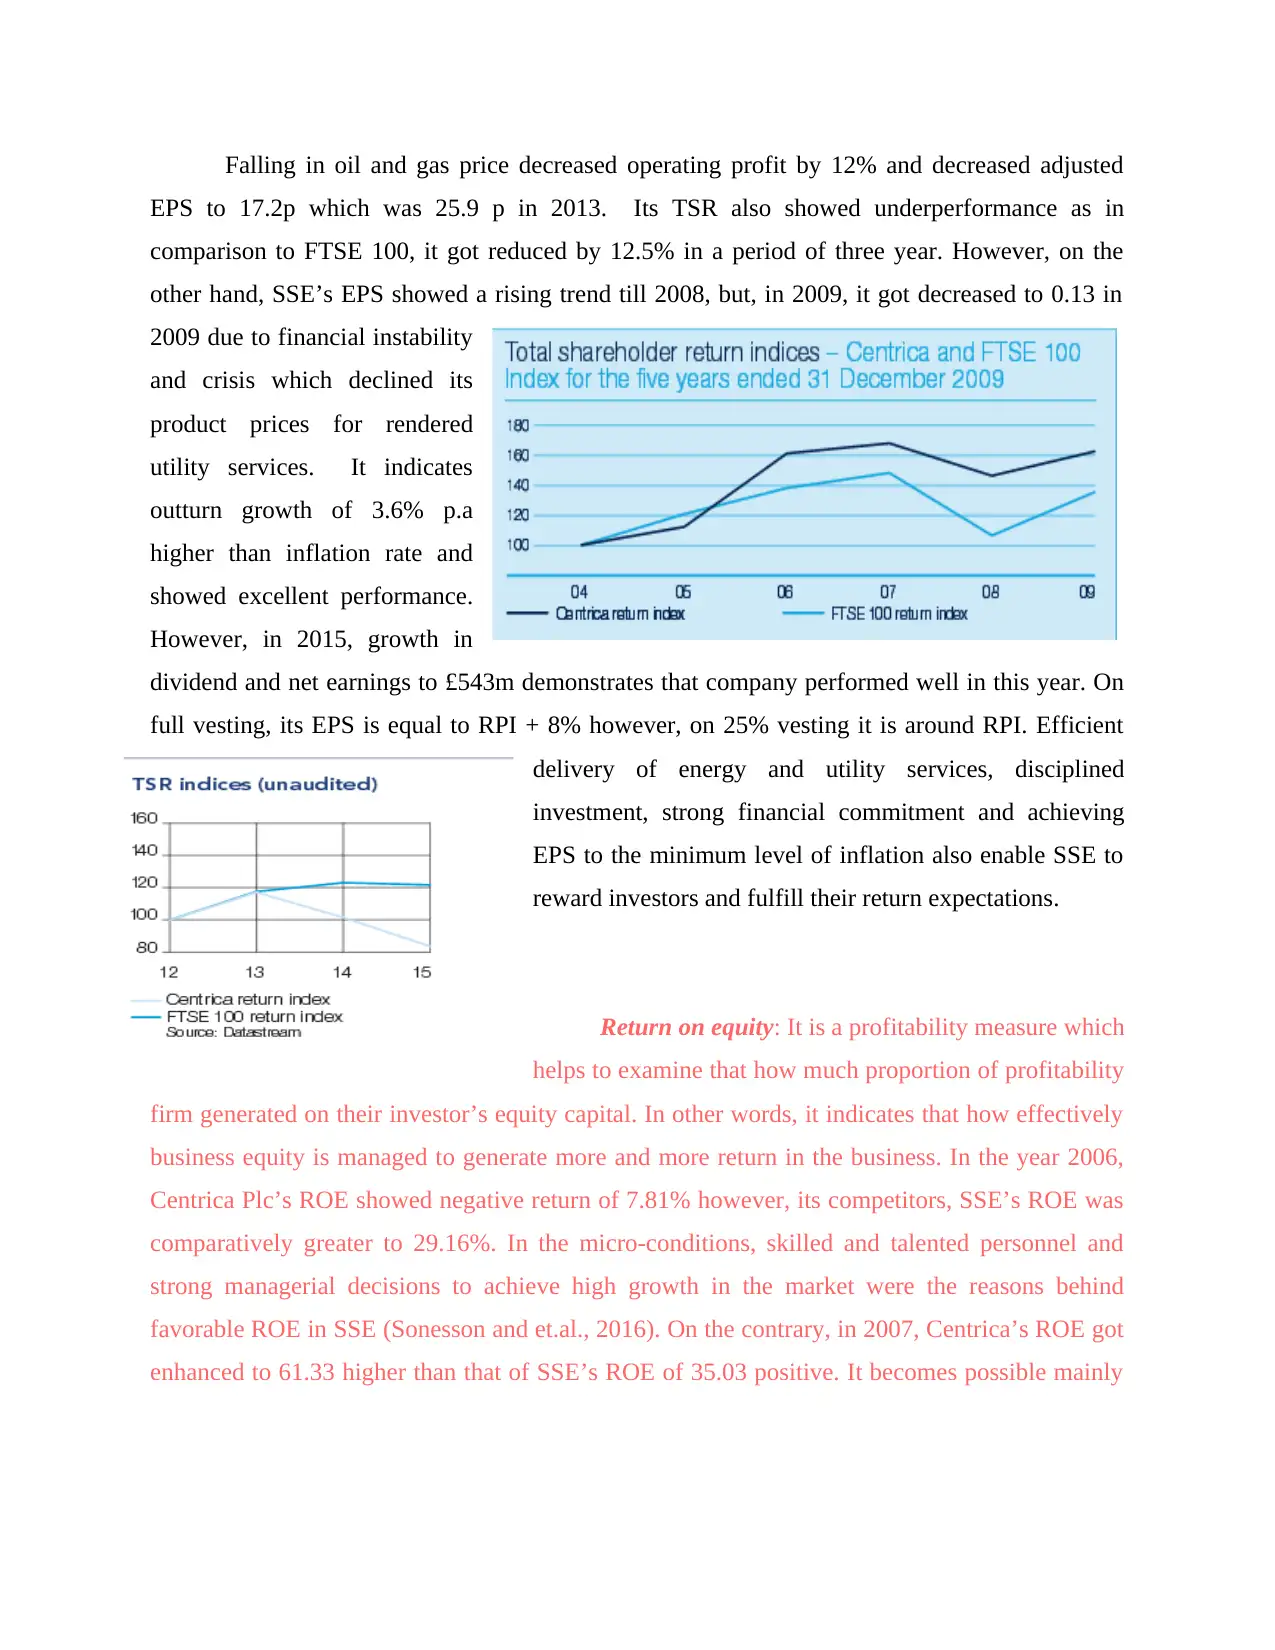
Falling in oil and gas price decreased operating profit by 12% and decreased adjusted
EPS to 17.2p which was 25.9 p in 2013. Its TSR also showed underperformance as in
comparison to FTSE 100, it got reduced by 12.5% in a period of three year. However, on the
other hand, SSE’s EPS showed a rising trend till 2008, but, in 2009, it got decreased to 0.13 in
2009 due to financial instability
and crisis which declined its
product prices for rendered
utility services. It indicates
outturn growth of 3.6% p.a
higher than inflation rate and
showed excellent performance.
However, in 2015, growth in
dividend and net earnings to £543m demonstrates that company performed well in this year. On
full vesting, its EPS is equal to RPI + 8% however, on 25% vesting it is around RPI. Efficient
delivery of energy and utility services, disciplined
investment, strong financial commitment and achieving
EPS to the minimum level of inflation also enable SSE to
reward investors and fulfill their return expectations.
Return on equity: It is a profitability measure which
helps to examine that how much proportion of profitability
firm generated on their investor’s equity capital. In other words, it indicates that how effectively
business equity is managed to generate more and more return in the business. In the year 2006,
Centrica Plc’s ROE showed negative return of 7.81% however, its competitors, SSE’s ROE was
comparatively greater to 29.16%. In the micro-conditions, skilled and talented personnel and
strong managerial decisions to achieve high growth in the market were the reasons behind
favorable ROE in SSE (Sonesson and et.al., 2016). On the contrary, in 2007, Centrica’s ROE got
enhanced to 61.33 higher than that of SSE’s ROE of 35.03 positive. It becomes possible mainly
⊘ This is a preview!⊘
Do you want full access?
Subscribe today to unlock all pages.
Trusted by 1+ million students worldwide
1 out of 16
Related Documents


Your All-in-One AI-Powered Toolkit for Academic Success.
+13062052269
info@desklib.com
Available 24*7 on WhatsApp / Email
![[object Object]](/_next/static/media/star-bottom.7253800d.svg)
Unlock your academic potential
Copyright © 2020–2026 A2Z Services. All Rights Reserved. Developed and managed by ZUCOL.