Mechanical Engineering Lab Report: Centrifugal Pump Performance
VerifiedAdded on 2019/09/30
|19
|4095
|489
Report
AI Summary
This lab report details an experiment conducted to determine the effects of flow rate and speed on the head, efficiency, and brake horsepower requirements of a centrifugal pump. The experiment involved running the pump at four different speeds (1000, 1250, 1500, and 1750 rpm) with varying flow rates (0, 2, 4, 8, 12, and 16 gpm). Measurements of suction pressure, discharge pressure, and torque were taken at each speed and flow rate. Subsequent calculations were performed to determine pump head, shaft work (BHP), net positive suction head (NPSH), and efficiency. The results indicate that brake horsepower increases with flow rate, pump head decreases as flow rate increases, and efficiency increases with flow rate. The report also discusses the relationship between these parameters and provides detailed tables of collected data and converted values. The report concludes with an analysis of the pump's performance characteristics under different operating conditions.
Date: October 8, 2015
Lab Report: Centrifugal Pump Characteristics
Summary:
The purpose of this experiment was to determine the effect of flow rate, speed of water at the
head, efficiency and the brake horsepower requirement of a centrifugal pump. Three separate experiments
were conducted at different speeds; 1000 rpm, 1250 rpm, 1500 rpm, and 1750 rpm with different flow
rates of 0, 2, 4, 8, 12 and 16 gallons per minute (gpm). Further calculations were made by utilizing
numerous equations in order to obtain values of the pump head (hp), shaft work (BHP), net positive
section head (NPSH) and efficiency. Furthermore, I have analyzed the relationship of the brake
horsepower, pump head, and efficiency versus the volumetric flowrate. It was concluded that the brake
horsepower at different pump speeds increase as the flow rate increases, the pump head decrease as the
volumetric flow rate increases, and the efficiency increases as the flow rate increases. Surprisingly, the
net positive suction head at speed 1750 rpm drops rapidly with increasing flow rate. Furthermore, final
results exhibit that the shaft work increases gradually as the flow rate increases.
Background and Methods:
Pump System Description:
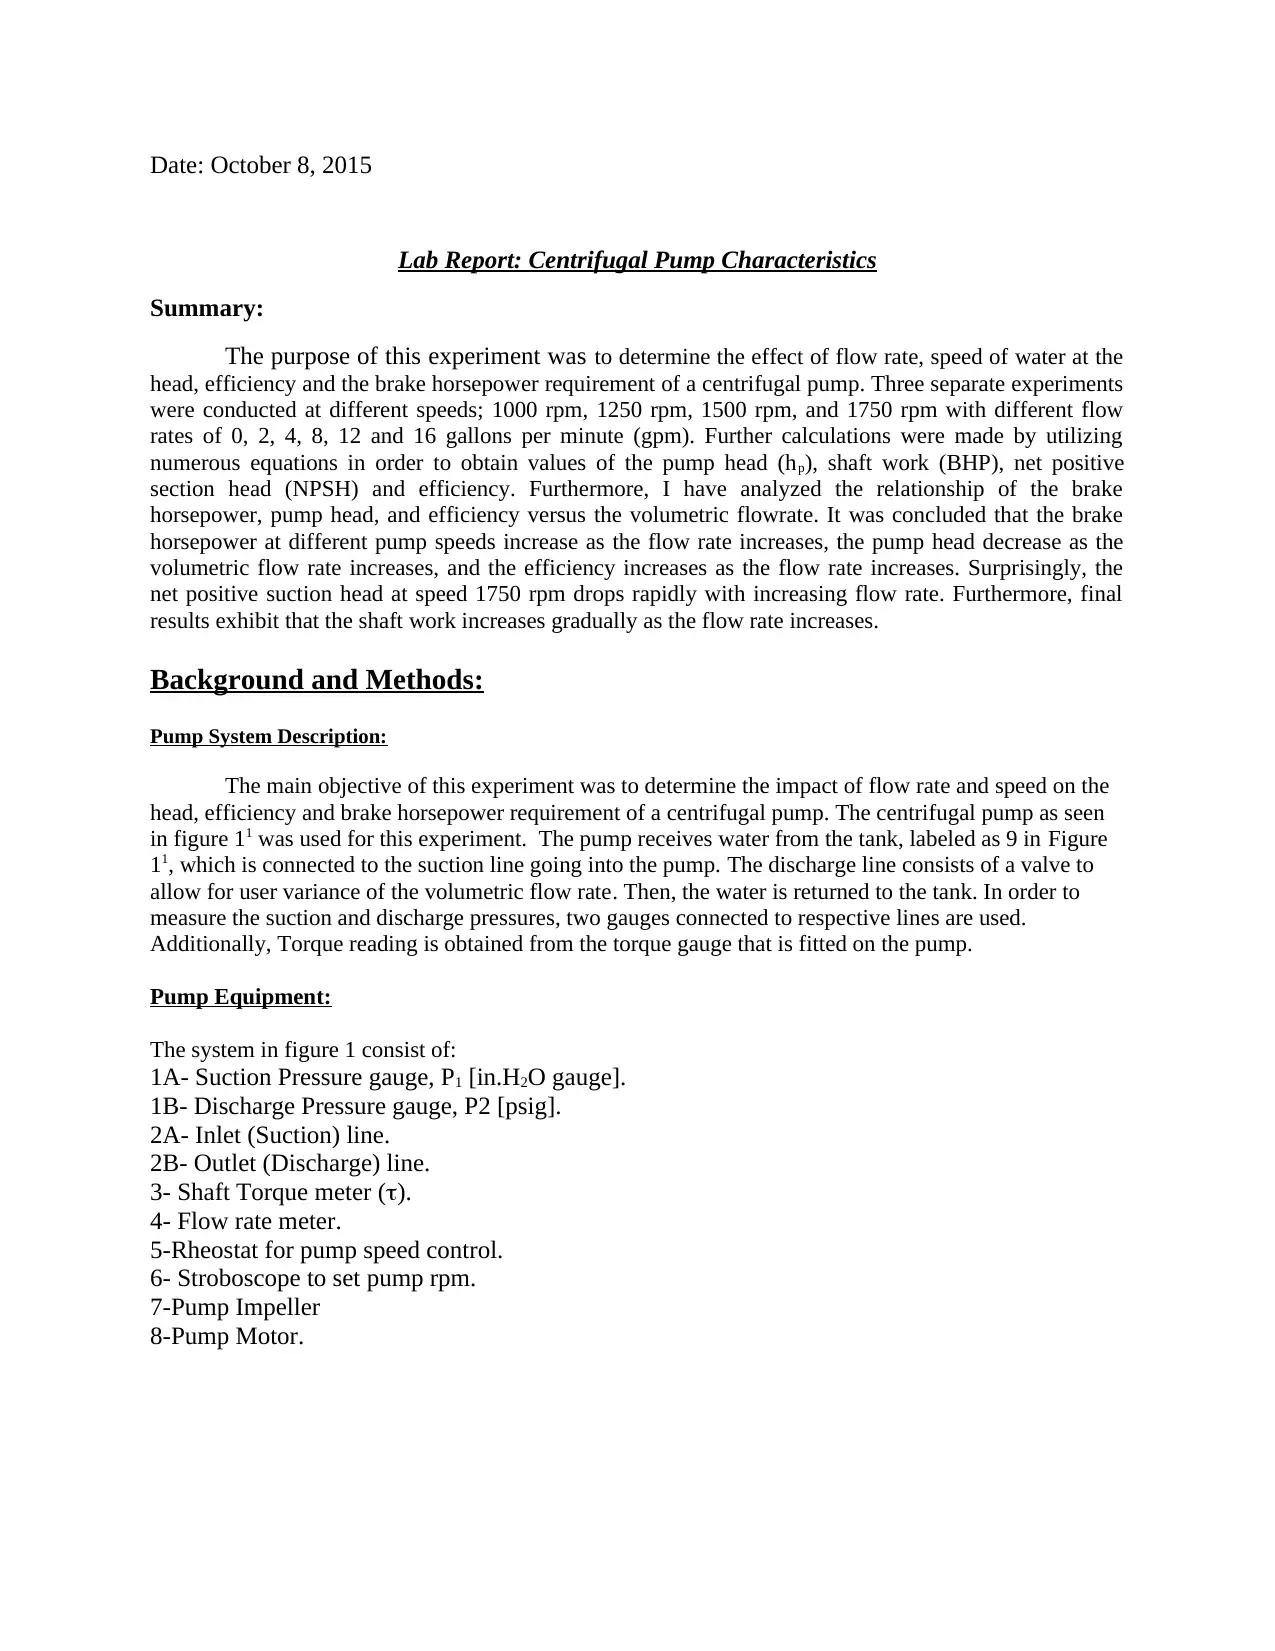
The main objective of this experiment was to determine the impact of flow rate and speed on the
head, efficiency and brake horsepower requirement of a centrifugal pump. The centrifugal pump as seen
in figure 11 was used for this experiment. The pump receives water from the tank, labeled as 9 in Figure
11, which is connected to the suction line going into the pump. The discharge line consists of a valve to
allow for user variance of the volumetric flow rate. Then, the water is returned to the tank. In order to
measure the suction and discharge pressures, two gauges connected to respective lines are used.
Additionally, Torque reading is obtained from the torque gauge that is fitted on the pump.
Pump Equipment:
The system in figure 1 consist of:
1A- Suction Pressure gauge, P1 [in.H2O gauge].
1B- Discharge Pressure gauge, P2 [psig].
2A- Inlet (Suction) line.
2B- Outlet (Discharge) line.
3- Shaft Torque meter ().
4- Flow rate meter.
5-Rheostat for pump speed control.
6- Stroboscope to set pump rpm.
7-Pump Impeller
8-Pump Motor.
Lab Report: Centrifugal Pump Characteristics
Summary:
The purpose of this experiment was to determine the effect of flow rate, speed of water at the
head, efficiency and the brake horsepower requirement of a centrifugal pump. Three separate experiments
were conducted at different speeds; 1000 rpm, 1250 rpm, 1500 rpm, and 1750 rpm with different flow
rates of 0, 2, 4, 8, 12 and 16 gallons per minute (gpm). Further calculations were made by utilizing
numerous equations in order to obtain values of the pump head (hp), shaft work (BHP), net positive
section head (NPSH) and efficiency. Furthermore, I have analyzed the relationship of the brake
horsepower, pump head, and efficiency versus the volumetric flowrate. It was concluded that the brake
horsepower at different pump speeds increase as the flow rate increases, the pump head decrease as the
volumetric flow rate increases, and the efficiency increases as the flow rate increases. Surprisingly, the
net positive suction head at speed 1750 rpm drops rapidly with increasing flow rate. Furthermore, final
results exhibit that the shaft work increases gradually as the flow rate increases.
Background and Methods:
Pump System Description:
The main objective of this experiment was to determine the impact of flow rate and speed on the
head, efficiency and brake horsepower requirement of a centrifugal pump. The centrifugal pump as seen
in figure 11 was used for this experiment. The pump receives water from the tank, labeled as 9 in Figure
11, which is connected to the suction line going into the pump. The discharge line consists of a valve to
allow for user variance of the volumetric flow rate. Then, the water is returned to the tank. In order to
measure the suction and discharge pressures, two gauges connected to respective lines are used.
Additionally, Torque reading is obtained from the torque gauge that is fitted on the pump.
Pump Equipment:
The system in figure 1 consist of:
1A- Suction Pressure gauge, P1 [in.H2O gauge].
1B- Discharge Pressure gauge, P2 [psig].
2A- Inlet (Suction) line.
2B- Outlet (Discharge) line.
3- Shaft Torque meter ().
4- Flow rate meter.
5-Rheostat for pump speed control.
6- Stroboscope to set pump rpm.
7-Pump Impeller
8-Pump Motor.
Paraphrase This Document
Need a fresh take? Get an instant paraphrase of this document with our AI Paraphraser

Figure 11. The pump system that has been used for the experiment.
Measurement Procedure:
The centrifugal pump was run at four speeds; 1000, 1250, 1500 and 1750 revolution per
minute (rpm). The motor rheostat, labeled as 5 in Figure 21, was used to adjust these readings
and made accurate by using the stroboscope (6). At each different speed, measurements of the
suction pressure using gauge 1A from Figure 11, discharge pressure from gauge 1B and the
torque from Figure 11 were measured. Those measurements were taken at flow rates of 0, 2, 4, 8,
12 and 16 gallons per minute. After that, the motor was stopped slowly by decreasing the
rheostat to zero. Finally, the pump was operated in reverse rotation at different speeds, and the
flow rate with discharge valve wide open was observed.
Centrifugal Pump Calculation:
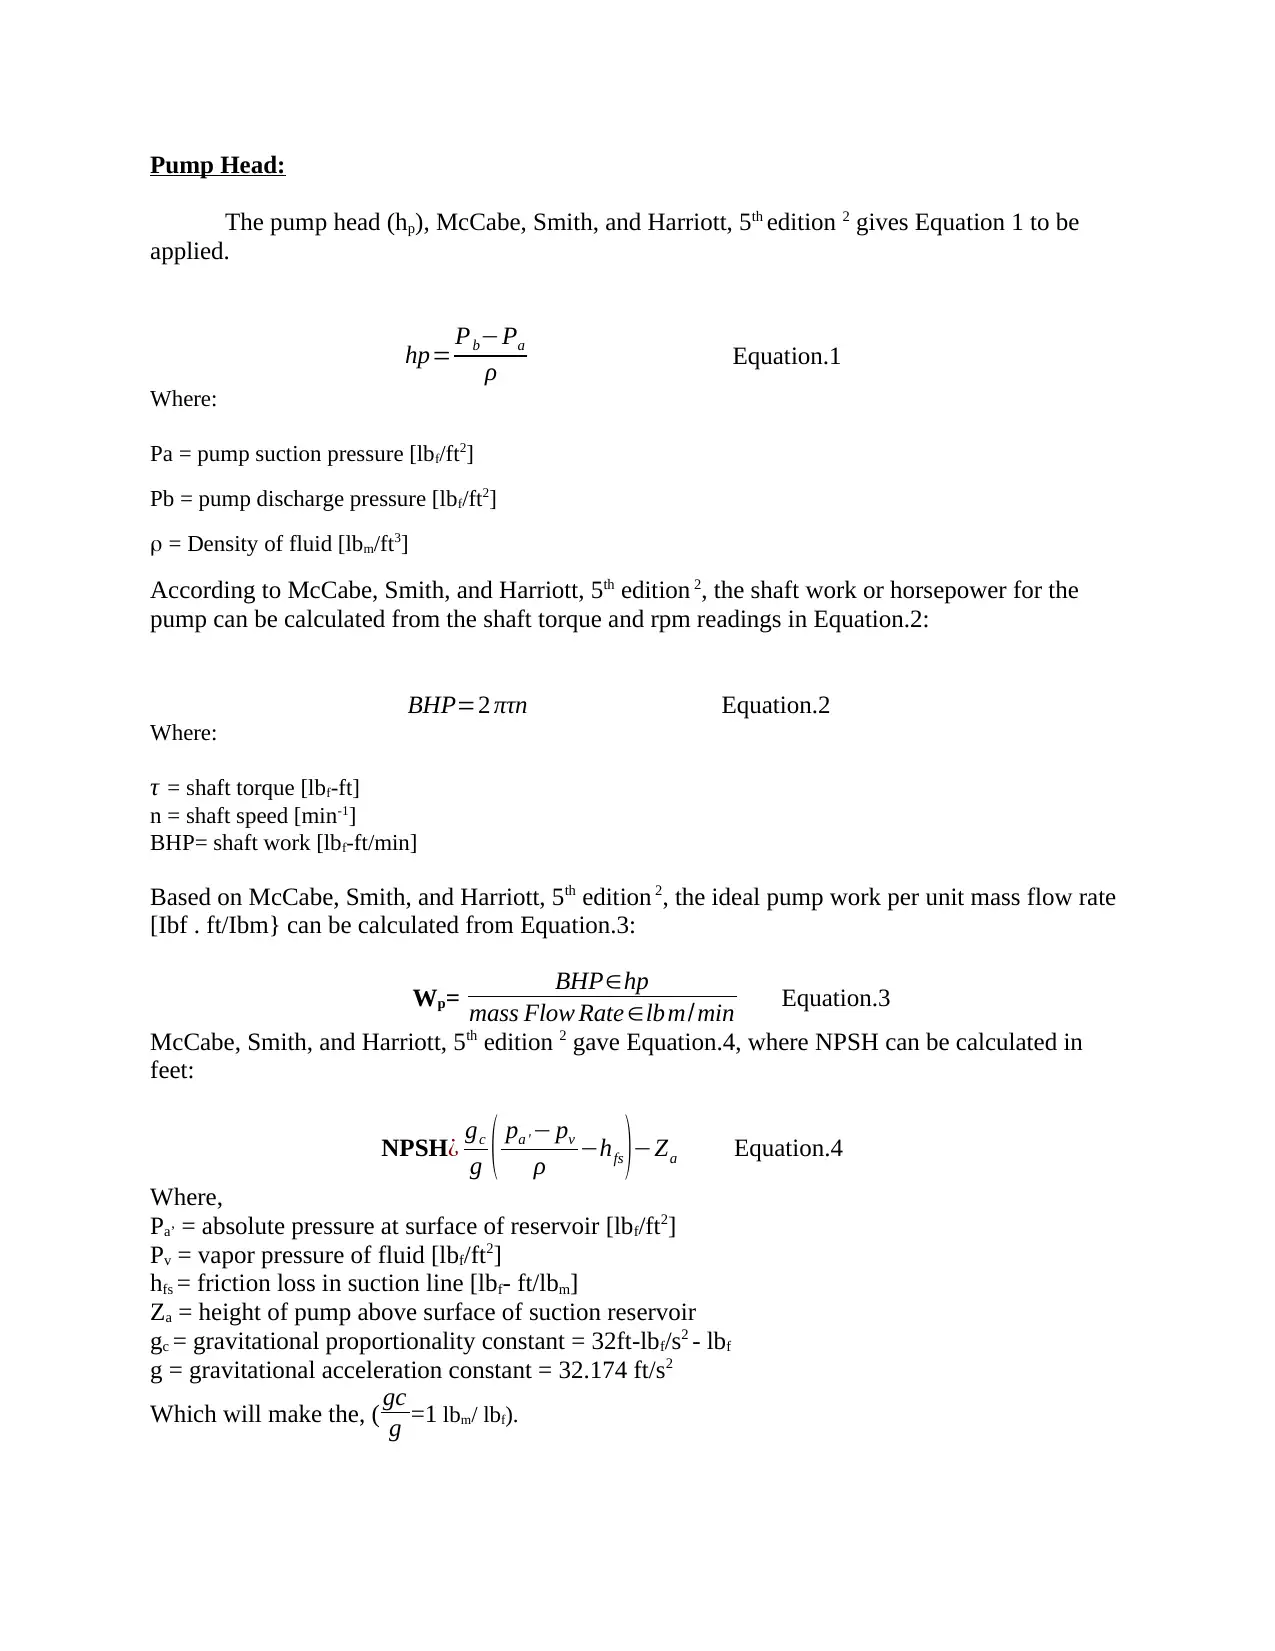
Pump Head:
The pump head (hp), McCabe, Smith, and Harriott, 5th edition 2 gives Equation 1 to be
applied.
hp= Pb−Pa
ρ Equation.1
Where:
Pa = pump suction pressure [lbf/ft2]
Pb = pump discharge pressure [lbf/ft2]
= Density of fluid [lbm/ft3]
According to McCabe, Smith, and Harriott, 5th edition 2, the shaft work or horsepower for the
pump can be calculated from the shaft torque and rpm readings in Equation.2:
BHP=2 πτn Equation.2
Where:
τ = shaft torque [lbf-ft]
n = shaft speed [min-1]
BHP= shaft work [lbf-ft/min]
Based on McCabe, Smith, and Harriott, 5th edition 2, the ideal pump work per unit mass flow rate
[Ibf . ft/Ibm} can be calculated from Equation.3:
Wp= BHP∈hp
mass Flow Rate ∈lbm/min Equation.3
McCabe, Smith, and Harriott, 5th edition 2 gave Equation.4, where NPSH can be calculated in
feet:
NPSH¿ gc
g ( pa '− pv
ρ −hfs )−Za Equation.4
Where,
Pa’ = absolute pressure at surface of reservoir [lbf/ft2]
Pv = vapor pressure of fluid [lbf/ft2]
hfs = friction loss in suction line [lbf- ft/lbm]
Za = height of pump above surface of suction reservoir
gc = gravitational proportionality constant = 32ft-lbf/s2 - lbf
g = gravitational acceleration constant = 32.174 ft/s2
Which will make the, ( gc
g =1 lbm/ lbf).
⊘ This is a preview!⊘
Do you want full access?
Subscribe today to unlock all pages.
Trusted by 1+ million students worldwide

Result and Discussion:
As shown below in Table 1 to 4 Pa values in H2O were recorded at different volumetric flow rate at 4
different speed and the mean values, standard deviation and 95% confidence interval values are shown.
Table 1: Pa (in H2O) data collected over three weeks at 1000 RPM with mean, standard deviation and 95% confidence interval
values
1000 RPM (Pa)
(in H2O)
volumetric Flow
rate (GPM)
Week
#1
Week
#2 Week #3 Mean STD
Con.95%
interval
0 5.6 6.0 4.3 5.3 0.9 1.0
2 5.6 6.0 4.3 5.3 0.9 1.0
4 5.6 6.0 4.3 5.3 0.9 1.0
8 5.6 5.5 4.0 5.0 0.9 1.0
12 4.0 4.8 3.0 3.9 0.9 1.0
16 1.0 0.0 0.0 0.3 0.6 0.7
Table 2: Pa (in H2O) data collected over three weeks at 1250 RPM with mean, standard deviation and 95% confidence interval
values.
1250 RPM (Pa)
(in H2O)
volumetric Flow
rate (GPM)
Week
#1
Week
#2 Week #3 Mean STD
Con.95%
interval
0 5.6 5.6 4.8 5.3 0.5 0.5
2 6.0 5.6 4.7 5.4 0.7 0.8
4 5.8 5.5 4.5 5.3 0.7 0.8
8 5.8 5.2 4.0 5.0 0.9 1.0
12 3.5 3.9 3.0 3.5 0.5 0.5
16 1.0 0.0 0.0 0.3 0.6 0.7
Table 3: Pa (in H2O) data collected over three weeks at 1500 RPM with mean, standard deviation and 95% confidence interval
values.
1500 RPM (Pa)
(in H2O)
volumetric Flow
rate (GPM)
Week
#1
Week
#2 Week #3 Mean STD
Con.95%
interval
0 6.5 6.1 5.0 5.9 0.8 0.9
2 6.0 5.7 4.8 5.5 0.6 0.7
4 6.0 5.5 4.7 5.4 0.7 0.7
8 5.7 5.2 4.0 5.0 0.9 1.0
12 4.0 3.5 3.0 3.5 0.5 0.6
16 0.9 0.0 0.0 0.3 0.5 0.6
Table 4: Pa (in H2O) data collected over three weeks at 1750 RPM with mean, standard deviation and 95% confidence interval
values.
Paraphrase This Document
Need a fresh take? Get an instant paraphrase of this document with our AI Paraphraser

1750 RPM (Pa)
(in H2O)
volumetric Flow
rate (GPM)
Week
#1
Week
#2 Week #3 Mean STD
Con.95%
interval
0 6.8 6.5 5.5 6.3 0.7 0.8
2 6.0 5.7 5.1 5.6 0.5 0.5
4 6.0 5.5 5.0 5.5 0.5 0.6
8 5.5 5.0 4.0 4.8 0.8 0.9
12 3.5 3.5 3.0 3.3 0.3 0.3
16 0.0 0.1 0.0 0.0 0.1 0.1
Similar measurements of Pb (Pisg) are shown in Table 5 to 8 for each of the rotational speeds,
respectively. Mean, standard deviation and 95% confidence interval values are shown below.
Table 5: Pb (Psig) data collected over three weeks at 1000 RPM with mean, standard deviation and 95% confidence interval
values.
volumetric Flow
rate (GPM)
Week
#1
Week
#2
Week
#3 Mean STD Con.95% interval
0 4.3 4.8 2.9 4.00 0.98 1.11
2 4 4.5 2.7 3.73 0.93 1.05
4 4 4.4 2.6 3.67 0.95 1.07
8 3.7 4.1 2.4 3.40 0.89 1.01
12 3.2 3.8 2.1 3.03 0.86 0.98
16 2.8 3.1 1.7 2.53 0.74 0.83
Table 6: Pb (Psig) data collected over three weeks at 1250 RPM with mean, standard deviation and 95% confidence interval
values.
volumetric Flow
rate (GPM) Week #1 Week #2 Week #3 Mean STD Con.95% interval
0 4.2 4.0 4.1 4.10 0.10 0.11
2 3.9 3.8 3.8 3.83 0.06 0.07
4 3.8 3.7 3.8 3.77 0.06 0.07
8 3.5 3.4 3.4 3.43 0.06 0.07
12 3.1 3.0 3.0 3.03 0.06 0.07
16 2.7 2.6 2.6 2.63 0.06 0.07
Table 7: Pb (Psig) data collected over three weeks at 1500 RPM with mean, standard deviation and 95% confidence interval
values.
volumetric Flow rate
(GPM) Week #1 Week #2 Week #3 Mean STD Con.95% interval
0 5.9 5.9 5.8 5.87 0.06 0.07
2 5.5 5.5 5.4 5.47 0.06 0.07
4 5.4 5.4 5.3 5.37 0.06 0.07
8 5.0 5.1 4.9 5.00 0.10 0.11
12 4.4 4.5 4.3 4.40 0.10 0.11
16 3.9 3.8 3.8 3.83 0.06 0.07
Table 8: Pb (Psig) data collected over three weeks at 1750 RPM with mean, standard deviation and 95% confidence interval
values.

volumetric Flow rate
(GPM) Week #1 Week #2 Week #3 Mean STD Con.95% interval
0 7.6 7.6 7.5 7.57 0.06 0.07
2 7.2 7.0 7.1 7.10 0.10 0.11
4 7.2 7.0 7.0 7.07 0.12 0.13
8 6.8 6.6 6.6 6.67 0.12 0.13
12 6.2 6.0 6.0 6.07 0.12 0.13
16 5.6 5.4 5.4 5.47 0.12 0.13
Finally, recording of Torque (lbf-in) made in the experiment are shown in in Table 9 to 12
For each of the rotational speeds, respectively. Mean, standard deviation and 95% confidence interval
values are shown below.
Table 9: Torque (lbf-in) data collected over three weeks at 1000 RPM with mean, standard deviation and 95% confidence
interval values.
volumetric Flow
rate (GPM) Week #1 Week #2 Week #3 Mean STD Con.95% interval
0 2.8 3.2 2 2.67 0.61 0.69
2 3 3.3 2.2 2.83 0.57 0.64
4 3.3 3.4 2.3 3.00 0.61 0.69
8 3 3.5 2.4 2.97 0.55 0.62
12 3.5 3.7 2.5 3.23 0.64 0.73
16 3.8 4 2.7 3.50 0.70 0.79
Table 10: Torque (lbf-in) data collected over three weeks at 1250 RPM with mean, standard deviation and 95% confidence
interval values.
volumetric Flow
rate (GPM) Week #1 Week #2 Week #3 Mean STD Con.95% interval
0 2.8 2.5 2.8 2.7 0.17 0.20
2 2.8 2.8 3.0 2.9 0.12 0.13
4 3.0 2.9 3.1 3.0 0.10 0.11
8 3.3 3.0 3.3 3.2 0.17 0.20
12 3.3 3.2 3.6 3.4 0.21 0.24
16 3.5 3.5 3.9 3.6 0.23 0.26
Table 11: Torque (lbf-in) data collected over three weeks at 1500 RPM with mean, standard deviation and 95% confidence
interval values.
volumetric Flow
rate (GPM) Week #1 Week #2 Week #3 Mean STD Con.95% interval
0 3.5 3.6 3.9 3.7 0.21 0.24
2 3.7 3.9 4.0 3.9 0.15 0.17
4 3.8 4.0 4.1 4.0 0.15 0.17
8 4.0 4.2 4.3 4.2 0.15 0.17
12 4.3 4.5 4.5 4.4 0.12 0.13
16 4.8 4.9 5.0 4.9 0.10 0.11
Table 12: Torque (lbf-in) data collected over three weeks at 1750 RPM with mean, standard deviation and 95% confidence
interval values.
volumetric Flow Week #1 Week #2 Week #3 Mean STD Con.95% interval
⊘ This is a preview!⊘
Do you want full access?
Subscribe today to unlock all pages.
Trusted by 1+ million students worldwide

rate (GPM)
0 5.0 4.9 5.1 5.0 0.10 0.11
2 5.0 5.1 5.3 5.1 0.15 0.17
4 5.3 5.0 5.4 5.2 0.21 0.24
8 5.4 5.3 5.6 5.4 0.15 0.17
12 5.5 5.6 5.8 5.6 0.15 0.17
16 6.0 6.0 6.2 6.1 0.12 0.13
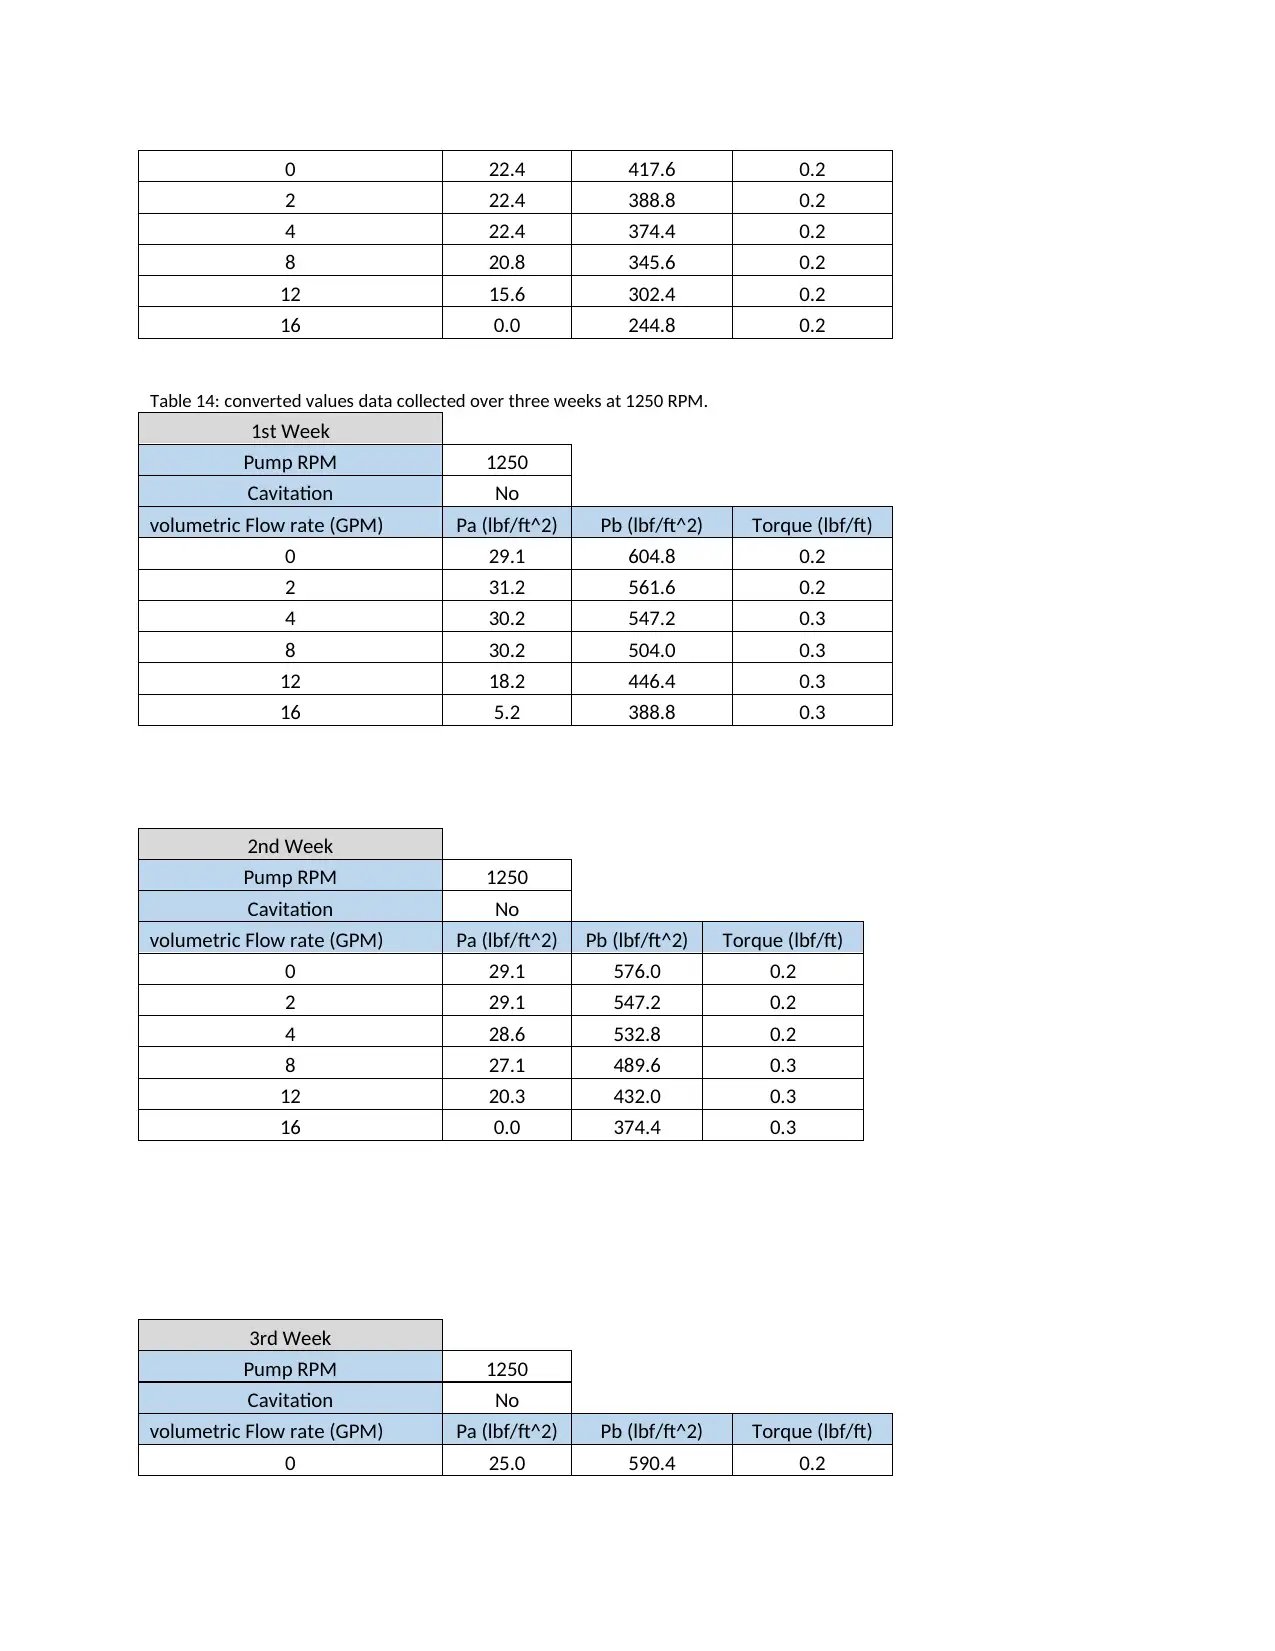
Conversion to Standard Units
The conversion of all values of Pa (lbf/ft^2), Pb (lbf/ft^2) and torque (lbf-in) shown in Table 13
to 16 were recorded at different volumetric flow rate at 4 different speed.
Table 13: converted values data collected over three weeks at 1000 rpm.
1st Week
Pump RPM 1000
Cavitation No
volumetric Flow rate (GPM) Pa (lbf/ft^2) Pb (lbf/ft^2) Torque (lbf/ft)
0 29.1 612.0 0.2
2 29.1 576.0 0.3
4 29.1 576.0 0.3
8 29.1 532.8 0.3
12 20.8 460.8 0.3
16 5.2 403.2 0.3
2nd Week
Pump RPM 1000
Cavitation No
volumetric Flow rate (GPM) Pa (lbf/ft^2) Pb (lbf/ft^2) Torque (lbf/ft)
0 31.2 691.2 0.3
2 31.2 648.0 0.3
4 31.2 633.6 0.3
8 28.6 590.4 0.3
12 25.0 547.2 0.3
16 0.0 446.4 0.3
3rd Week
Pump RPM 1000
Cavitation No
volumetric Flow rate (GPM) Pa (lbf/ft^2) Pb (lbf/ft^2) Torque (lbf/ft)
0 5.0 4.9 5.1 5.0 0.10 0.11
2 5.0 5.1 5.3 5.1 0.15 0.17
4 5.3 5.0 5.4 5.2 0.21 0.24
8 5.4 5.3 5.6 5.4 0.15 0.17
12 5.5 5.6 5.8 5.6 0.15 0.17
16 6.0 6.0 6.2 6.1 0.12 0.13
Conversion to Standard Units
The conversion of all values of Pa (lbf/ft^2), Pb (lbf/ft^2) and torque (lbf-in) shown in Table 13
to 16 were recorded at different volumetric flow rate at 4 different speed.
Table 13: converted values data collected over three weeks at 1000 rpm.
1st Week
Pump RPM 1000
Cavitation No
volumetric Flow rate (GPM) Pa (lbf/ft^2) Pb (lbf/ft^2) Torque (lbf/ft)
0 29.1 612.0 0.2
2 29.1 576.0 0.3
4 29.1 576.0 0.3
8 29.1 532.8 0.3
12 20.8 460.8 0.3
16 5.2 403.2 0.3
2nd Week
Pump RPM 1000
Cavitation No
volumetric Flow rate (GPM) Pa (lbf/ft^2) Pb (lbf/ft^2) Torque (lbf/ft)
0 31.2 691.2 0.3
2 31.2 648.0 0.3
4 31.2 633.6 0.3
8 28.6 590.4 0.3
12 25.0 547.2 0.3
16 0.0 446.4 0.3
3rd Week
Pump RPM 1000
Cavitation No
volumetric Flow rate (GPM) Pa (lbf/ft^2) Pb (lbf/ft^2) Torque (lbf/ft)
Paraphrase This Document
Need a fresh take? Get an instant paraphrase of this document with our AI Paraphraser
0 22.4 417.6 0.2
2 22.4 388.8 0.2
4 22.4 374.4 0.2
8 20.8 345.6 0.2
12 15.6 302.4 0.2
16 0.0 244.8 0.2
Table 14: converted values data collected over three weeks at 1250 RPM.
1st Week
Pump RPM 1250
Cavitation No
volumetric Flow rate (GPM) Pa (lbf/ft^2) Pb (lbf/ft^2) Torque (lbf/ft)
0 29.1 604.8 0.2
2 31.2 561.6 0.2
4 30.2 547.2 0.3
8 30.2 504.0 0.3
12 18.2 446.4 0.3
16 5.2 388.8 0.3
2nd Week
Pump RPM 1250
Cavitation No
volumetric Flow rate (GPM) Pa (lbf/ft^2) Pb (lbf/ft^2) Torque (lbf/ft)
0 29.1 576.0 0.2
2 29.1 547.2 0.2
4 28.6 532.8 0.2
8 27.1 489.6 0.3
12 20.3 432.0 0.3
16 0.0 374.4 0.3
3rd Week
Pump RPM 1250
Cavitation No
volumetric Flow rate (GPM) Pa (lbf/ft^2) Pb (lbf/ft^2) Torque (lbf/ft)
0 25.0 590.4 0.2

2 24.4 547.2 0.3
4 23.4 547.2 0.3
8 20.8 489.6 0.3
12 15.6 432.0 0.3
16 0.0 374.4 0.3
Table 15: converted values data collected over three weeks at 1500 RPM.
1st Week
Pump RPM 1500
Cavitation No
volumetric Flow rate (GPM) Pa (lbf/ft^2) Pb (lbf/ft^2) Torque (lbf/ft)
0 33.8 849.6 0.3
2 31.2 792.0 0.3
4 31.2 777.6 0.3
8 29.7 720.0 0.3
12 20.8 633.6 0.4
16 4.7 561.6 0.4
2nd Week
Pump RPM 1500
Cavitation No
volumetric Flow rate (GPM) Pa (lbf/ft^2) Pb (lbf/ft^2) Torque (lbf/ft)
0 31.7 849.6 0.3
2 29.7 792.0 0.3
4 28.6 777.6 0.3
8 27.1 734.4 0.4
12 18.2 648.0 0.4
16 0.0 547.2 0.4
3rd Week
Pump RPM 1500
Cavitation No
volumetric Flow rate (GPM) Pa (lbf/ft^2) Pb (lbf/ft^2) Torque (lbf/ft)
0 26.0 835.2 0.3
2 25.0 777.6 0.3
⊘ This is a preview!⊘
Do you want full access?
Subscribe today to unlock all pages.
Trusted by 1+ million students worldwide

4 24.4 763.2 0.3
8 20.8 705.6 0.4
12 15.6 619.2 0.4
16 0.0 547.2 0.4
Table 16: converted values data collected over three weeks at 1750 RPM
1st Week
Pump RPM 1750
Cavitation No
volumetric Flow rate (GPM) Pa (lbf/ft^2) Pb (lbf/ft^2) Torque (lbf/ft)
0 35.4 1094.4 0.4
2 31.2 1036.8 0.4
4 31.2 1036.8 0.4
8 28.6 979.2 0.5
12 18.2 892.8 0.5
16 0.0 806.4 0.5
2nd Week
Pump RPM 1750
Cavitation No
volumetric Flow rate (GPM) Pa (lbf/ft^2) Pb (lbf/ft^2) Torque (lbf/ft)
0 33.8 1094.4 0.4
2 29.7 1008.0 0.4
4 28.6 1008.0 0.4
8 26.0 950.4 0.4
12 18.2 864.0 0.5
16 0.5 777.6 0.5
3rd Week
Pump RPM 1750
Cavitation No
volumetric Flow rate (GPM) Pa (lbf/ft^2) Pb (lbf/ft^2) Torque (lbf/ft)
0 28.6 1080.0 0.4
2 26.5 1022.4 0.4
4 26.0 1008.0 0.5
Paraphrase This Document
Need a fresh take? Get an instant paraphrase of this document with our AI Paraphraser
8 20.8 950.4 0.5
12 15.6 864.0 0.5
16 0.0 777.6 0.5
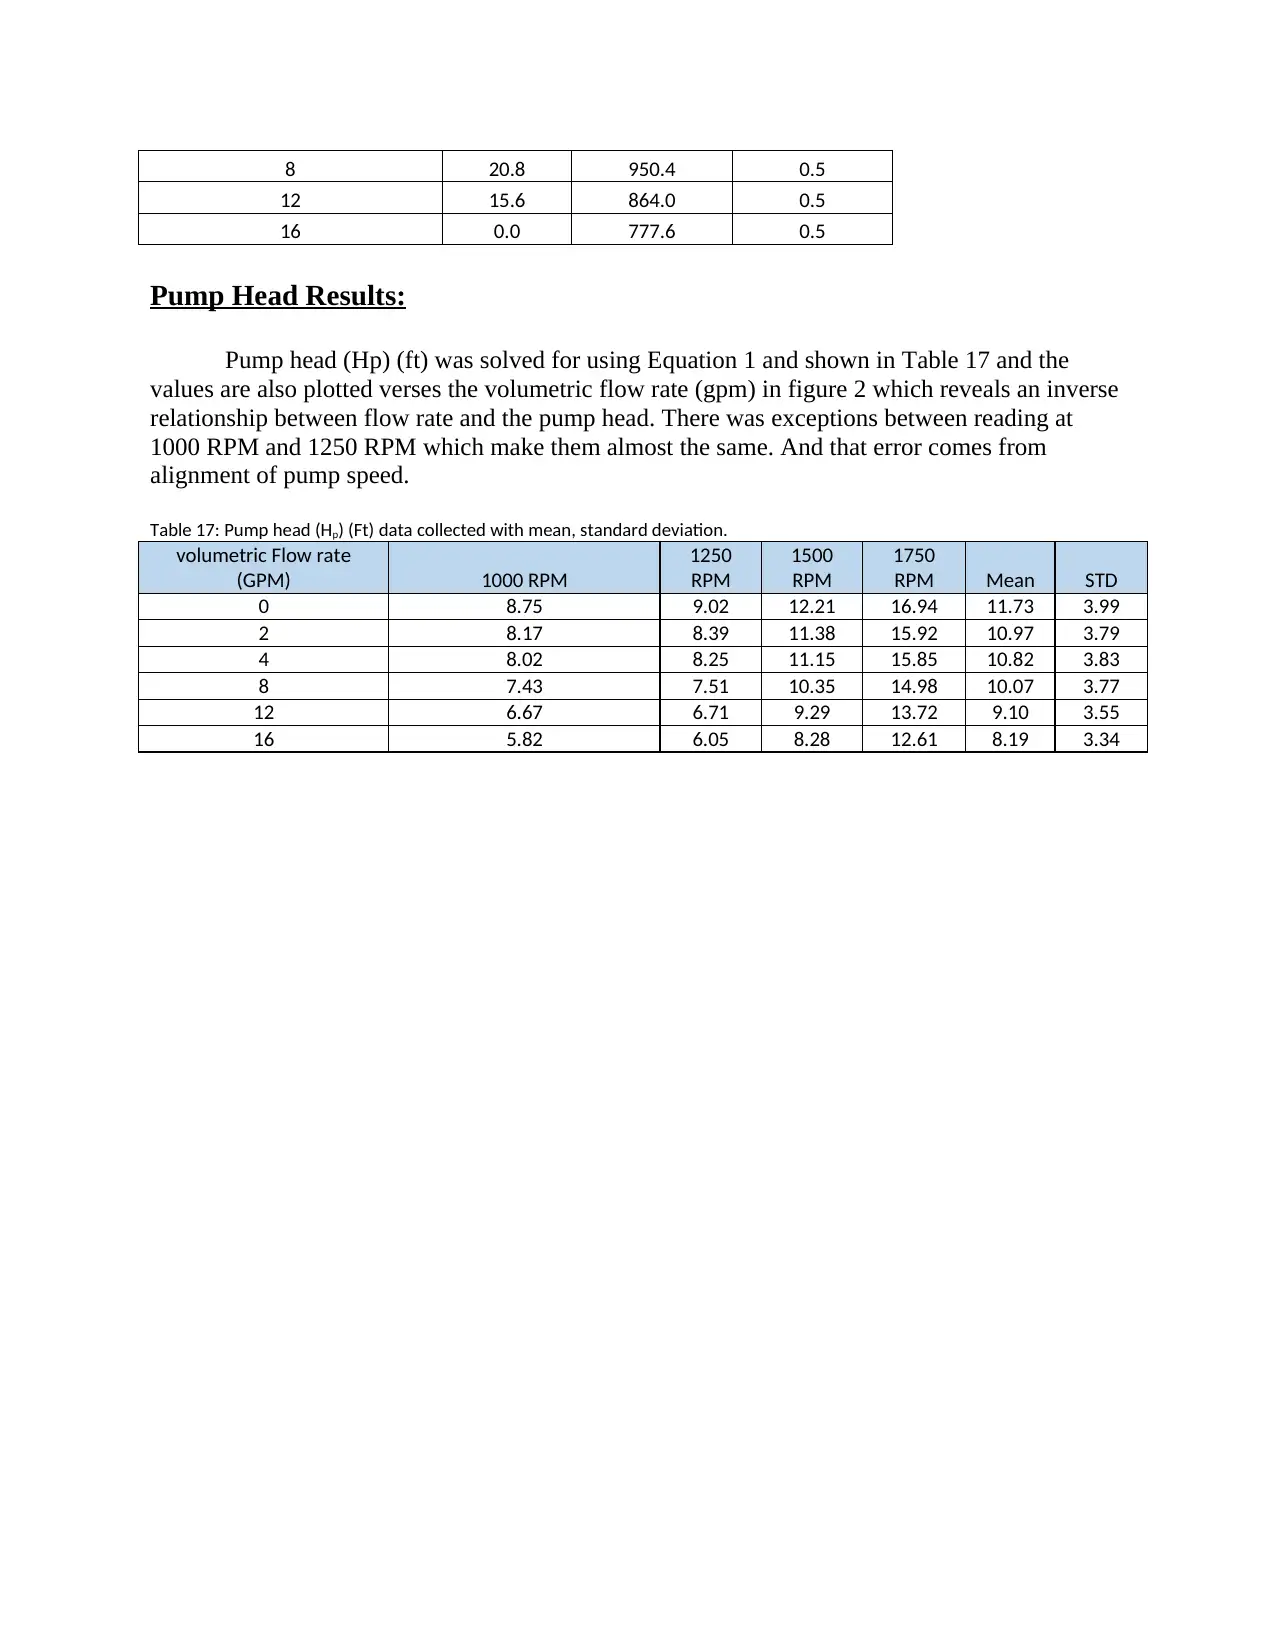
Pump Head Results:
Pump head (Hp) (ft) was solved for using Equation 1 and shown in Table 17 and the
values are also plotted verses the volumetric flow rate (gpm) in figure 2 which reveals an inverse
relationship between flow rate and the pump head. There was exceptions between reading at
1000 RPM and 1250 RPM which make them almost the same. And that error comes from
alignment of pump speed.
Table 17: Pump head (Hp) (Ft) data collected with mean, standard deviation.
volumetric Flow rate
(GPM) 1000 RPM
1250
RPM
1500
RPM
1750
RPM Mean STD
0 8.75 9.02 12.21 16.94 11.73 3.99
2 8.17 8.39 11.38 15.92 10.97 3.79
4 8.02 8.25 11.15 15.85 10.82 3.83
8 7.43 7.51 10.35 14.98 10.07 3.77
12 6.67 6.71 9.29 13.72 9.10 3.55
16 5.82 6.05 8.28 12.61 8.19 3.34
12 15.6 864.0 0.5
16 0.0 777.6 0.5
Pump Head Results:
Pump head (Hp) (ft) was solved for using Equation 1 and shown in Table 17 and the
values are also plotted verses the volumetric flow rate (gpm) in figure 2 which reveals an inverse
relationship between flow rate and the pump head. There was exceptions between reading at
1000 RPM and 1250 RPM which make them almost the same. And that error comes from
alignment of pump speed.
Table 17: Pump head (Hp) (Ft) data collected with mean, standard deviation.
volumetric Flow rate
(GPM) 1000 RPM
1250
RPM
1500
RPM
1750
RPM Mean STD
0 8.75 9.02 12.21 16.94 11.73 3.99
2 8.17 8.39 11.38 15.92 10.97 3.79
4 8.02 8.25 11.15 15.85 10.82 3.83
8 7.43 7.51 10.35 14.98 10.07 3.77
12 6.67 6.71 9.29 13.72 9.10 3.55
16 5.82 6.05 8.28 12.61 8.19 3.34

0 2 4 6 8 10 12 14 16 18
0
2
4
6
8
10
12
14
16
18
Pump Head VS volumetric Flow rate (GPM)
1750 rpm
1500 rpm
1250 RPM
1000 RPM
volumetric Flow rate (GPM)
Hp (ft)
Figure 2 above the average pump head over three weeks verses the volumetric flow rate (gpm) at each pump speed.
Pump Efficiency:
The pump efficiency was then calculated and shown in Table 18. Figure 3 graphically
represents the direct relation between these values and volumetric flow rate (gpm).
Table 18: Pump efficiency in (%) that data collected with mean, standard deviation.
Efficienc
y 1000
RPM
volumetric Flow
rate (GPM)
volumetric
Flow rate
(Lbf/min) Week #1
Week
#2 Week #3 Mean STD
0 0 #DIV/0!
#DIV/
0! #DIV/0! #DIV/0! #DIV/0!
2 16.66 9.295 8.986 8.493 8.925 0.405
4 33.32 16.900 16.947 15.609 16.485 0.759
8 66.64 34.243 30.556 27.602 30.800 3.327
12 99.96 38.461 39.943 35.097 37.834 2.483
16 133.28 42.725 41.622 36.985 40.444 3.046
⊘ This is a preview!⊘
Do you want full access?
Subscribe today to unlock all pages.
Trusted by 1+ million students worldwide
1 out of 19


Your All-in-One AI-Powered Toolkit for Academic Success.
+13062052269
info@desklib.com
Available 24*7 on WhatsApp / Email
![[object Object]](/_next/static/media/star-bottom.7253800d.svg)
Unlock your academic potential
Copyright © 2020–2026 A2Z Services. All Rights Reserved. Developed and managed by ZUCOL.