Financial Analysis: CFFA, Perpetuity Valuation & PE Ratio Report
VerifiedAdded on  2022/11/14
|8
|983
|66
Report
AI Summary
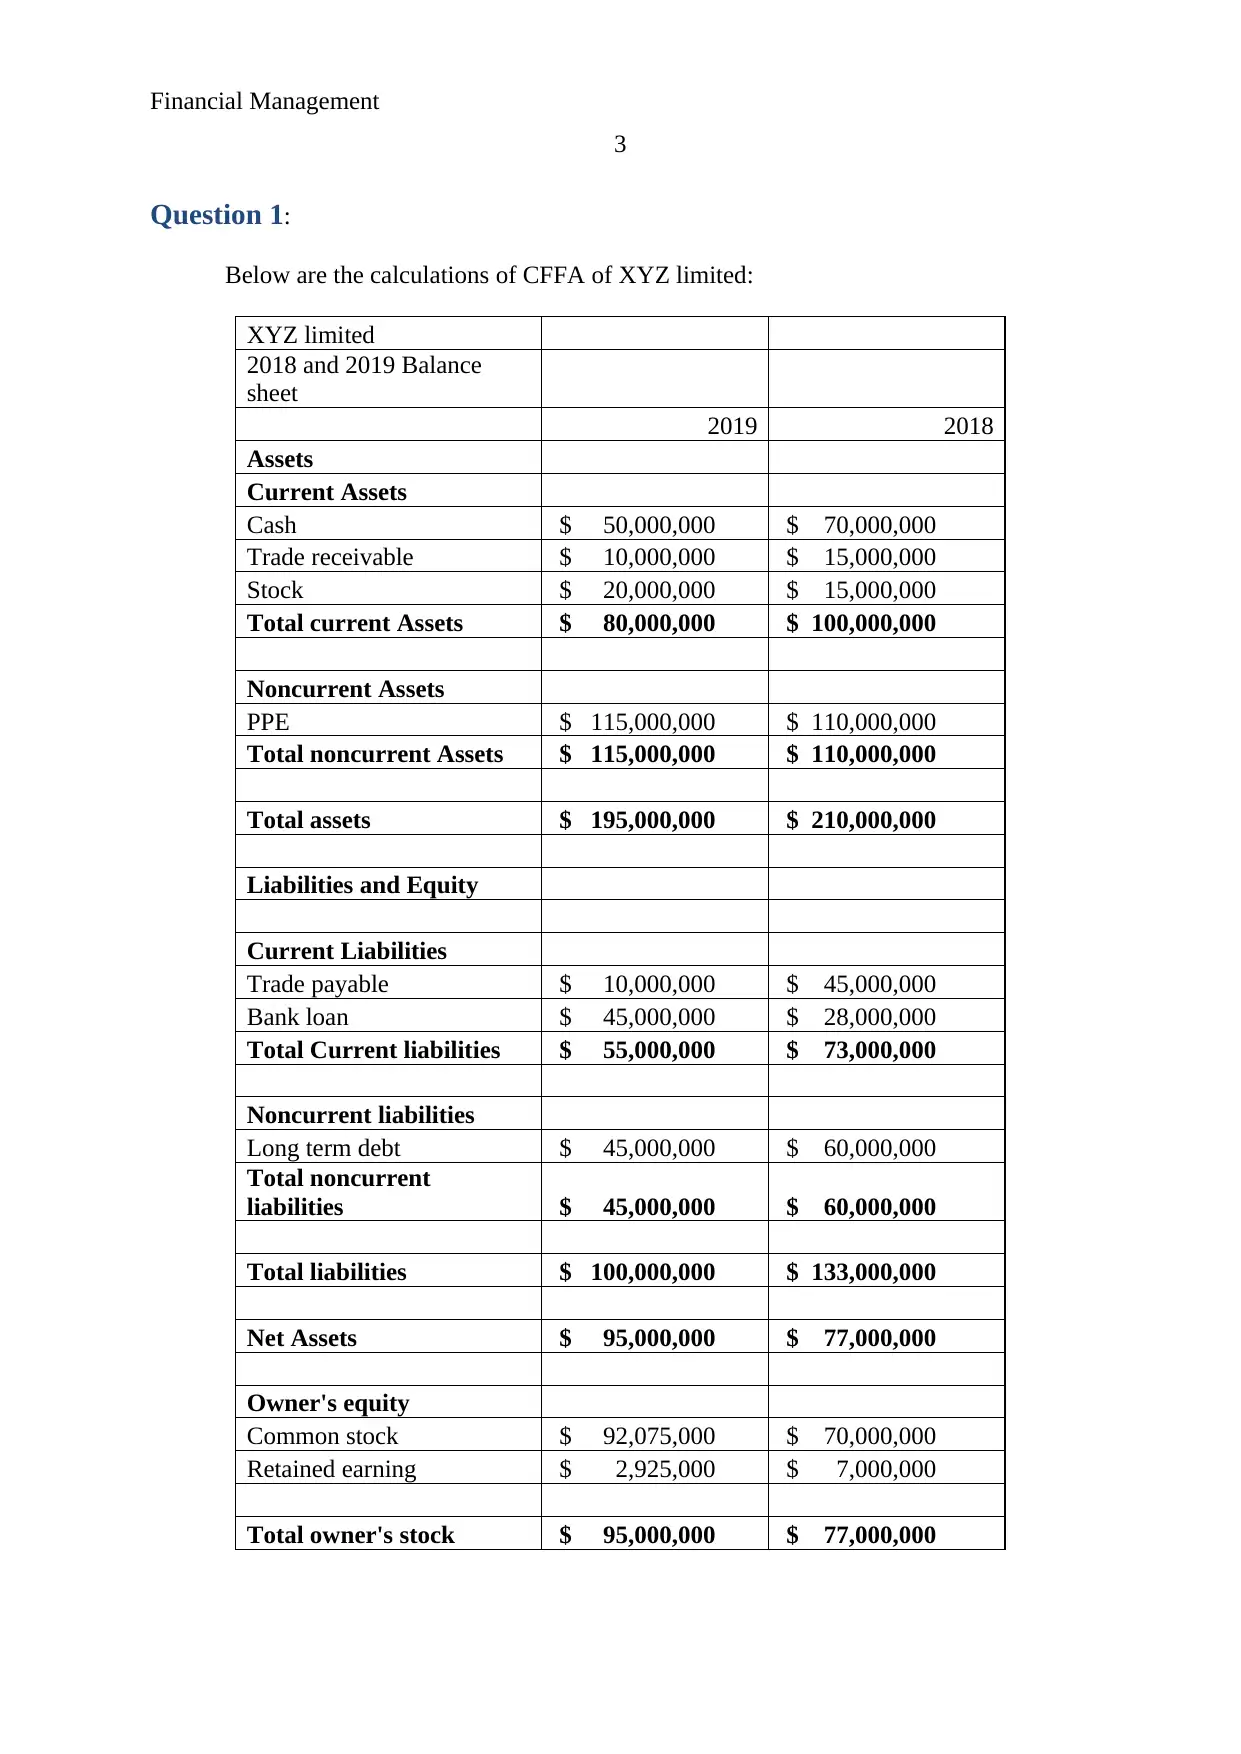
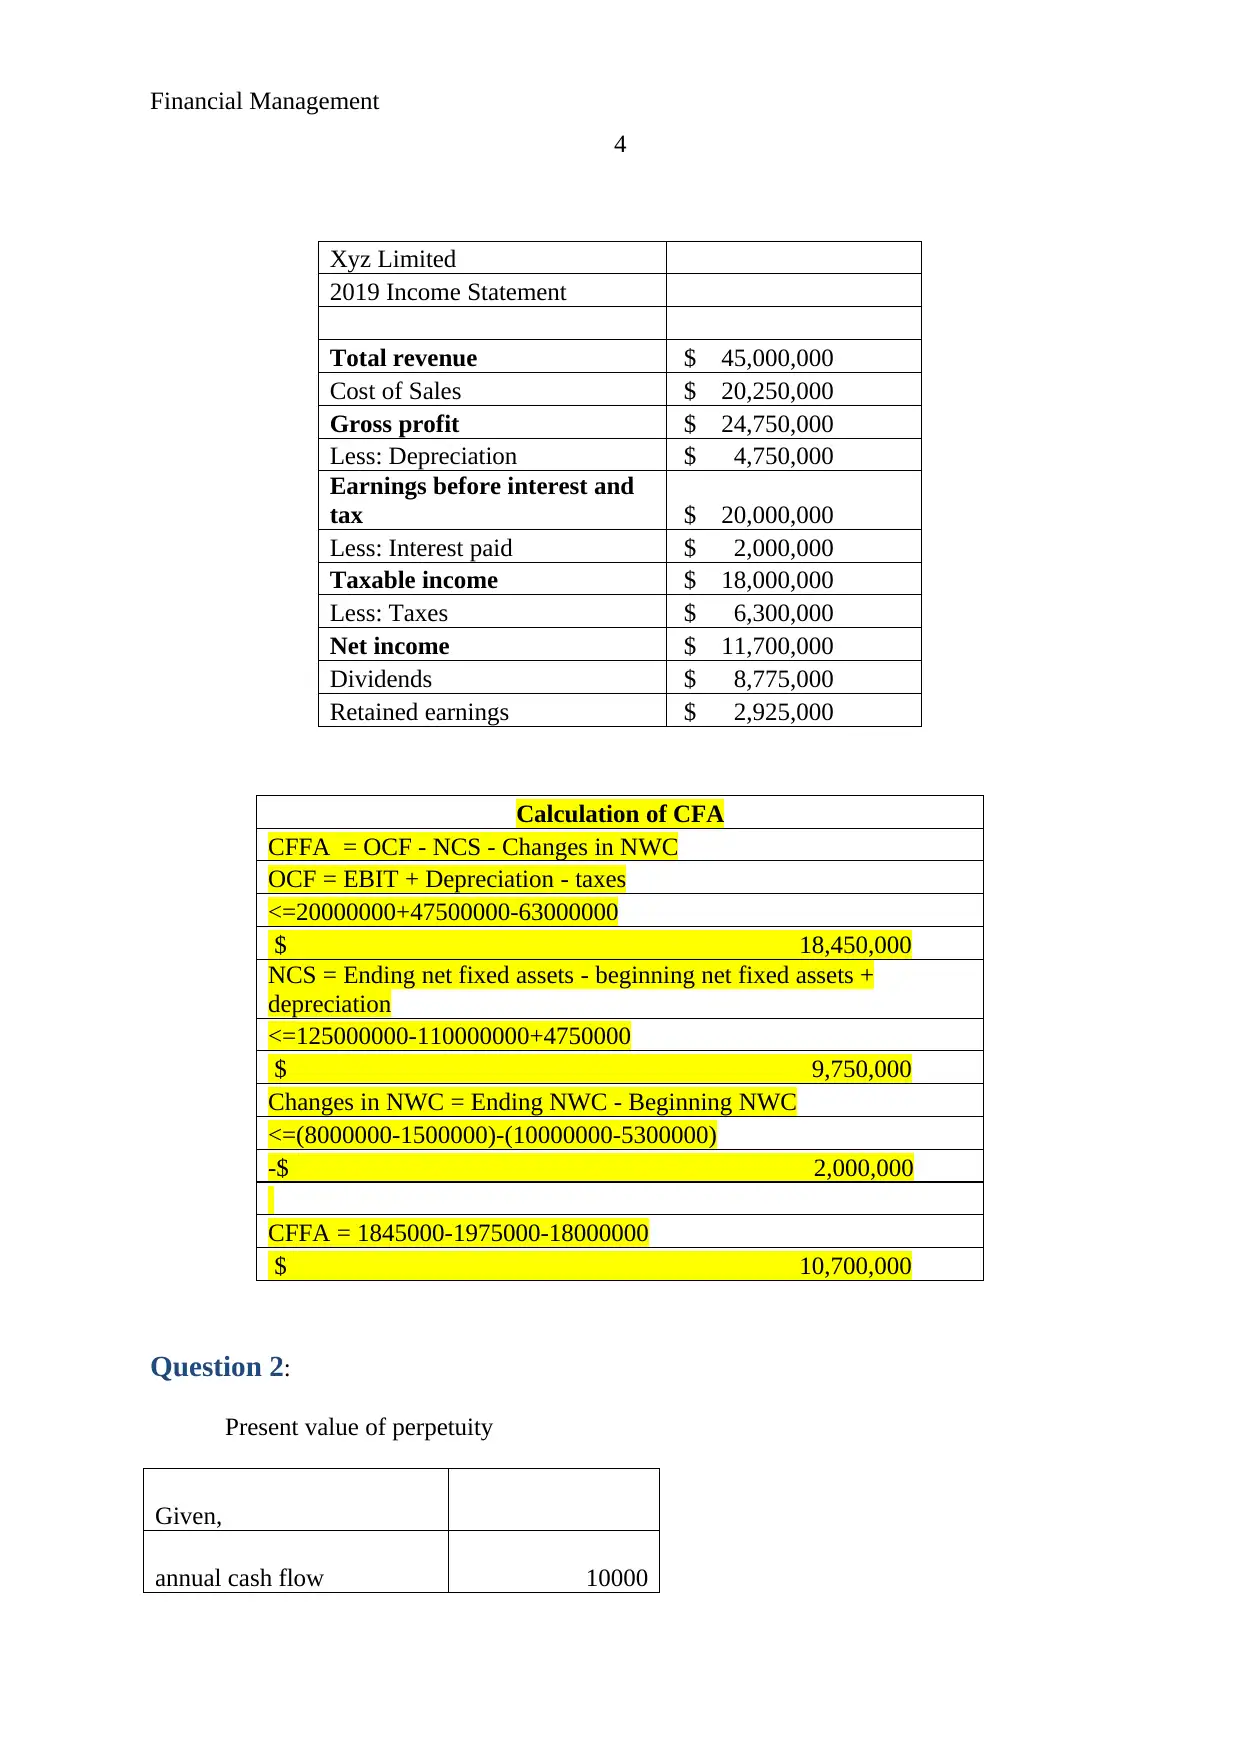
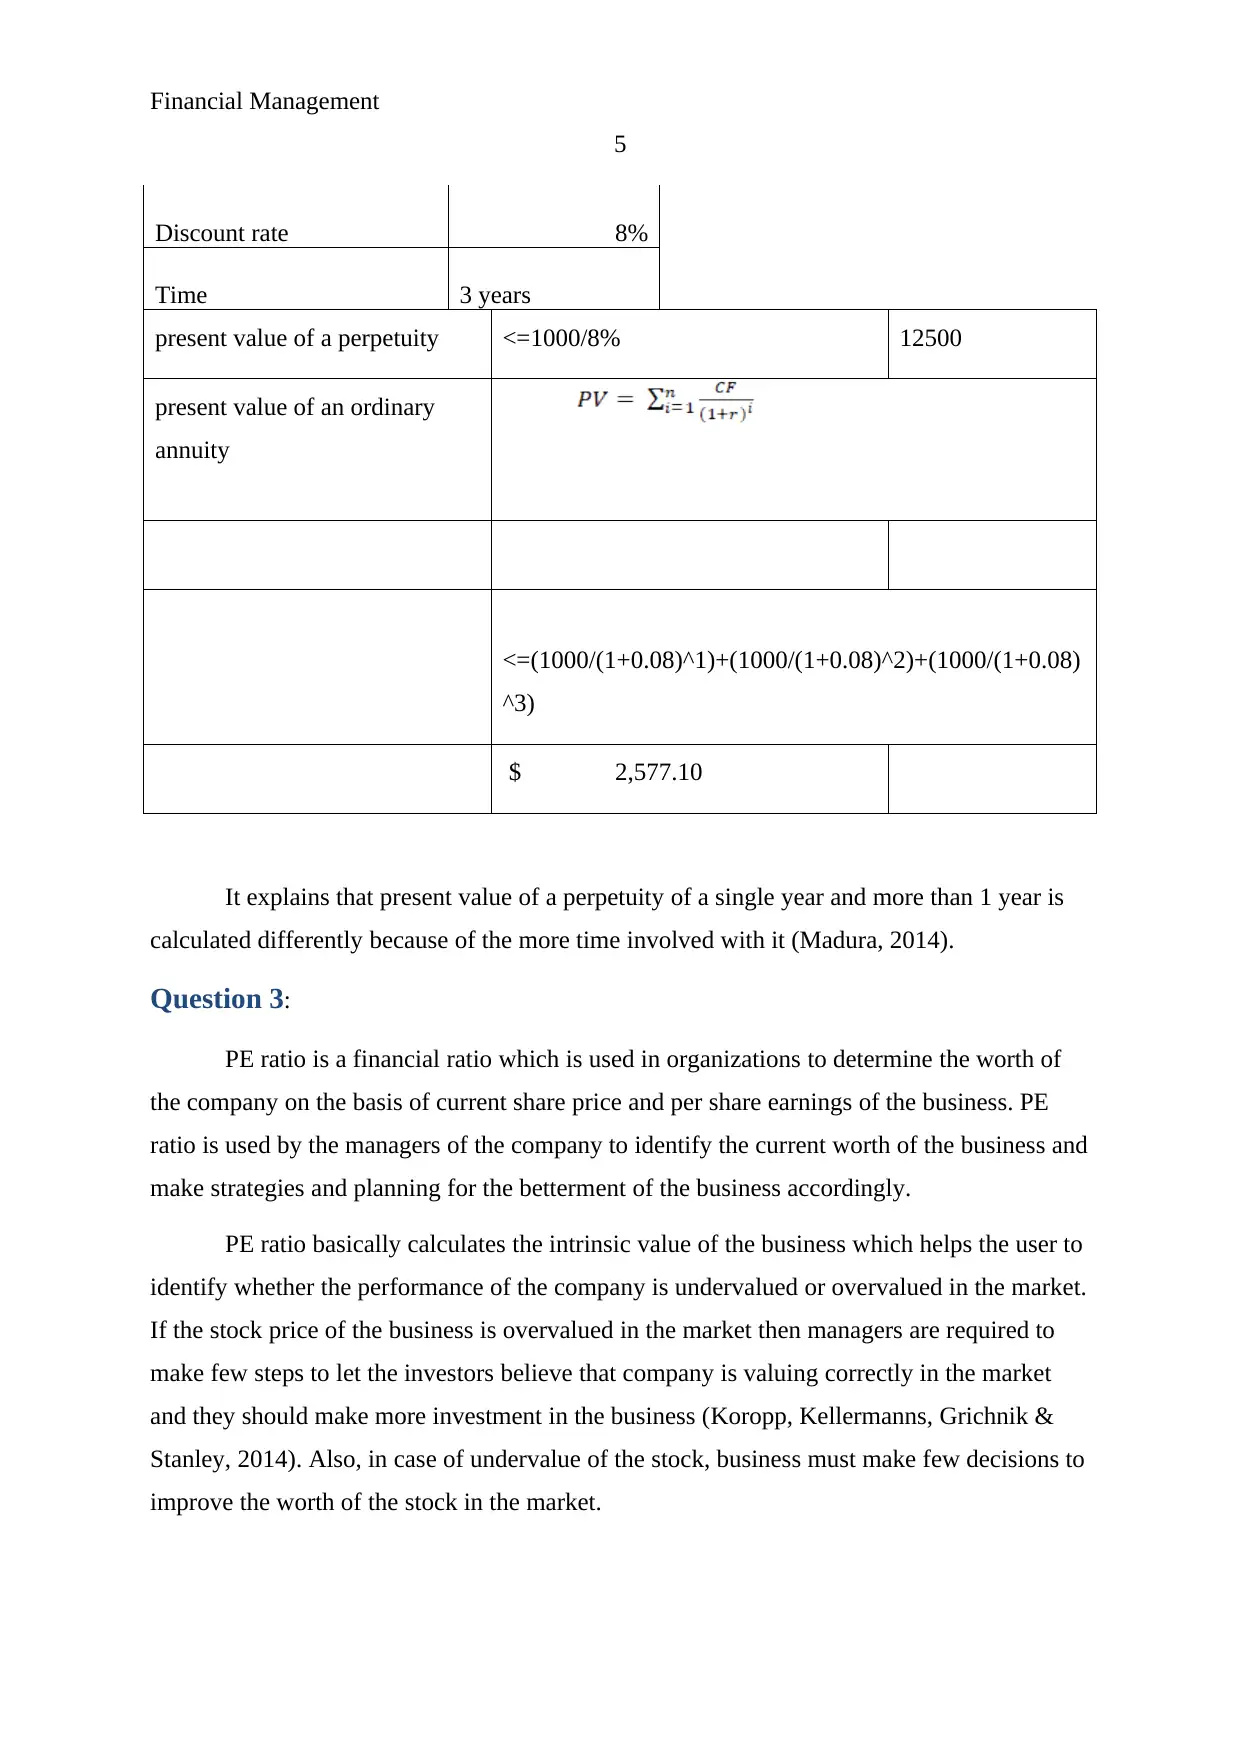
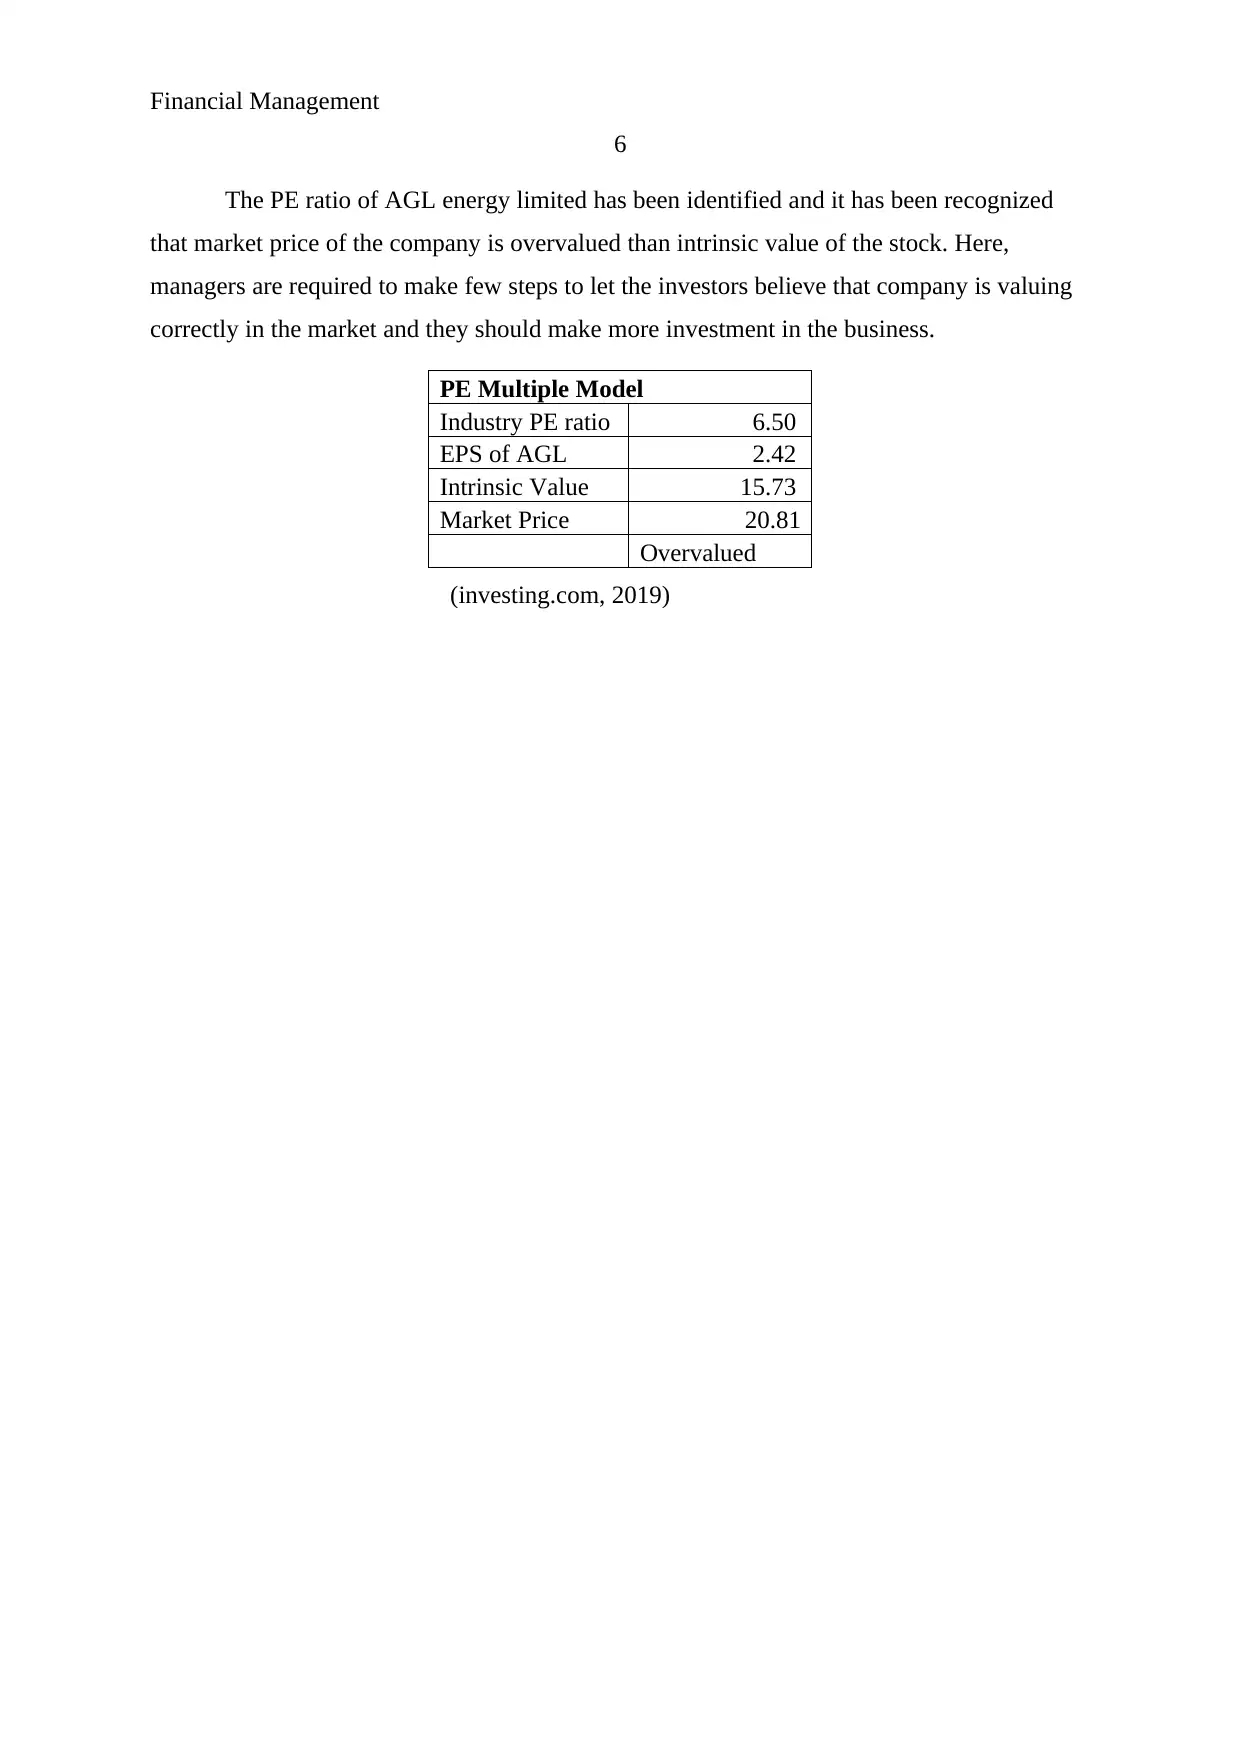
This report provides a detailed analysis of financial management concepts, focusing on Cash Flow From Assets (CFFA), perpetuity valuation, and Price-to-Earnings (PE) ratio. It includes the calculation of CFFA for XYZ Limited using balance sheet and income statement data, followed by an explanation of present value of perpetuity with an example. The report also discusses the significance of PE ratio in determining a company's worth, particularly in the context of AGL Energy Limited, where the market price is compared to the intrinsic value, alongside recommendations for managers to address overvaluation. Desklib offers a variety of study resources, including past papers and solved assignments, to support students in mastering complex financial topics.

Running Head: Financial Management
1
Project Report: Financial Management
1
Project Report: Financial Management
Paraphrase This Document
Need a fresh take? Get an instant paraphrase of this document with our AI Paraphraser

Financial Management
2
Contents
Question 1.........................................................................................................................3
Question 2.........................................................................................................................4
Question 3.........................................................................................................................5
References.........................................................................................................................7

Financial Management
3
Question 1:
Below are the calculations of CFFA of XYZ limited:
XYZ limited
2018 and 2019 Balance
sheet
2019 2018
Assets
Current Assets
Cash $ 50,000,000 $ 70,000,000
Trade receivable $ 10,000,000 $ 15,000,000
Stock $ 20,000,000 $ 15,000,000
Total current Assets $ 80,000,000 $ 100,000,000
Noncurrent Assets
PPE $ 115,000,000 $ 110,000,000
Total noncurrent Assets $ 115,000,000 $ 110,000,000
Total assets $ 195,000,000 $ 210,000,000
Liabilities and Equity
Current Liabilities
Trade payable $ 10,000,000 $ 45,000,000
Bank loan $ 45,000,000 $ 28,000,000
Total Current liabilities $ 55,000,000 $ 73,000,000
Noncurrent liabilities
Long term debt $ 45,000,000 $ 60,000,000
Total noncurrent
liabilities $ 45,000,000 $ 60,000,000
Total liabilities $ 100,000,000 $ 133,000,000
Net Assets $ 95,000,000 $ 77,000,000
Owner's equity
Common stock $ 92,075,000 $ 70,000,000
Retained earning $ 2,925,000 $ 7,000,000
Total owner's stock $ 95,000,000 $ 77,000,000
⊘ This is a preview!⊘
Do you want full access?
Subscribe today to unlock all pages.

Trusted by 1+ million students worldwide

Financial Management
4
Xyz Limited
2019 Income Statement
Total revenue $ 45,000,000
Cost of Sales $ 20,250,000
Gross profit $ 24,750,000
Less: Depreciation $ 4,750,000
Earnings before interest and
tax $ 20,000,000
Less: Interest paid $ 2,000,000
Taxable income $ 18,000,000
Less: Taxes $ 6,300,000
Net income $ 11,700,000
Dividends $ 8,775,000
Retained earnings $ 2,925,000
Calculation of CFA
CFFA = OCF - NCS - Changes in NWC
OCF = EBIT + Depreciation - taxes
<=20000000+47500000-63000000
$ 18,450,000
NCS = Ending net fixed assets - beginning net fixed assets +
depreciation
<=125000000-110000000+4750000
$ 9,750,000
Changes in NWC = Ending NWC - Beginning NWC
<=(8000000-1500000)-(10000000-5300000)
-$ 2,000,000
CFFA = 1845000-1975000-18000000
$ 10,700,000
Question 2:
Present value of perpetuity
Given,
annual cash flow 10000
Paraphrase This Document
Need a fresh take? Get an instant paraphrase of this document with our AI Paraphraser

Financial Management
5
Discount rate 8%
Time 3 years
present value of a perpetuity <=1000/8% 12500
present value of an ordinary
annuity
<=(1000/(1+0.08)^1)+(1000/(1+0.08)^2)+(1000/(1+0.08)
^3)
$ 2,577.10
It explains that present value of a perpetuity of a single year and more than 1 year is
calculated differently because of the more time involved with it (Madura, 2014).
Question 3:
PE ratio is a financial ratio which is used in organizations to determine the worth of
the company on the basis of current share price and per share earnings of the business. PE
ratio is used by the managers of the company to identify the current worth of the business and
make strategies and planning for the betterment of the business accordingly.
PE ratio basically calculates the intrinsic value of the business which helps the user to
identify whether the performance of the company is undervalued or overvalued in the market.
If the stock price of the business is overvalued in the market then managers are required to
make few steps to let the investors believe that company is valuing correctly in the market
and they should make more investment in the business (Koropp, Kellermanns, Grichnik &
Stanley, 2014). Also, in case of undervalue of the stock, business must make few decisions to
improve the worth of the stock in the market.

Financial Management
6
The PE ratio of AGL energy limited has been identified and it has been recognized
that market price of the company is overvalued than intrinsic value of the stock. Here,
managers are required to make few steps to let the investors believe that company is valuing
correctly in the market and they should make more investment in the business.
PE Multiple Model
Industry PE ratio 6.50
EPS of AGL 2.42
Intrinsic Value 15.73
Market Price 20.81
Overvalued
(investing.com, 2019)
⊘ This is a preview!⊘
Do you want full access?
Subscribe today to unlock all pages.

Trusted by 1+ million students worldwide

Financial Management
7
References:
Invetsing.com. (2019). AGL energy. [online]. Retrieved from:
https://www.investing.com/equities/agl-energy
Koropp, C., Kellermanns, F. W., Grichnik, D., & Stanley, L. (2014). Financial decision
making in family firms: An adaptation of the theory of planned behavior. Family
Business Review, 27(4), 307-327.
Madura, J. (2014). Financial Markets & Institutions. US: Cengage Learning.
Paraphrase This Document
Need a fresh take? Get an instant paraphrase of this document with our AI Paraphraser

Financial Management
8
8
1 out of 8
Related Documents

Your All-in-One AI-Powered Toolkit for Academic Success.
 +13062052269
info@desklib.com
Available 24*7 on WhatsApp / Email
Unlock your academic potential
Copyright © 2020–2025 A2Z Services. All Rights Reserved. Developed and managed by ZUCOL.