Accounting for Business: Challenger Ltd Financial Statement Analysis
VerifiedAdded on 2021/05/31
|15
|2510
|18
Report
AI Summary
This report provides a comprehensive financial analysis of Challenger Ltd, focusing on its performance evaluation through ratio analysis. The assignment computes and analyzes key financial ratios such as current ratio, quick ratio, net profit margin, return on equity, and return on assets for Challenger Ltd. Furthermore, the report conducts a comparative study, benchmarking Challenger Ltd against BBVA Group and Alliance Trust, both operating within the same industry. The analysis covers data from 2016 and 2017, highlighting the company's liquidity, profitability, and efficiency, and provides insights into its financial strengths and weaknesses relative to its competitors. The report concludes with a discussion on the implications of these findings and offers a comparative perspective on the financial health of the three companies, drawing conclusions based on the computed ratios and their trends.
Running head: ACCOUNTING FOR BUSINESS
ACCOUNTING FOR BUSINESS
Name of the Student:
Name of the University:
Student ID:
Company’s Name:
Author’s Note:
ACCOUNTING FOR BUSINESS
Name of the Student:
Name of the University:
Student ID:
Company’s Name:
Author’s Note:
Paraphrase This Document
Need a fresh take? Get an instant paraphrase of this document with our AI Paraphraser
1
ACCOUNTING FOR BUSINESS
Executive Summary
The main purpose of this assignment is to analyze the financial statement of Challenger ltd and
also comment on the performance of the business. The assignment will be computing significant
ratio which are related to the performance of the business and analyze the same. The assignment
will also be comparing the different ratios which are computed for measuring the performance of
the business with other companies which belong to the same industry. The companies which are
selected for the purpose of comparison are BBVA Group and Alliance Trust ltd.
2
ACCOUNTING FOR BUSINESS
Table of Contents
1. Introduction..............................................................................................................................3
1.1 Purpose..............................................................................................................................3
1.2 Scope.................................................................................................................................3
1.3 Limitation..........................................................................................................................3
2.0 Company Overview...................................................................................................................3
3.0 Ratio Analysis............................................................................................................................4
3.1 Current Ratio.........................................................................................................................5
3.2 Quick Ratio............................................................................................................................6
3.3 Net Profit Margin...................................................................................................................6
3.4 Return on Equity....................................................................................................................7
3.5 Return on Assets....................................................................................................................7
Analysis and Comparison between Challenger ltd, BBVA Group and Alliance Trust...................8
Reference.......................................................................................................................................10
Appendix........................................................................................................................................12
⊘ This is a preview!⊘
Do you want full access?
Subscribe today to unlock all pages.
Trusted by 1+ million students worldwide
3
ACCOUNTING FOR BUSINESS
1. Introduction
1.1 Purpose
The main purpose of the assignment is to analyze the financial reports of Challenger ltd for
the purpose of evaluating financial performance of the company. In addition to this, the
assignment will be containing ratio which are to be computed and then analysis the performance
of the company in comparison with other similar companies belonging to similar industry (Luo
et al., 2015).
1.2 Scope
The scope of this assignment is compute the key financial ratios which are associated with
the business. The ratios which are computed have some significance and are considered to be
financial indicators of performance in a business. The assignment will be conducting a
comparative study between Challenger ltd and BBVA Group ltd and Alliance Trust which
operates in the same industry as Challenger ltd.
1.3 Limitation
The limitation which the assignment faces is that the ratio which are considered for this
assignment are limited for comparison purposes and it makes the scope of the assignment a bit
narrow. The ratios which are computed is for the last two years for which the analysis is to b e
undertaken.
2.0 Company Overview
Challenger ltd is a company which operates in Australia and is engaged in managing
investments for its customers. The company has its headquarters in Sydney, Australia. In other
Paraphrase This Document
Need a fresh take? Get an instant paraphrase of this document with our AI Paraphraser
4
ACCOUNTING FOR BUSINESS
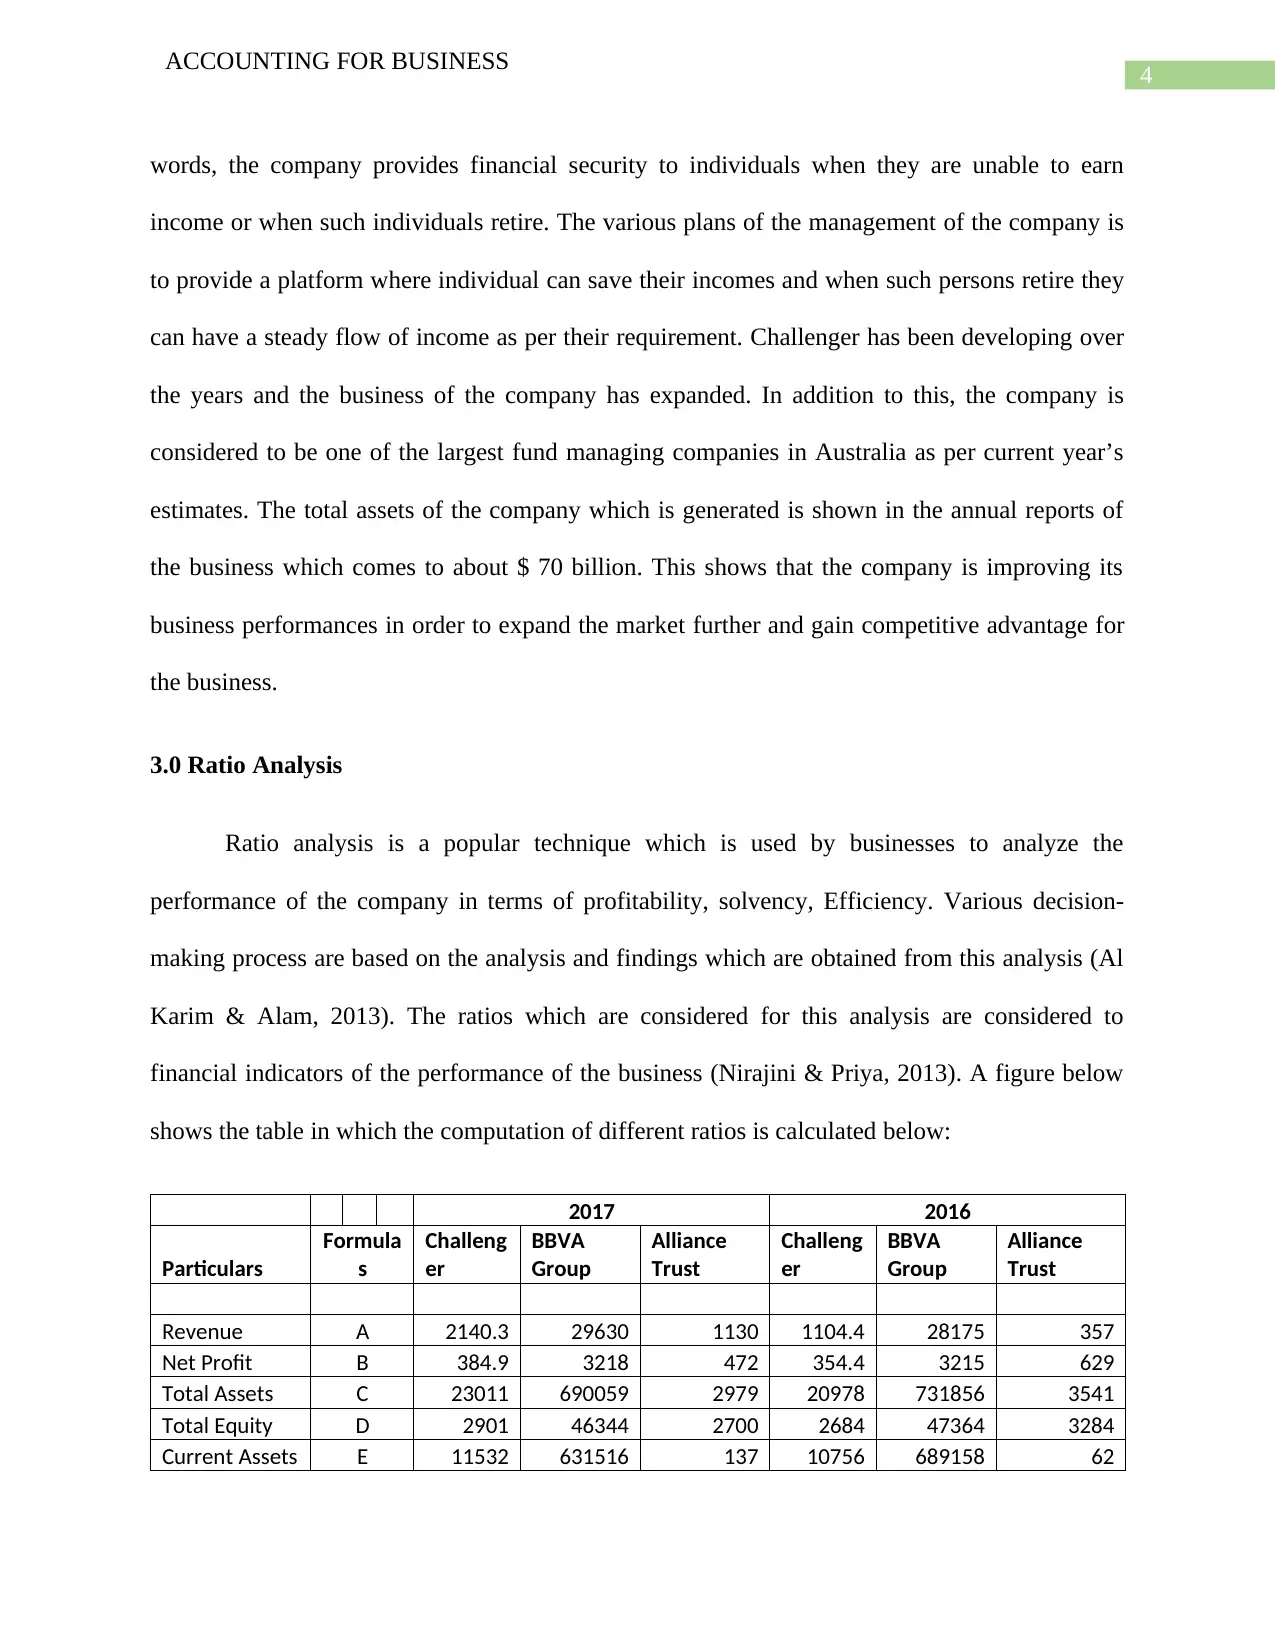
words, the company provides financial security to individuals when they are unable to earn
income or when such individuals retire. The various plans of the management of the company is
to provide a platform where individual can save their incomes and when such persons retire they
can have a steady flow of income as per their requirement. Challenger has been developing over
the years and the business of the company has expanded. In addition to this, the company is
considered to be one of the largest fund managing companies in Australia as per current year’s
estimates. The total assets of the company which is generated is shown in the annual reports of
the business which comes to about $ 70 billion. This shows that the company is improving its
business performances in order to expand the market further and gain competitive advantage for
the business.
3.0 Ratio Analysis
Ratio analysis is a popular technique which is used by businesses to analyze the
performance of the company in terms of profitability, solvency, Efficiency. Various decision-
making process are based on the analysis and findings which are obtained from this analysis (Al
Karim & Alam, 2013). The ratios which are considered for this analysis are considered to
financial indicators of the performance of the business (Nirajini & Priya, 2013). A figure below
shows the table in which the computation of different ratios is calculated below:
2017 2016
Particulars
Formula
s
Challeng
er
BBVA
Group
Alliance
Trust
Challeng
er
BBVA
Group
Alliance
Trust
Revenue A 2140.3 29630 1130 1104.4 28175 357
Net Profit B 384.9 3218 472 354.4 3215 629
Total Assets C 23011 690059 2979 20978 731856 3541
Total Equity D 2901 46344 2700 2684 47364 3284
Current Assets E 11532 631516 137 10756 689158 62
ACCOUNTING FOR BUSINESS
words, the company provides financial security to individuals when they are unable to earn
income or when such individuals retire. The various plans of the management of the company is
to provide a platform where individual can save their incomes and when such persons retire they
can have a steady flow of income as per their requirement. Challenger has been developing over
the years and the business of the company has expanded. In addition to this, the company is
considered to be one of the largest fund managing companies in Australia as per current year’s
estimates. The total assets of the company which is generated is shown in the annual reports of
the business which comes to about $ 70 billion. This shows that the company is improving its
business performances in order to expand the market further and gain competitive advantage for
the business.
3.0 Ratio Analysis
Ratio analysis is a popular technique which is used by businesses to analyze the
performance of the company in terms of profitability, solvency, Efficiency. Various decision-
making process are based on the analysis and findings which are obtained from this analysis (Al
Karim & Alam, 2013). The ratios which are considered for this analysis are considered to
financial indicators of the performance of the business (Nirajini & Priya, 2013). A figure below
shows the table in which the computation of different ratios is calculated below:
2017 2016
Particulars
Formula
s
Challeng
er
BBVA
Group
Alliance
Trust
Challeng
er
BBVA
Group
Alliance
Trust
Revenue A 2140.3 29630 1130 1104.4 28175 357
Net Profit B 384.9 3218 472 354.4 3215 629
Total Assets C 23011 690059 2979 20978 731856 3541
Total Equity D 2901 46344 2700 2684 47364 3284
Current Assets E 11532 631516 137 10756 689158 62
5
ACCOUNTING FOR BUSINESS
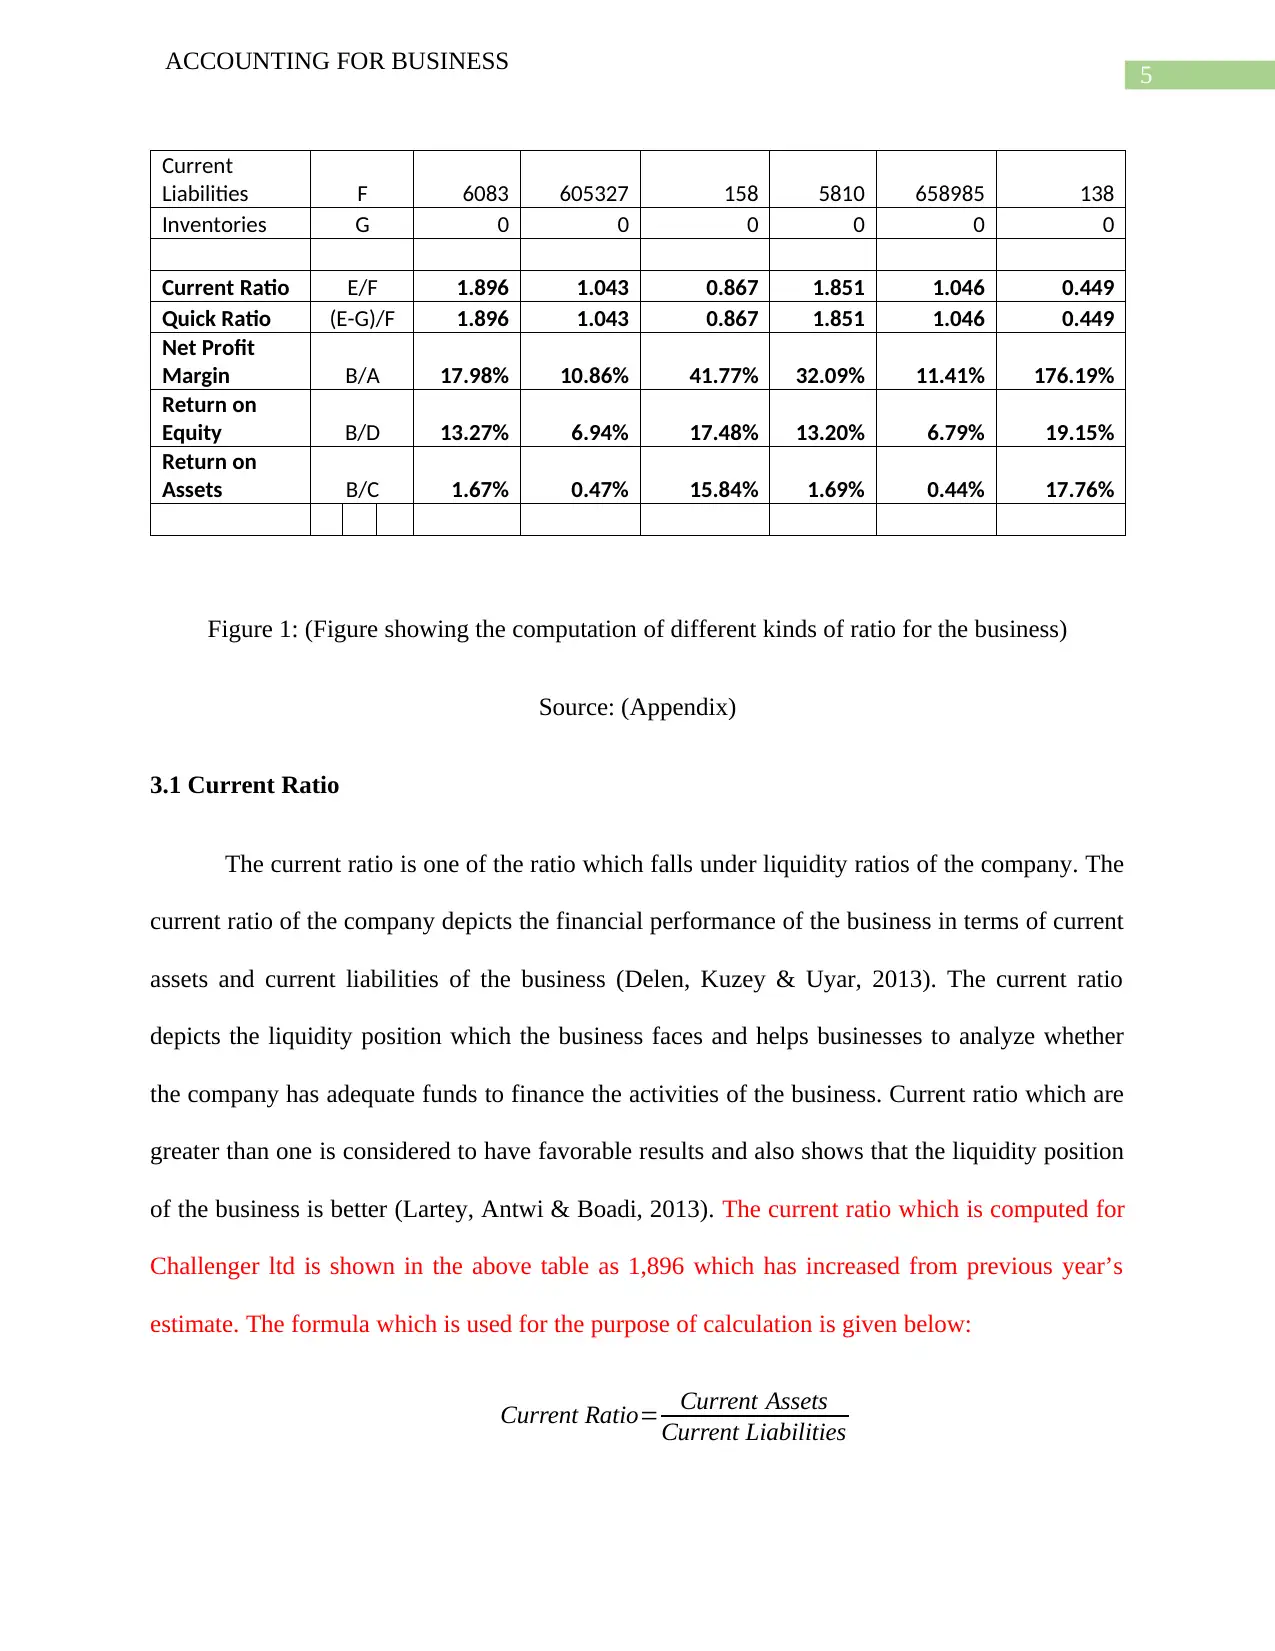
Current
Liabilities F 6083 605327 158 5810 658985 138
Inventories G 0 0 0 0 0 0
Current Ratio E/F 1.896 1.043 0.867 1.851 1.046 0.449
Quick Ratio (E-G)/F 1.896 1.043 0.867 1.851 1.046 0.449
Net Profit
Margin B/A 17.98% 10.86% 41.77% 32.09% 11.41% 176.19%
Return on
Equity B/D 13.27% 6.94% 17.48% 13.20% 6.79% 19.15%
Return on
Assets B/C 1.67% 0.47% 15.84% 1.69% 0.44% 17.76%
Figure 1: (Figure showing the computation of different kinds of ratio for the business)
Source: (Appendix)
3.1 Current Ratio
The current ratio is one of the ratio which falls under liquidity ratios of the company. The
current ratio of the company depicts the financial performance of the business in terms of current
assets and current liabilities of the business (Delen, Kuzey & Uyar, 2013). The current ratio
depicts the liquidity position which the business faces and helps businesses to analyze whether
the company has adequate funds to finance the activities of the business. Current ratio which are
greater than one is considered to have favorable results and also shows that the liquidity position
of the business is better (Lartey, Antwi & Boadi, 2013). The current ratio which is computed for
Challenger ltd is shown in the above table as 1,896 which has increased from previous year’s
estimate. The formula which is used for the purpose of calculation is given below:
Current Ratio= Current Assets
Current Liabilities
ACCOUNTING FOR BUSINESS
Current
Liabilities F 6083 605327 158 5810 658985 138
Inventories G 0 0 0 0 0 0
Current Ratio E/F 1.896 1.043 0.867 1.851 1.046 0.449
Quick Ratio (E-G)/F 1.896 1.043 0.867 1.851 1.046 0.449
Net Profit
Margin B/A 17.98% 10.86% 41.77% 32.09% 11.41% 176.19%
Return on
Equity B/D 13.27% 6.94% 17.48% 13.20% 6.79% 19.15%
Return on
Assets B/C 1.67% 0.47% 15.84% 1.69% 0.44% 17.76%
Figure 1: (Figure showing the computation of different kinds of ratio for the business)
Source: (Appendix)
3.1 Current Ratio
The current ratio is one of the ratio which falls under liquidity ratios of the company. The
current ratio of the company depicts the financial performance of the business in terms of current
assets and current liabilities of the business (Delen, Kuzey & Uyar, 2013). The current ratio
depicts the liquidity position which the business faces and helps businesses to analyze whether
the company has adequate funds to finance the activities of the business. Current ratio which are
greater than one is considered to have favorable results and also shows that the liquidity position
of the business is better (Lartey, Antwi & Boadi, 2013). The current ratio which is computed for
Challenger ltd is shown in the above table as 1,896 which has increased from previous year’s
estimate. The formula which is used for the purpose of calculation is given below:
Current Ratio= Current Assets
Current Liabilities
⊘ This is a preview!⊘
Do you want full access?
Subscribe today to unlock all pages.
Trusted by 1+ million students worldwide
6
ACCOUNTING FOR BUSINESS
3.2 Quick Ratio
Quick ratio of a company also falls under the purview of liquidity ratio of the business.
This ratio is similar to current ratio which is computed by the company. The quick ratio
considers quick assets which are cash balance, debtors and similar other assets and quick
liabilities for the purpose of computation. The quick ratio of the business depicts the liquidity
position of the business as to whether the business is able to meet the short-term financing
requirements of the business or not. In other words, the ratio is a measure of the ability of the
company to meet its current short-term obligations. The quick ratio of Challenger ltd which is
shown in the above table comes to 1.896 which is same as the current ratio of the company. The
formula which is used for the purpose of calculation is shown below:
Quick Ratio= Current Assets−Inventories
Current Liabilities
3.3 Net Profit Margin
The net profit margin ratio shows the relationship between net profit which is generated
by the company and the sales revenue which is generated by the business. The main purpose of
the ratio is to analyze how much net profit can be earned for a particular level of sale (Rehman,
2013). This is considered to be an important ratio as it is an important financial indicator of the
performance of the business. The net profit margin for Challenger ltd which is shown in the table
above table which is 17.98% % which has significantly reduced from previous years estimate.
The formula which is used is given below:
Paraphrase This Document
Need a fresh take? Get an instant paraphrase of this document with our AI Paraphraser
7
ACCOUNTING FOR BUSINESS
Net Profit Margin= Net Profit
Revenue Generated
3.4 Return on Equity
The return on equity refers to the return which is expected by the shareholders as returns
they will be getting for the investments made by them. Return on Equity (ROE) is considered to
be one of the financial indicators which are used by potential investors for taking investment
decisions in the shares and securities of the company (Heikal et al., 2014). In addition to this, the
level of ROE is also a system which can display that the company is performing well. the return
of equity which is computed is shown in the table which is given above is 13.27 % which has
slightly fallen from the previous year’s estimate. The formula which is used is given below:
Return on Equity ( ROE ) = Net Profit
Total Shareholders Equity
3.5 Return on Assets
The return on assets ratio shows the relationship between total assets of the business with
the returns which are earned by the business. In other words, it shows the revenue which the
business can earn while employing the assets of the business (Baños-Caballero, García-Teruel &
Martínez-Solano, 2014). This is also noted by the potential stakeholders as such ratio provides
information about the different activities of the business. Return on assets ratio signifies whether
the assets which are possessed by the business are applied in a favorable manner or not. The
formula which is used is given below:
8
ACCOUNTING FOR BUSINESS
Returnon Assets ( ROA ) = Net Profit
Total Assets
Analysis and Comparison between Challenger ltd, BBVA Group and Alliance Trust
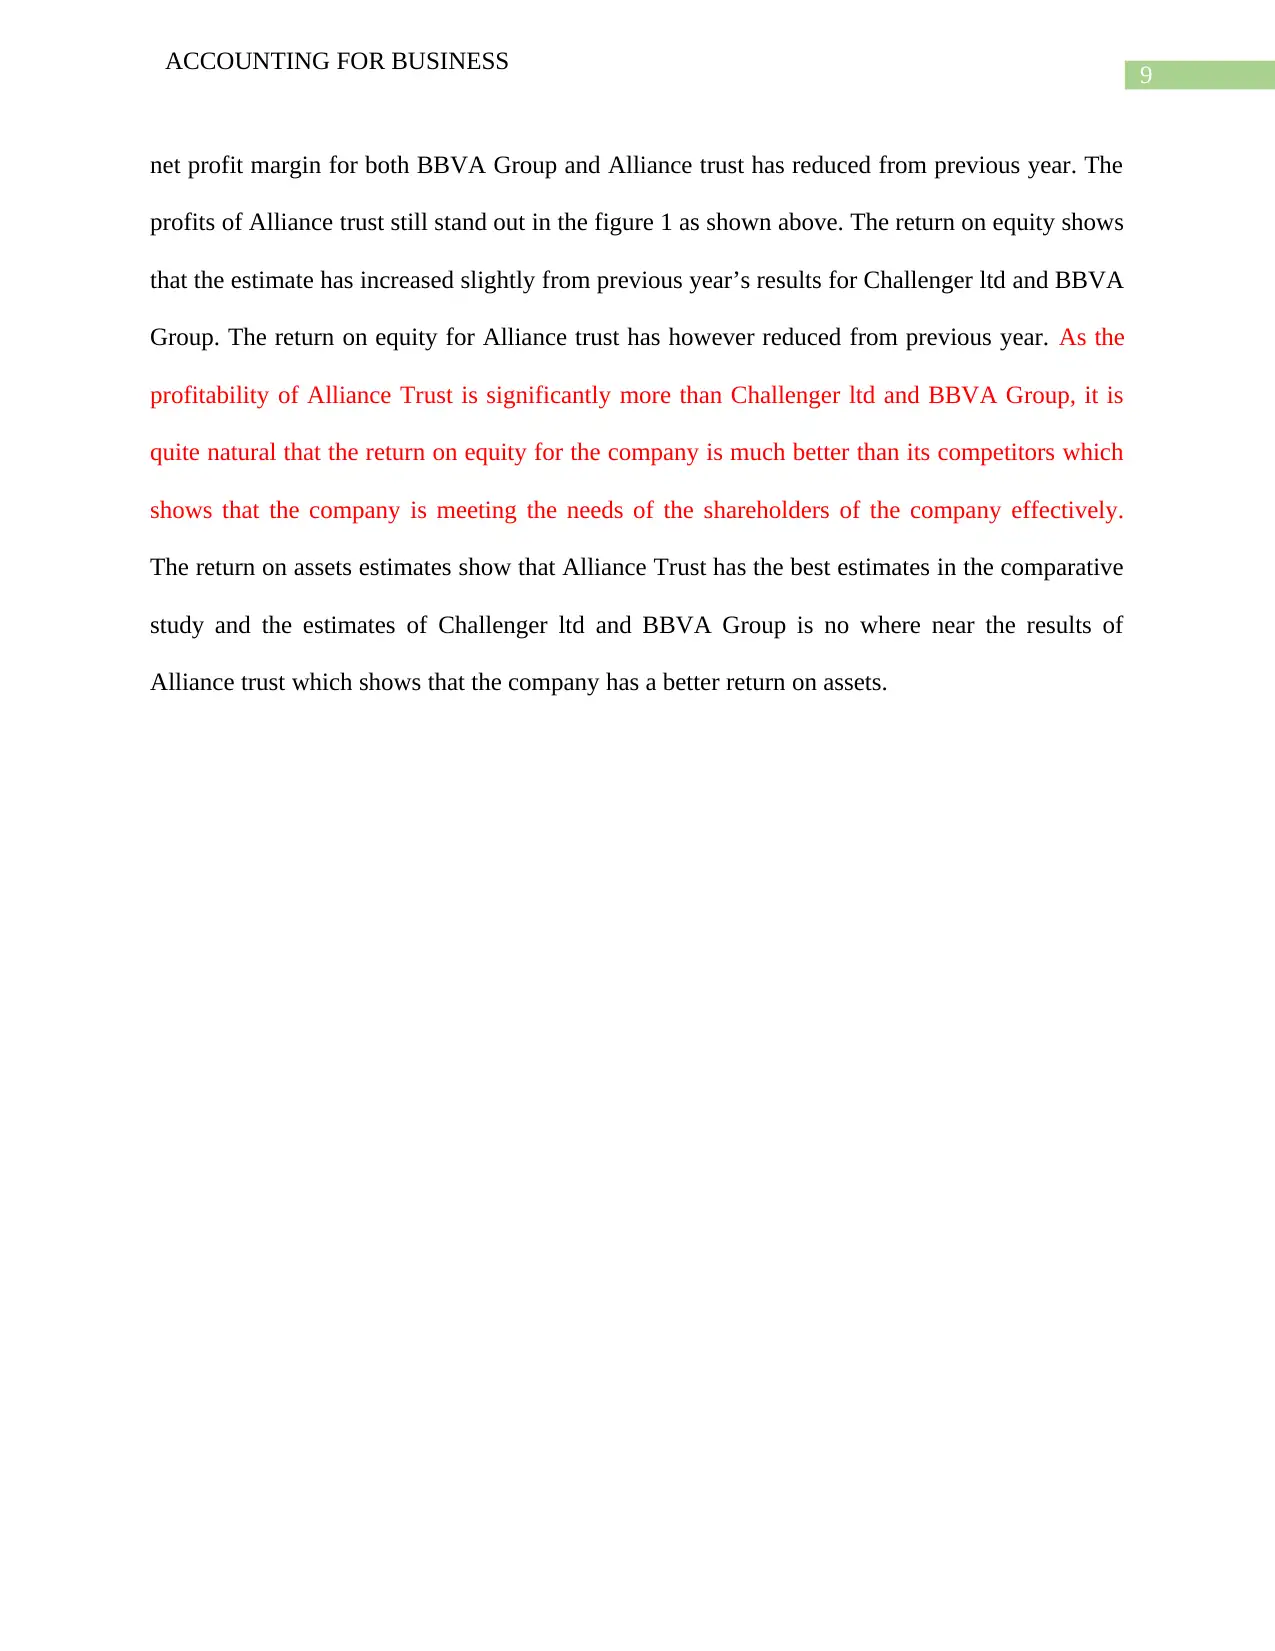
The companies which are selected for the purpose of conducting an analysis and
comparison with Challenger ltd are BBVA Group and Alliance Trust. As per figure 1, which
shows the significant ratios which are calculated for the analysis part for 2017 and 2016. The
current ratio as shown in figure 1, is much better of Challenger ltd than its rival companies which
suggest that the liquidity position of the company is secure and the company can effectively
finance any projects. The current ratio for the year 2017 for challengers ltd, BBVA Group and
Alliance Trust are computed to be 1.896, 1.043 and 0.876 respectively. The current ratio is most
adverse in case of Alliance trust which signifies that the company is facing certain liquidity
crisis. In comparison with 2016 estimates as calculated the current ratio has reduced slightly for
BBVA Group and slightly improved for Alliance trust as well as Challenger ltd. The quick ratio
of all three companies show similar results as current which suggest that the current ratio
estimates are also quick ratio estimates for all the three companies. This also suggested that all
the businesses does not have any inventories therefore the quick assets of the business does not
changes as current assets which are taken into consideration for calculation of quick assets does
not change. The net profit margin of Challenger ltd, BBVA Group and Alliance Trust for the
year 2017 show results as 17.98%, 10.86% and 41.77% respectively. The net profit margin of
Alliance Trust shows abnormal amounts of profits for both 2016 and 2017 which is more than
Challenger ltd and BBVA Group. The net profit margin of Challenger ltd has reduced from
previous year which was 32.8% which suggest that the cost which is associated with production
has increased and therefore the profits of the company has fallen (Ongore & Kusa, 2013). The
ACCOUNTING FOR BUSINESS
Returnon Assets ( ROA ) = Net Profit
Total Assets
Analysis and Comparison between Challenger ltd, BBVA Group and Alliance Trust
The companies which are selected for the purpose of conducting an analysis and
comparison with Challenger ltd are BBVA Group and Alliance Trust. As per figure 1, which
shows the significant ratios which are calculated for the analysis part for 2017 and 2016. The
current ratio as shown in figure 1, is much better of Challenger ltd than its rival companies which
suggest that the liquidity position of the company is secure and the company can effectively
finance any projects. The current ratio for the year 2017 for challengers ltd, BBVA Group and
Alliance Trust are computed to be 1.896, 1.043 and 0.876 respectively. The current ratio is most
adverse in case of Alliance trust which signifies that the company is facing certain liquidity
crisis. In comparison with 2016 estimates as calculated the current ratio has reduced slightly for
BBVA Group and slightly improved for Alliance trust as well as Challenger ltd. The quick ratio
of all three companies show similar results as current which suggest that the current ratio
estimates are also quick ratio estimates for all the three companies. This also suggested that all
the businesses does not have any inventories therefore the quick assets of the business does not
changes as current assets which are taken into consideration for calculation of quick assets does
not change. The net profit margin of Challenger ltd, BBVA Group and Alliance Trust for the
year 2017 show results as 17.98%, 10.86% and 41.77% respectively. The net profit margin of
Alliance Trust shows abnormal amounts of profits for both 2016 and 2017 which is more than
Challenger ltd and BBVA Group. The net profit margin of Challenger ltd has reduced from
previous year which was 32.8% which suggest that the cost which is associated with production
has increased and therefore the profits of the company has fallen (Ongore & Kusa, 2013). The
⊘ This is a preview!⊘
Do you want full access?
Subscribe today to unlock all pages.
Trusted by 1+ million students worldwide
9
ACCOUNTING FOR BUSINESS
net profit margin for both BBVA Group and Alliance trust has reduced from previous year. The
profits of Alliance trust still stand out in the figure 1 as shown above. The return on equity shows
that the estimate has increased slightly from previous year’s results for Challenger ltd and BBVA
Group. The return on equity for Alliance trust has however reduced from previous year. As the
profitability of Alliance Trust is significantly more than Challenger ltd and BBVA Group, it is
quite natural that the return on equity for the company is much better than its competitors which
shows that the company is meeting the needs of the shareholders of the company effectively.
The return on assets estimates show that Alliance Trust has the best estimates in the comparative
study and the estimates of Challenger ltd and BBVA Group is no where near the results of
Alliance trust which shows that the company has a better return on assets.
Paraphrase This Document
Need a fresh take? Get an instant paraphrase of this document with our AI Paraphraser
10
ACCOUNTING FOR BUSINESS
Reference
Al Karim, R., & Alam, T. (2013). An evaluation of financial performance of private commercial
banks in Bangladesh: Ratio analysis. Journal of Business Studies Quarterly, 5(2), 65.
Baños-Caballero, S., García-Teruel, P. J., & Martínez-Solano, P. (2014). Working capital
management, corporate performance, and financial constraints. Journal of Business
Research, 67(3), 332-338.
Delen, D., Kuzey, C., & Uyar, A. (2013). Measuring firm performance using financial ratios: A
decision tree approach. Expert Systems with Applications, 40(10), 3970-3983.
Heikal, M., Khaddafi, M., & Ummah, A. (2014). Influence analysis of return on assets (ROA),
return on equity (ROE), net profit margin (NPM), debt to equity ratio (DER), and current ratio
(CR), against corporate profit growth in automotive in Indonesia Stock
Exchange. International Journal of Academic Research in Business and Social
Sciences, 4(12), 101.
Lartey, V. C., Antwi, S., & Boadi, E. K. (2013). The relationship between liquidity and
profitability of listed banks in Ghana. International Journal of Business and Social
Science, 4(3).
Luo, D., Dong, H., Luo, H., Xian, Y., Wan, J., Guo, X., & Wu, Y. (2015). The application of
stable isotope ratio analysis to determine the geographical origin of wheat. Food
chemistry, 174, 197-201.
11
ACCOUNTING FOR BUSINESS
Nirajini, A., & Priya, K. B. (2013). Impact of capital structure on financial performance of the
listed trading companies in Sri Lanka. International Journal of Scientific and Research
Publications, 3(5), 35-43.
Ongore, V. O., & Kusa, G. B. (2013). Determinants of financial performance of commercial
banks in Kenya. International Journal of Economics and Financial Issues, 3(1), 237.
Rehman, S. S. F. U. (2013). Relationship between financial leverage and financial performance:
Empirical evidence of listed sugar companies of Pakistan. Global Journal of Management
and Business Research.
⊘ This is a preview!⊘
Do you want full access?
Subscribe today to unlock all pages.
Trusted by 1+ million students worldwide
1 out of 15
Related Documents


Your All-in-One AI-Powered Toolkit for Academic Success.
+13062052269
info@desklib.com
Available 24*7 on WhatsApp / Email
![[object Object]](/_next/static/media/star-bottom.7253800d.svg)
Unlock your academic potential
Copyright © 2020–2025 A2Z Services. All Rights Reserved. Developed and managed by ZUCOL.