Financial Management Report: Champion, Claudia & Alliance Co.
VerifiedAdded on 2022/10/28
|13
|2386
|20
Report
AI Summary
This comprehensive financial management report analyzes three distinct portfolios: Champion Co., Claudia Co., and Alliance Co. The report begins with Champion Co., calculating annual after-tax cash flow, net present value (NPV), and sensitivity analysis for an equipment investment. It then moves on to Claudia Co., detailing the cash conversion cycle (CCC) calculation, including Days Inventory Outstanding (DIO), Days Sales Outstanding (DSO), and Days Payable Outstanding (DPO), along with a discussion of overtrading and strategies to mitigate it. Finally, the report assesses Alliance Co., calculating the current market value of a bond and the weighted average cost of capital (WACC). The analysis includes detailed workings, financial ratios, and strategic recommendations for each company's financial decisions. The report concludes with a reflection on the interplay of risk, uncertainty, and the impact of financial decisions on profitability.

Module Name: Financial Management
1
1
Paraphrase This Document
Need a fresh take? Get an instant paraphrase of this document with our AI Paraphraser
Table of Contents
Portfolio 1: Champion Co................................................................................................................3
Task (i).........................................................................................................................................3
Annual after-tax cash flow.......................................................................................................3
Net Present value.....................................................................................................................5
Comments................................................................................................................................5
Task (ii)........................................................................................................................................6
Task (iii).......................................................................................................................................6
Portfolio 2: Claudia Co....................................................................................................................6
Task (a)........................................................................................................................................6
Task (b)........................................................................................................................................7
Task (c)........................................................................................................................................9
Task (d)......................................................................................................................................10
Task (e)......................................................................................................................................10
Portfolio 3: Alliance Co.................................................................................................................11
Task (i).......................................................................................................................................11
Task (b):.....................................................................................................................................11
Task (c)......................................................................................................................................11
References......................................................................................................................................13
2
Portfolio 1: Champion Co.
Task (i)
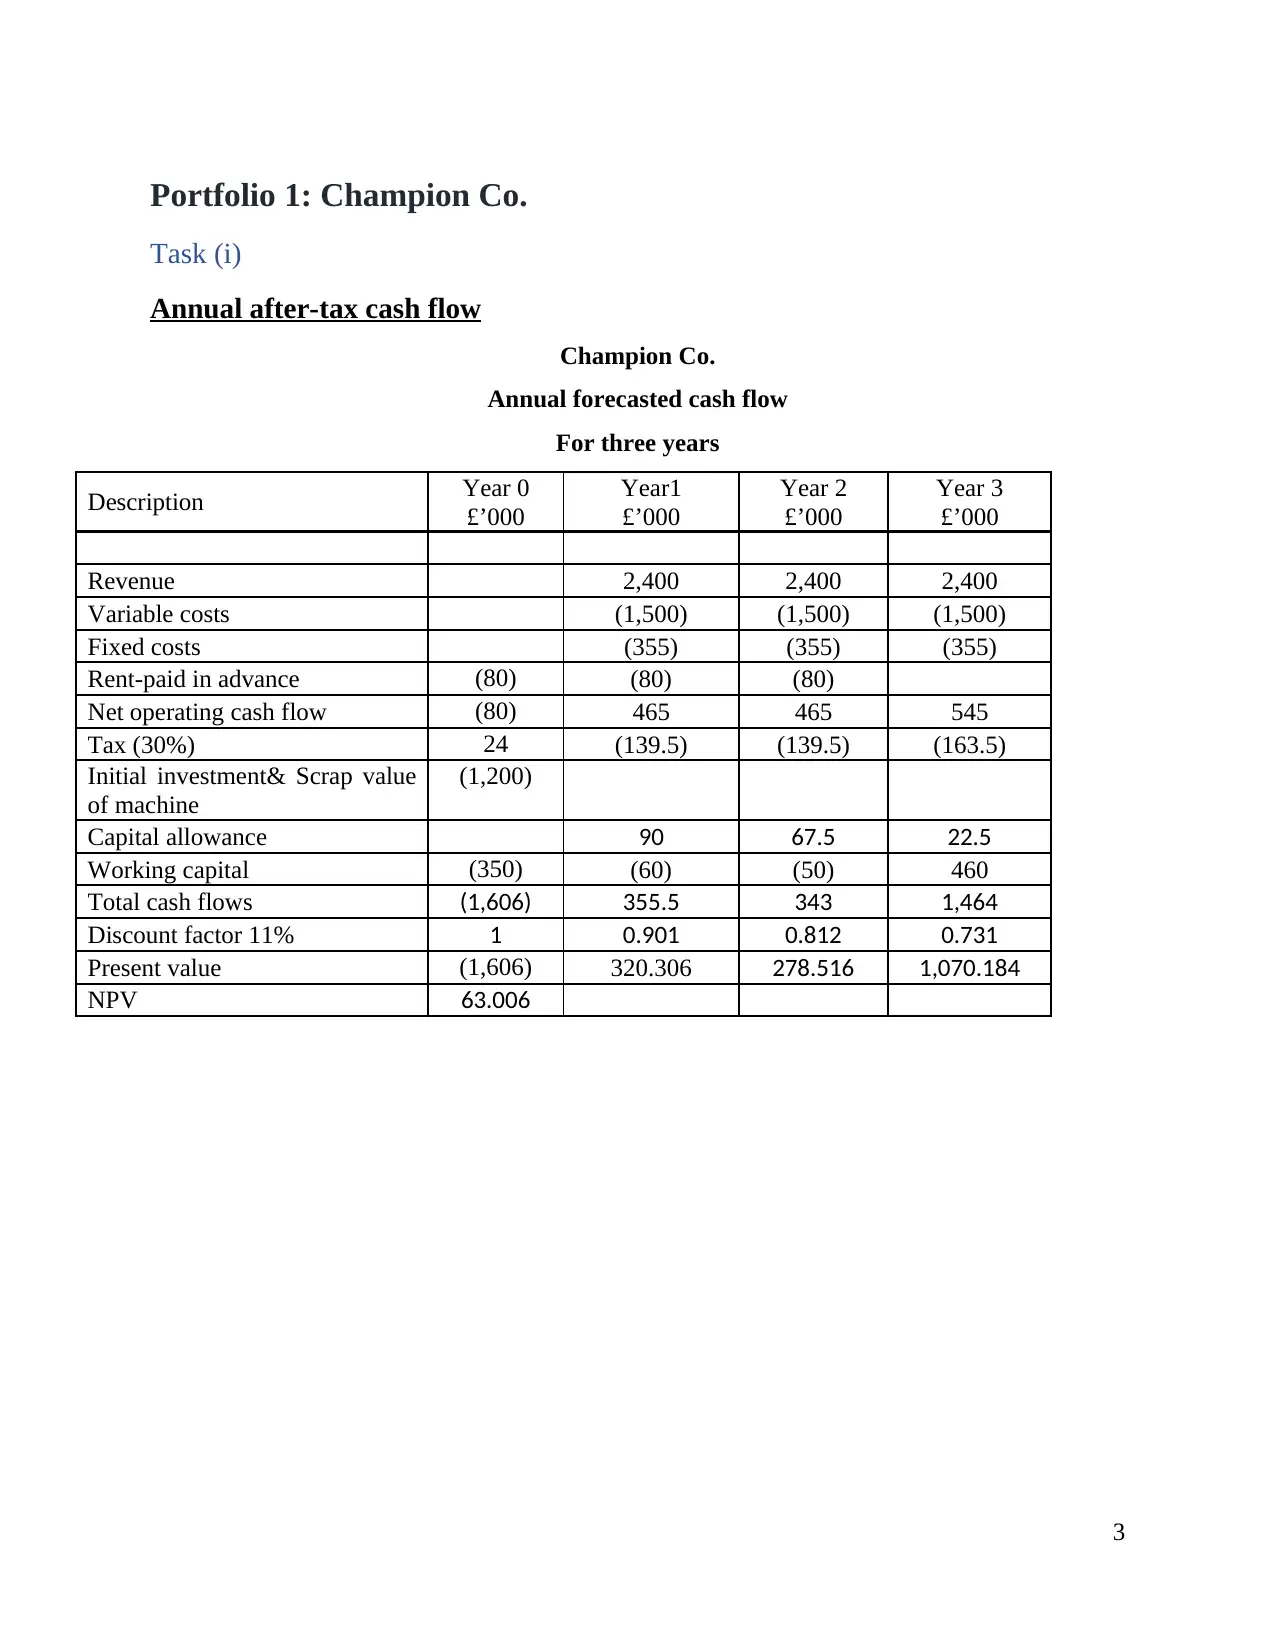
Annual after-tax cash flow
Champion Co.
Annual forecasted cash flow
For three years
Description Year 0
£’000
Year1
£’000
Year 2
£’000
Year 3
£’000
Revenue 2,400 2,400 2,400
Variable costs (1,500) (1,500) (1,500)
Fixed costs (355) (355) (355)
Rent-paid in advance (80) (80) (80)
Net operating cash flow (80) 465 465 545
Tax (30%) 24 (139.5) (139.5) (163.5)
Initial investment& Scrap value
of machine
(1,200)
Capital allowance 90 67.5 22.5
Working capital (350) (60) (50) 460
Total cash flows (1,606) 355.5 343 1,464
Discount factor 11% 1 0.901 0.812 0.731
Present value (1,606) 320.306 278.516 1,070.184
NPV 63.006
3
Task (i)
Annual after-tax cash flow
Champion Co.
Annual forecasted cash flow
For three years
Description Year 0
£’000
Year1
£’000
Year 2
£’000
Year 3
£’000
Revenue 2,400 2,400 2,400
Variable costs (1,500) (1,500) (1,500)
Fixed costs (355) (355) (355)
Rent-paid in advance (80) (80) (80)
Net operating cash flow (80) 465 465 545
Tax (30%) 24 (139.5) (139.5) (163.5)
Initial investment& Scrap value
of machine
(1,200)
Capital allowance 90 67.5 22.5
Working capital (350) (60) (50) 460
Total cash flows (1,606) 355.5 343 1,464
Discount factor 11% 1 0.901 0.812 0.731
Present value (1,606) 320.306 278.516 1,070.184
NPV 63.006
3
⊘ This is a preview!⊘
Do you want full access?
Subscribe today to unlock all pages.
Trusted by 1+ million students worldwide
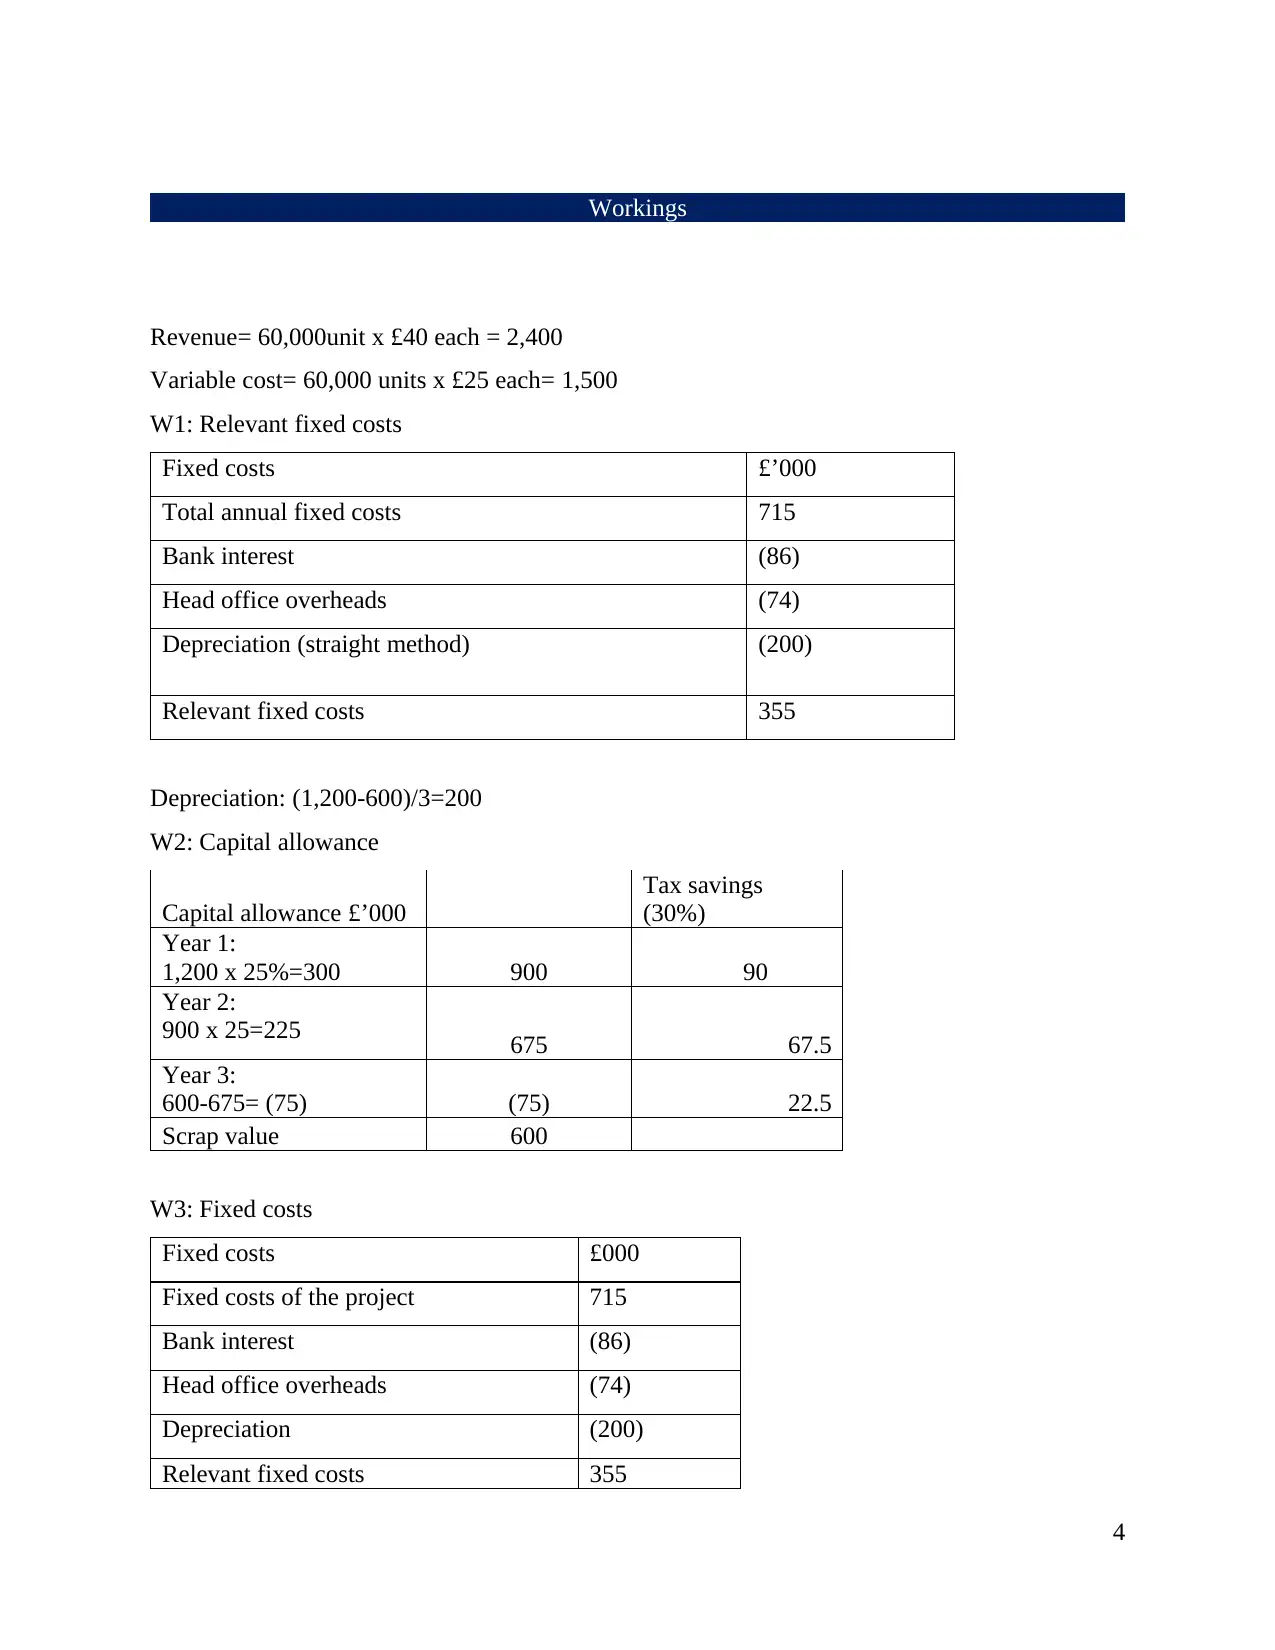
Workings
Revenue= 60,000unit x £40 each = 2,400
Variable cost= 60,000 units x £25 each= 1,500
W1: Relevant fixed costs
Fixed costs £’000
Total annual fixed costs 715
Bank interest (86)
Head office overheads (74)
Depreciation (straight method) (200)
Relevant fixed costs 355
Depreciation: (1,200-600)/3=200
W2: Capital allowance
Capital allowance £’000
Tax savings
(30%)
Year 1:
1,200 x 25%=300 900 90
Year 2:
900 x 25=225 675 67.5
Year 3:
600-675= (75) (75) 22.5
Scrap value 600
W3: Fixed costs
Fixed costs £000
Fixed costs of the project 715
Bank interest (86)
Head office overheads (74)
Depreciation (200)
Relevant fixed costs 355
4
Paraphrase This Document
Need a fresh take? Get an instant paraphrase of this document with our AI Paraphraser
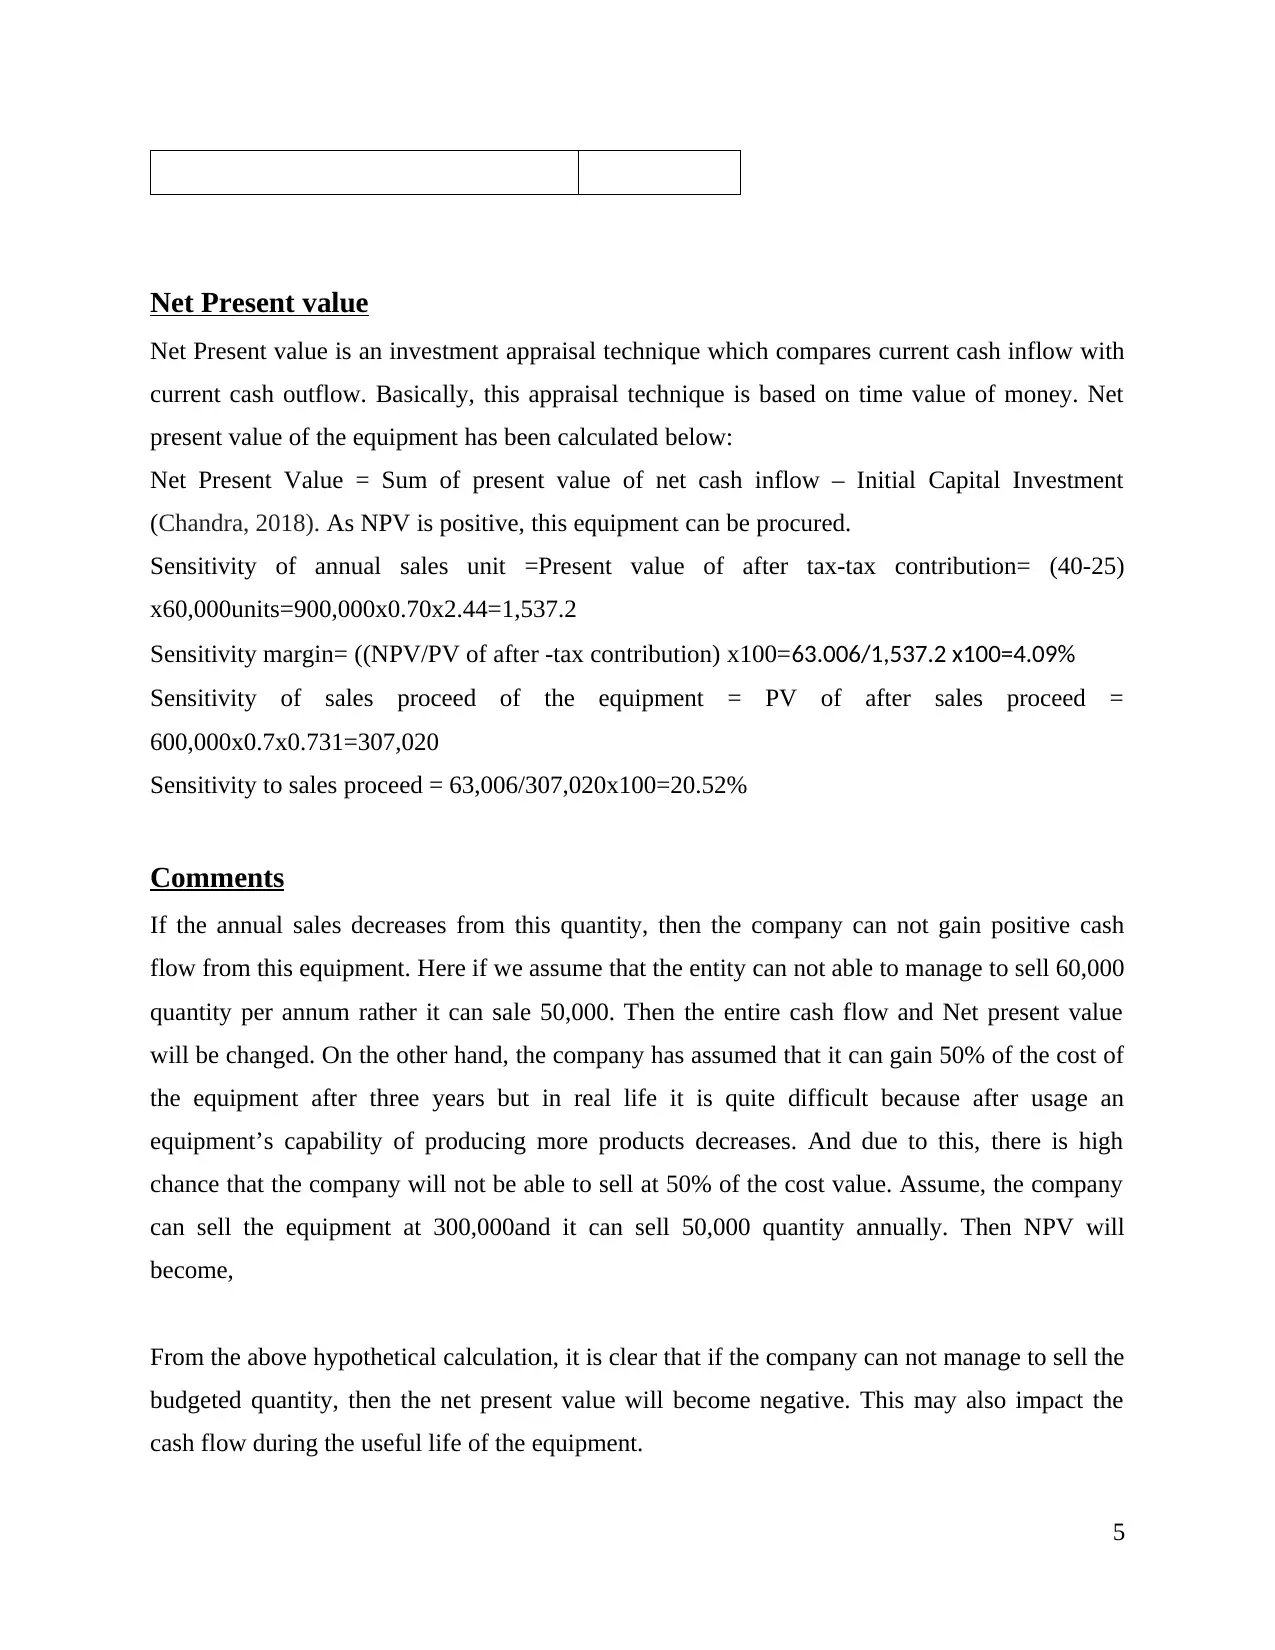
Net Present value
Net Present value is an investment appraisal technique which compares current cash inflow with
current cash outflow. Basically, this appraisal technique is based on time value of money. Net
present value of the equipment has been calculated below:
Net Present Value = Sum of present value of net cash inflow – Initial Capital Investment
(Chandra, 2018). As NPV is positive, this equipment can be procured.
Sensitivity of annual sales unit =Present value of after tax-tax contribution= (40-25)
x60,000units=900,000x0.70x2.44=1,537.2
Sensitivity margin= ((NPV/PV of after -tax contribution) x100=63.006/1,537.2 x100=4.09%
Sensitivity of sales proceed of the equipment = PV of after sales proceed =
600,000x0.7x0.731=307,020
Sensitivity to sales proceed = 63,006/307,020x100=20.52%
Comments
If the annual sales decreases from this quantity, then the company can not gain positive cash
flow from this equipment. Here if we assume that the entity can not able to manage to sell 60,000
quantity per annum rather it can sale 50,000. Then the entire cash flow and Net present value
will be changed. On the other hand, the company has assumed that it can gain 50% of the cost of
the equipment after three years but in real life it is quite difficult because after usage an
equipment’s capability of producing more products decreases. And due to this, there is high
chance that the company will not be able to sell at 50% of the cost value. Assume, the company
can sell the equipment at 300,000and it can sell 50,000 quantity annually. Then NPV will
become,
From the above hypothetical calculation, it is clear that if the company can not manage to sell the
budgeted quantity, then the net present value will become negative. This may also impact the
cash flow during the useful life of the equipment.
5
Task (ii)
As per the given value of Champion, the company will incur negative cash flow at the first year
because at this year, the company will have to purchase the equipment, and this will engage 1.2
million amounts of money. And in the third year, the company will be incurring highest amount
of cash flow because in that year the company is assuming that it can recover the scrap value and
investment in working capital. But after analysing the hypothetical values of scrap value and
Sales amount, it can be concluded that the company should analysis the market again based on
real data value. Otherwise, there is high chance of getting negative cash flow and negative net
present value.
Task (iii)
Risk describes a situation where there is a half chance of being successful on the other hand
uncertainty refers to the condition of the situation where an investor is not sure about the
outcome. Normally these two terms are interrelated but first one describes about a situation and
the second describes about the condition of the situation. For example, Investor is investing in a
project but the project risky. And the reason of risk is that the investor is not sure about whether
he will get outcome from the project. This insecurity is uncertainty.
Methods to incorporate risk or uncertainty are:
1. Certainty Equivalent Method: In this method, cash flows are adjusted with reflective project
risk.
2. Risk-adjusted discount rate method: Under this method, differential project risk is considered
by changing the discount rate of the project’s average rate of return.
Portfolio 2: Claudia Co.
Task (a)
Cash Conversion cycle is basically a metric which provides the minimum time to the company
within which the company can convert its investment in working capital into cash. Here working
capital means inventory, accounts receivables, accrued revenue etc. There are some key points of
Cash conversion cycle:
It expresses the length of time within which a company will recover its investment in the
working capital.
6
⊘ This is a preview!⊘
Do you want full access?
Subscribe today to unlock all pages.
Trusted by 1+ million students worldwide
This metric considers the time which is required by a company to sell its inventory. Also,
the time is required to collect cash from trade receivables, and the time within which the
company can pay the bill without incurring any penalties.
Cash Conversion cycle is not same for all types of business rather it differs from industry
to industry.
Cash Conversion cycle is important in determining the requirement for working capital. Because
it provides the basis of assuming the required working capital. Through the days determined, a
company can easily make plan whether to continue current strategy or the strategy needs to be
changed.
Task (b)
To determine the cash conversion cycle, a company is required to calculate following ratios:
1. Days Inventory Outstanding (DIO).
2. Days Sales Outstanding (DSO).
3. Days Payable Outstanding (DPO).
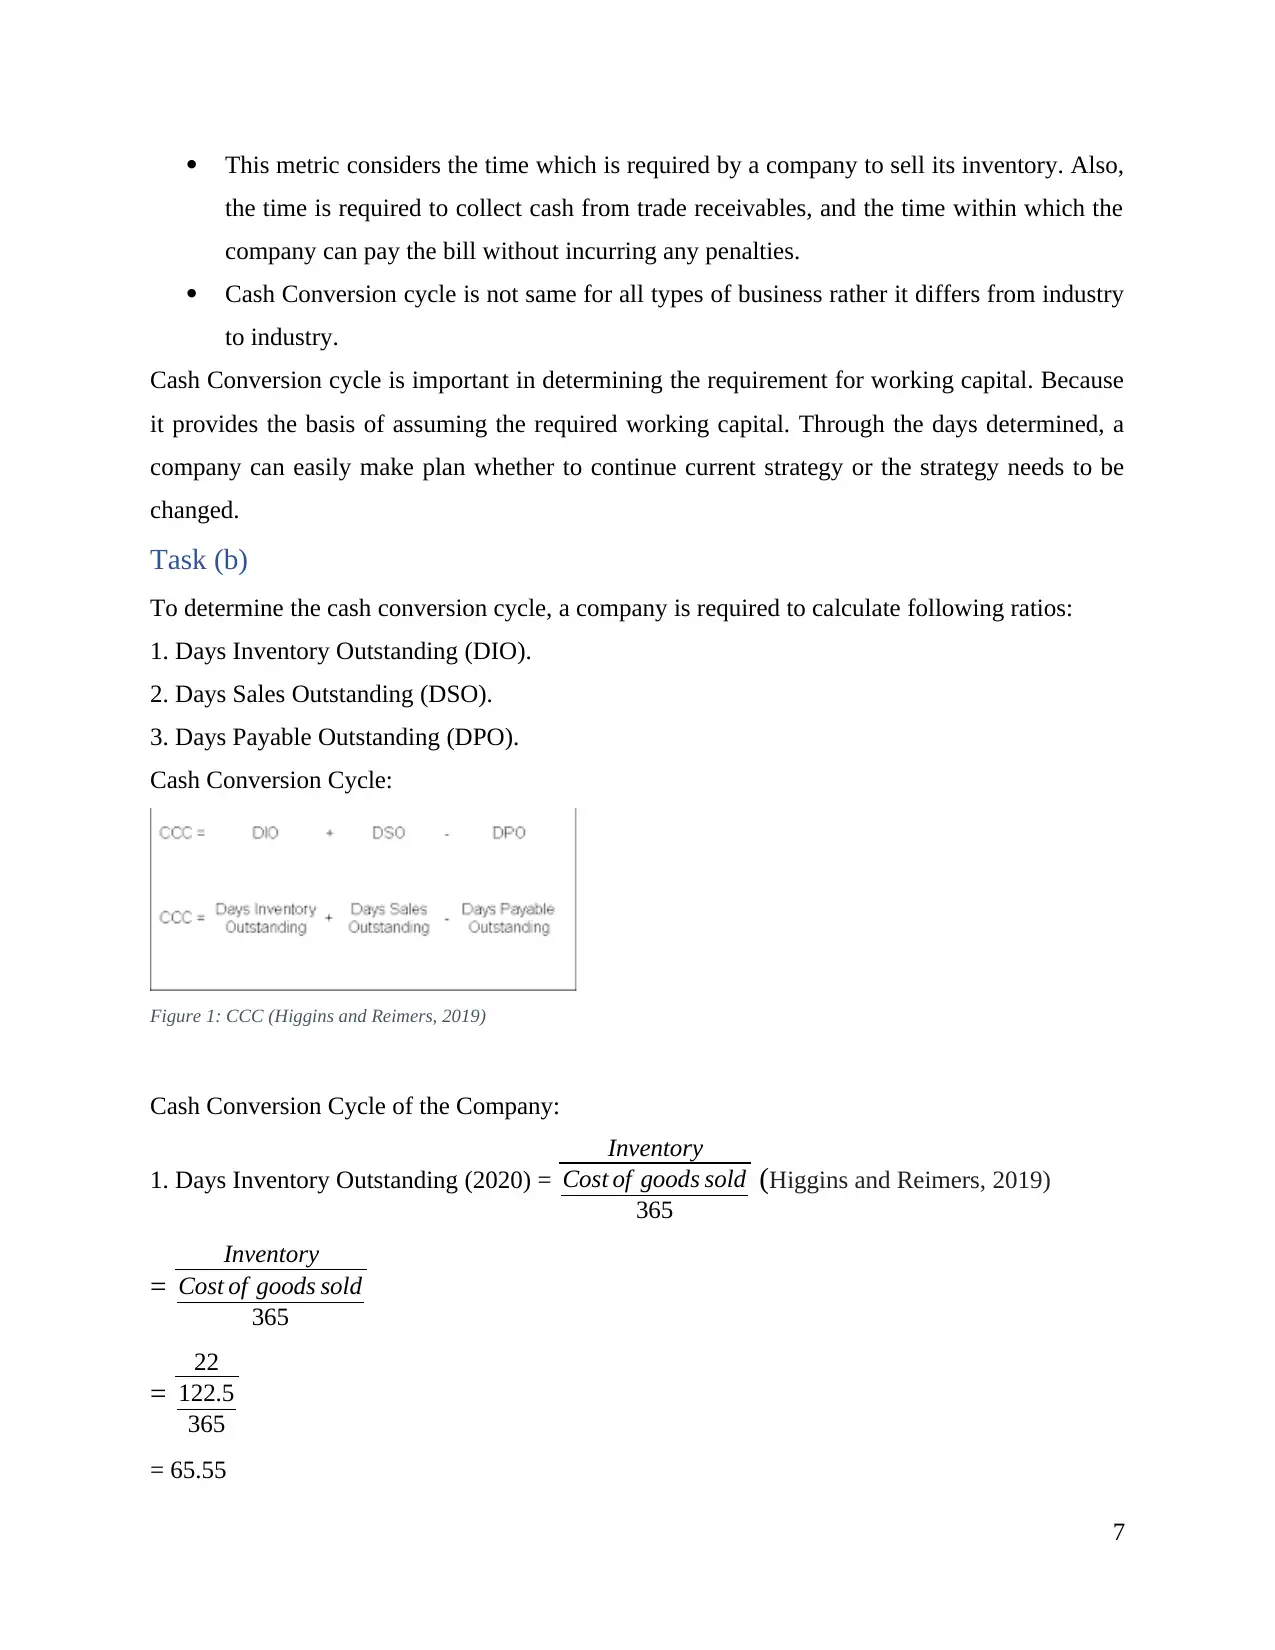
Cash Conversion Cycle:
Figure 1: CCC (Higgins and Reimers, 2019)
Cash Conversion Cycle of the Company:
1. Days Inventory Outstanding (2020) =
Inventory
Cost of goods sold
365
(Higgins and Reimers, 2019)
=
Inventory
Cost of goods sold
365
=
22
122.5
365
= 65.55
7
the time is required to collect cash from trade receivables, and the time within which the
company can pay the bill without incurring any penalties.
Cash Conversion cycle is not same for all types of business rather it differs from industry
to industry.
Cash Conversion cycle is important in determining the requirement for working capital. Because
it provides the basis of assuming the required working capital. Through the days determined, a
company can easily make plan whether to continue current strategy or the strategy needs to be
changed.
Task (b)
To determine the cash conversion cycle, a company is required to calculate following ratios:
1. Days Inventory Outstanding (DIO).
2. Days Sales Outstanding (DSO).
3. Days Payable Outstanding (DPO).
Cash Conversion Cycle:
Figure 1: CCC (Higgins and Reimers, 2019)
Cash Conversion Cycle of the Company:
1. Days Inventory Outstanding (2020) =
Inventory
Cost of goods sold
365
(Higgins and Reimers, 2019)
=
Inventory
Cost of goods sold
365
=
22
122.5
365
= 65.55
7
Paraphrase This Document
Need a fresh take? Get an instant paraphrase of this document with our AI Paraphraser
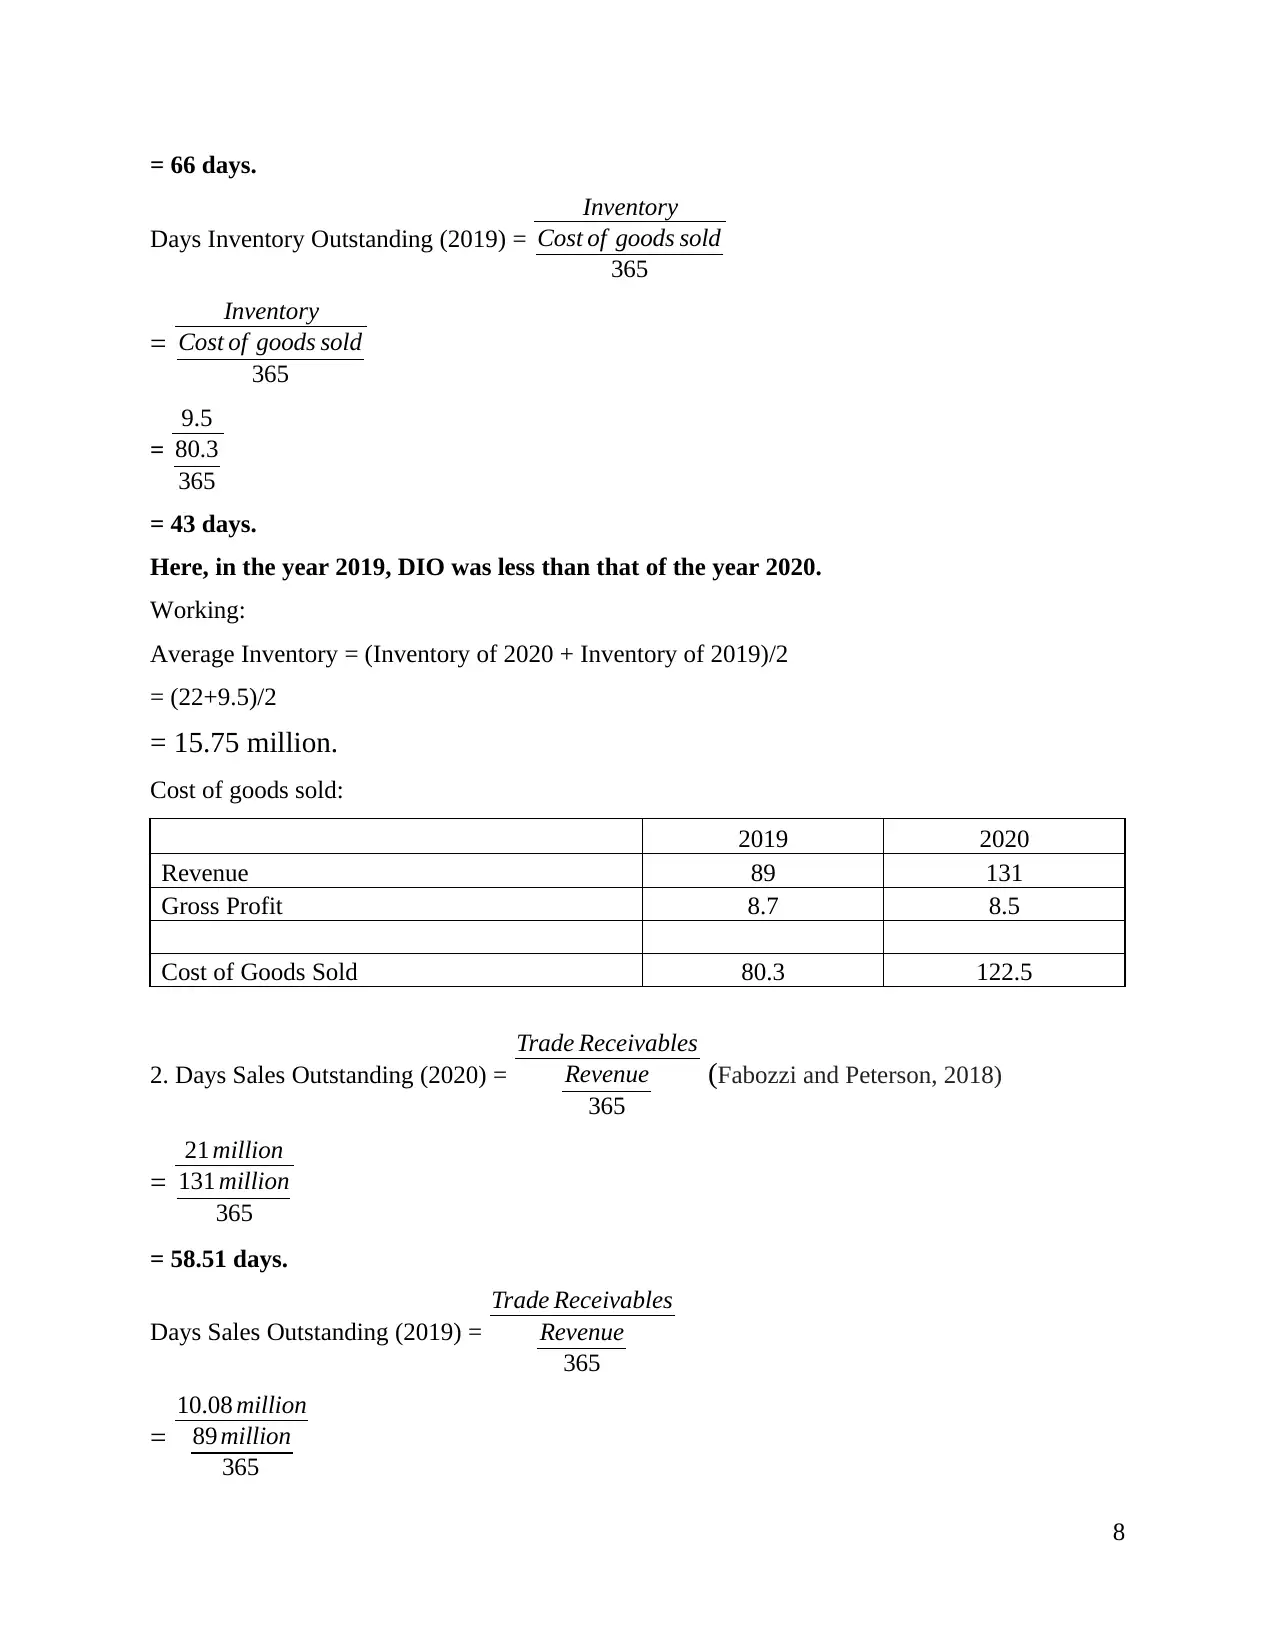
= 66 days.
Days Inventory Outstanding (2019) =
Inventory
Cost of goods sold
365
=
Inventory
Cost of goods sold
365
=
9.5
80.3
365
= 43 days.
Here, in the year 2019, DIO was less than that of the year 2020.
Working:
Average Inventory = (Inventory of 2020 + Inventory of 2019)/2
= (22+9.5)/2
= 15.75 million.
Cost of goods sold:
2019 2020
Revenue 89 131
Gross Profit 8.7 8.5
Cost of Goods Sold 80.3 122.5
2. Days Sales Outstanding (2020) =
Trade Receivables
Revenue
365
(Fabozzi and Peterson, 2018)
=
21 million
131 million
365
= 58.51 days.
Days Sales Outstanding (2019) =
Trade Receivables
Revenue
365
=
10.08 million
89 million
365
8
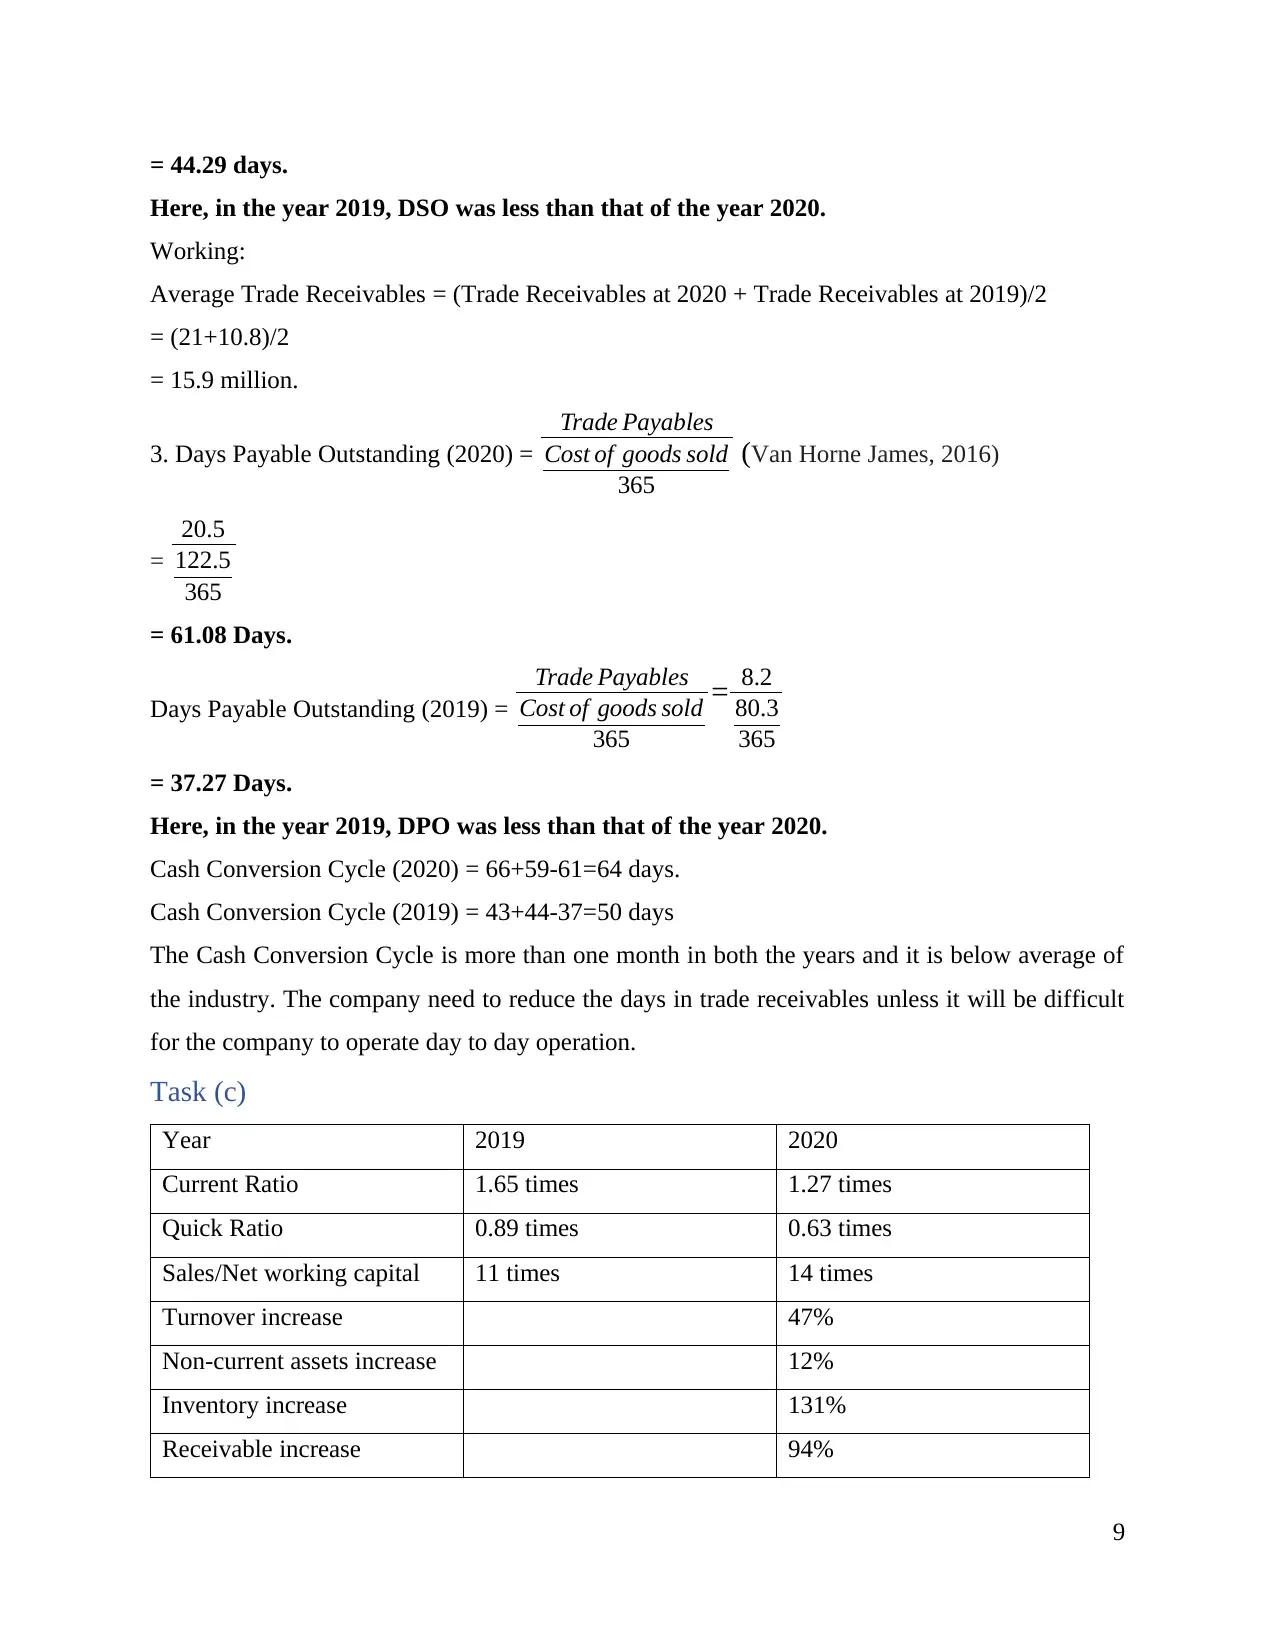
= 44.29 days.
Here, in the year 2019, DSO was less than that of the year 2020.
Working:
Average Trade Receivables = (Trade Receivables at 2020 + Trade Receivables at 2019)/2
= (21+10.8)/2
= 15.9 million.
3. Days Payable Outstanding (2020) =
Trade Payables
Cost of goods sold
365
(Van Horne James, 2016)
=
20.5
122.5
365
= 61.08 Days.
Days Payable Outstanding (2019) =
Trade Payables
Cost of goods sold
365
= 8.2
80.3
365
= 37.27 Days.
Here, in the year 2019, DPO was less than that of the year 2020.
Cash Conversion Cycle (2020) = 66+59-61=64 days.
Cash Conversion Cycle (2019) = 43+44-37=50 days
The Cash Conversion Cycle is more than one month in both the years and it is below average of
the industry. The company need to reduce the days in trade receivables unless it will be difficult
for the company to operate day to day operation.
Task (c)
Year 2019 2020
Current Ratio 1.65 times 1.27 times
Quick Ratio 0.89 times 0.63 times
Sales/Net working capital 11 times 14 times
Turnover increase 47%
Non-current assets increase 12%
Inventory increase 131%
Receivable increase 94%
9
⊘ This is a preview!⊘
Do you want full access?
Subscribe today to unlock all pages.
Trusted by 1+ million students worldwide
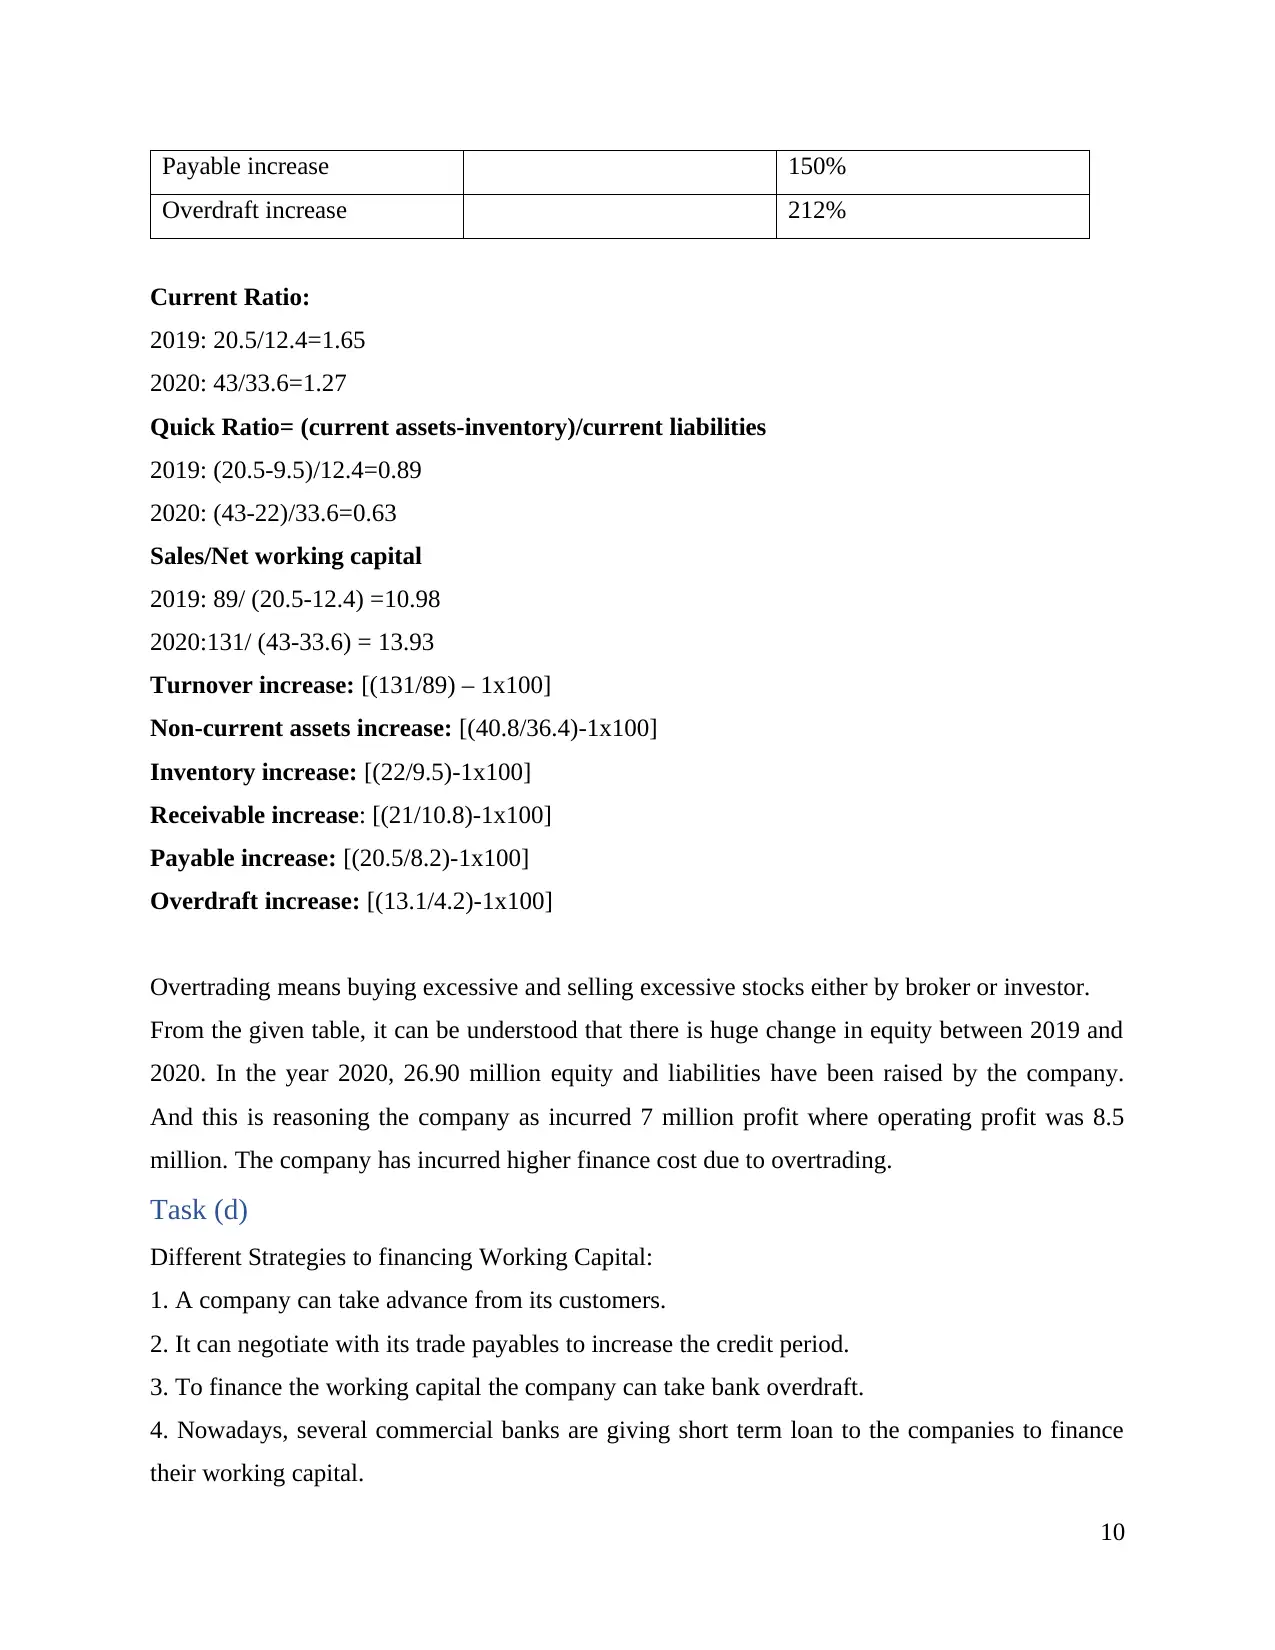
Payable increase 150%
Overdraft increase 212%
Current Ratio:
2019: 20.5/12.4=1.65
2020: 43/33.6=1.27
Quick Ratio= (current assets-inventory)/current liabilities
2019: (20.5-9.5)/12.4=0.89
2020: (43-22)/33.6=0.63
Sales/Net working capital
2019: 89/ (20.5-12.4) =10.98
2020:131/ (43-33.6) = 13.93
Turnover increase: [(131/89) – 1x100]
Non-current assets increase: [(40.8/36.4)-1x100]
Inventory increase: [(22/9.5)-1x100]
Receivable increase: [(21/10.8)-1x100]
Payable increase: [(20.5/8.2)-1x100]
Overdraft increase: [(13.1/4.2)-1x100]
Overtrading means buying excessive and selling excessive stocks either by broker or investor.
From the given table, it can be understood that there is huge change in equity between 2019 and
2020. In the year 2020, 26.90 million equity and liabilities have been raised by the company.
And this is reasoning the company as incurred 7 million profit where operating profit was 8.5
million. The company has incurred higher finance cost due to overtrading.
Task (d)
Different Strategies to financing Working Capital:
1. A company can take advance from its customers.
2. It can negotiate with its trade payables to increase the credit period.
3. To finance the working capital the company can take bank overdraft.
4. Nowadays, several commercial banks are giving short term loan to the companies to finance
their working capital.
10
Paraphrase This Document
Need a fresh take? Get an instant paraphrase of this document with our AI Paraphraser
Task (e)
Overtrading is a common incident in case of rapidly growing companies. To avoid overtrading,
Claudia can follow following strategies:
1. Can take lease or can purchase fixed assets on hire price.
2. Can bring more capital to the company.
3. They need to cut the unnecessary costs.
4. They need to be very cost effective and cost efficiency.
Portfolio 3: Alliance Co
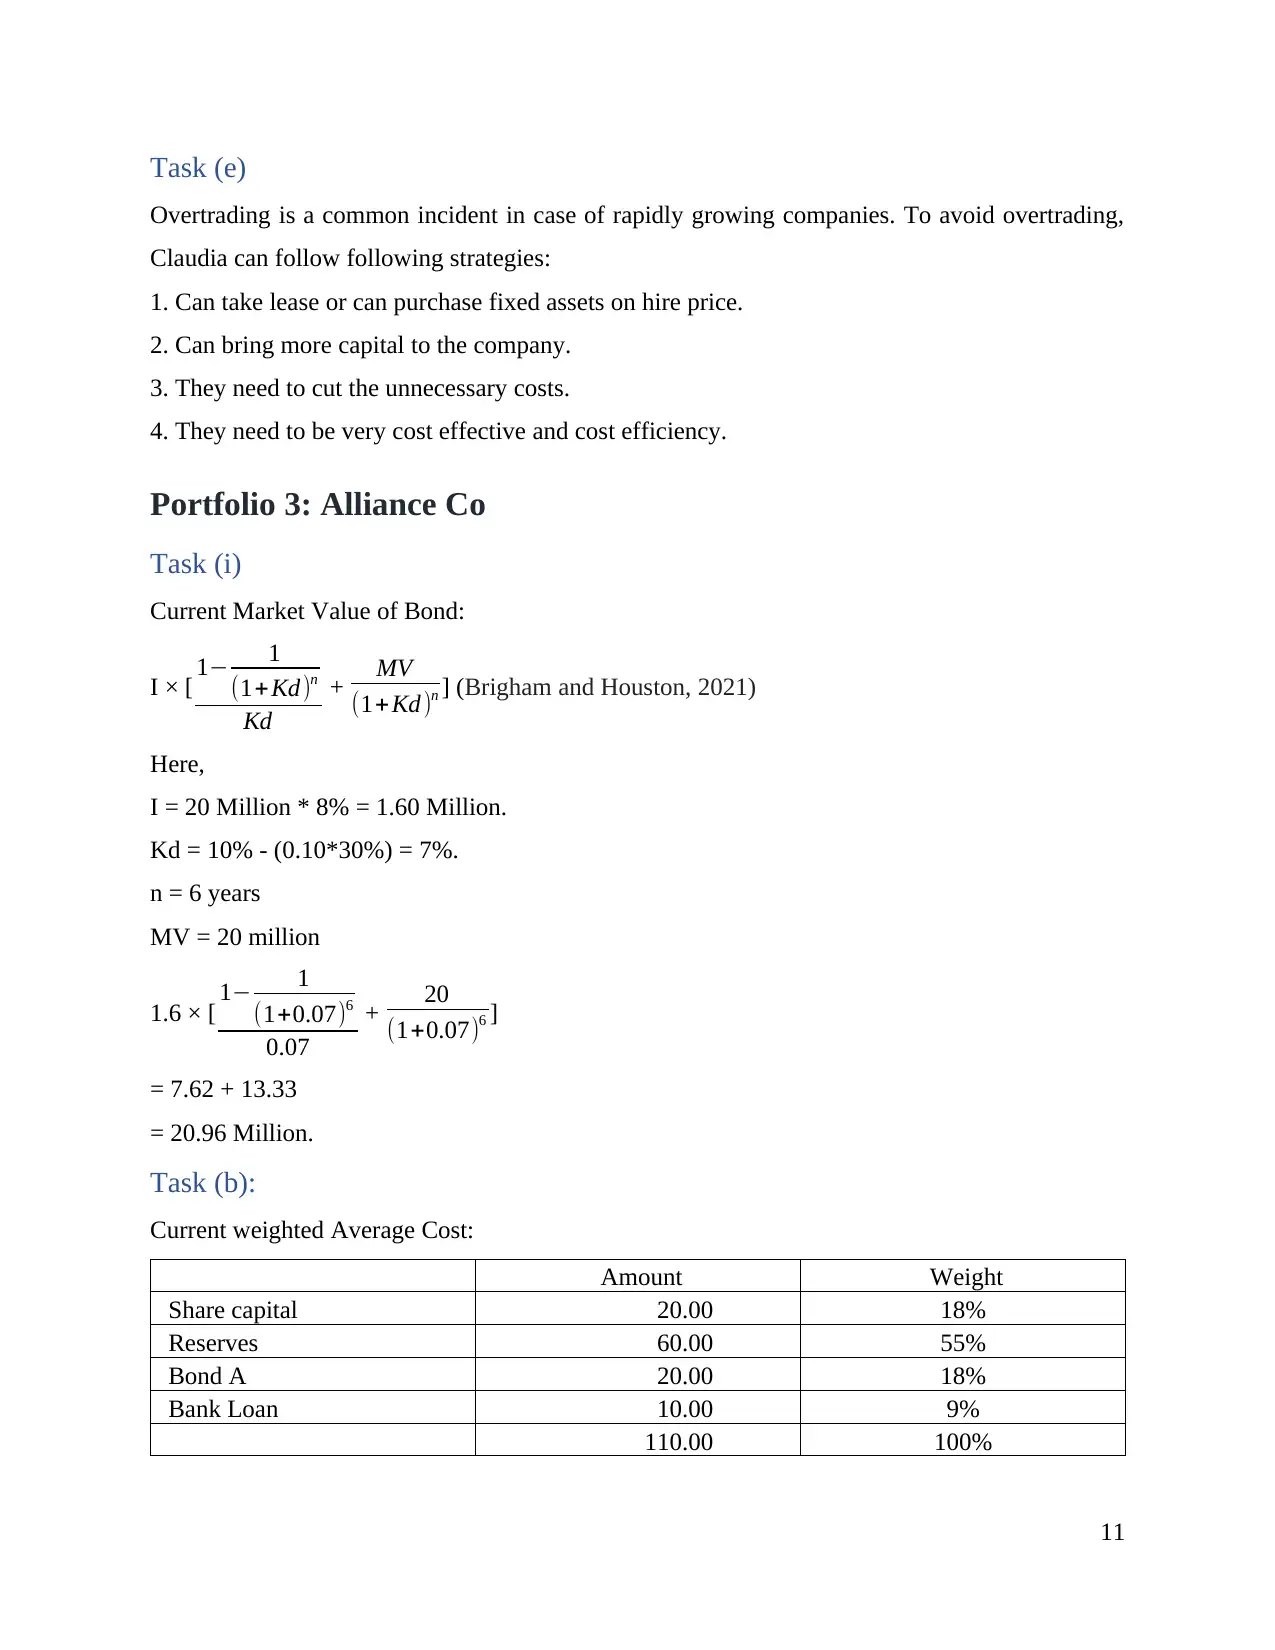
Task (i)
Current Market Value of Bond:
I × [ 1− 1
(1+ Kd)n
Kd
+ MV
(1+ Kd)n ] (Brigham and Houston, 2021)
Here,
I = 20 Million * 8% = 1.60 Million.
Kd = 10% - (0.10*30%) = 7%.
n = 6 years
MV = 20 million
1.6 × [ 1− 1
(1+0.07)6
0.07
+ 20
(1+0.07)6 ]
= 7.62 + 13.33
= 20.96 Million.
Task (b):
Current weighted Average Cost:
Amount Weight
Share capital 20.00 18%
Reserves 60.00 55%
Bond A 20.00 18%
Bank Loan 10.00 9%
110.00 100%
11
Overtrading is a common incident in case of rapidly growing companies. To avoid overtrading,
Claudia can follow following strategies:
1. Can take lease or can purchase fixed assets on hire price.
2. Can bring more capital to the company.
3. They need to cut the unnecessary costs.
4. They need to be very cost effective and cost efficiency.
Portfolio 3: Alliance Co
Task (i)
Current Market Value of Bond:
I × [ 1− 1
(1+ Kd)n
Kd
+ MV
(1+ Kd)n ] (Brigham and Houston, 2021)
Here,
I = 20 Million * 8% = 1.60 Million.
Kd = 10% - (0.10*30%) = 7%.
n = 6 years
MV = 20 million
1.6 × [ 1− 1
(1+0.07)6
0.07
+ 20
(1+0.07)6 ]
= 7.62 + 13.33
= 20.96 Million.
Task (b):
Current weighted Average Cost:
Amount Weight
Share capital 20.00 18%
Reserves 60.00 55%
Bond A 20.00 18%
Bank Loan 10.00 9%
110.00 100%
11

WACC = 0.15*18% + 0.15*55% + 0.07*9% + 0.04*9% = 12%.
Here, Cost of Equity = 15%.
Cost of equity = Cost of reserve = 15%.
Cost of bond A = (0.10 – 0.10*30%) = 7%
Cost of bank Loan = LIBOR + 1% = 3% + 1% = 4%.
Task (c)
In the prior section, weighted average cost of capital of the company has already been calculated.
It seems that the cost of capital is not so high, but it can be compared with rate of return. Suppose
the rate of return is 16%, then the company’s cost capital is effective that the company has
managed to earn higher than the cost of capital. If the company raises more debt than the cost of
capital will be increased, and it will increase the finance cost. Though in the market, there is a
prediction of increasing the interest rate by 4%. Due to this increases the finance cost will also be
increased and in spite of having higher operating profit the company may incur low profit after
tax.
12
⊘ This is a preview!⊘
Do you want full access?
Subscribe today to unlock all pages.
Trusted by 1+ million students worldwide
1 out of 13
Related Documents


Your All-in-One AI-Powered Toolkit for Academic Success.
+13062052269
info@desklib.com
Available 24*7 on WhatsApp / Email
![[object Object]](/_next/static/media/star-bottom.7253800d.svg)
Unlock your academic potential
Copyright © 2020–2026 A2Z Services. All Rights Reserved. Developed and managed by ZUCOL.