Numeracy and Data Analysis: Charlton Station Forecasting Report

Verified

Added on  2021/02/21

|8
|1343
|32
Report
AI Summary
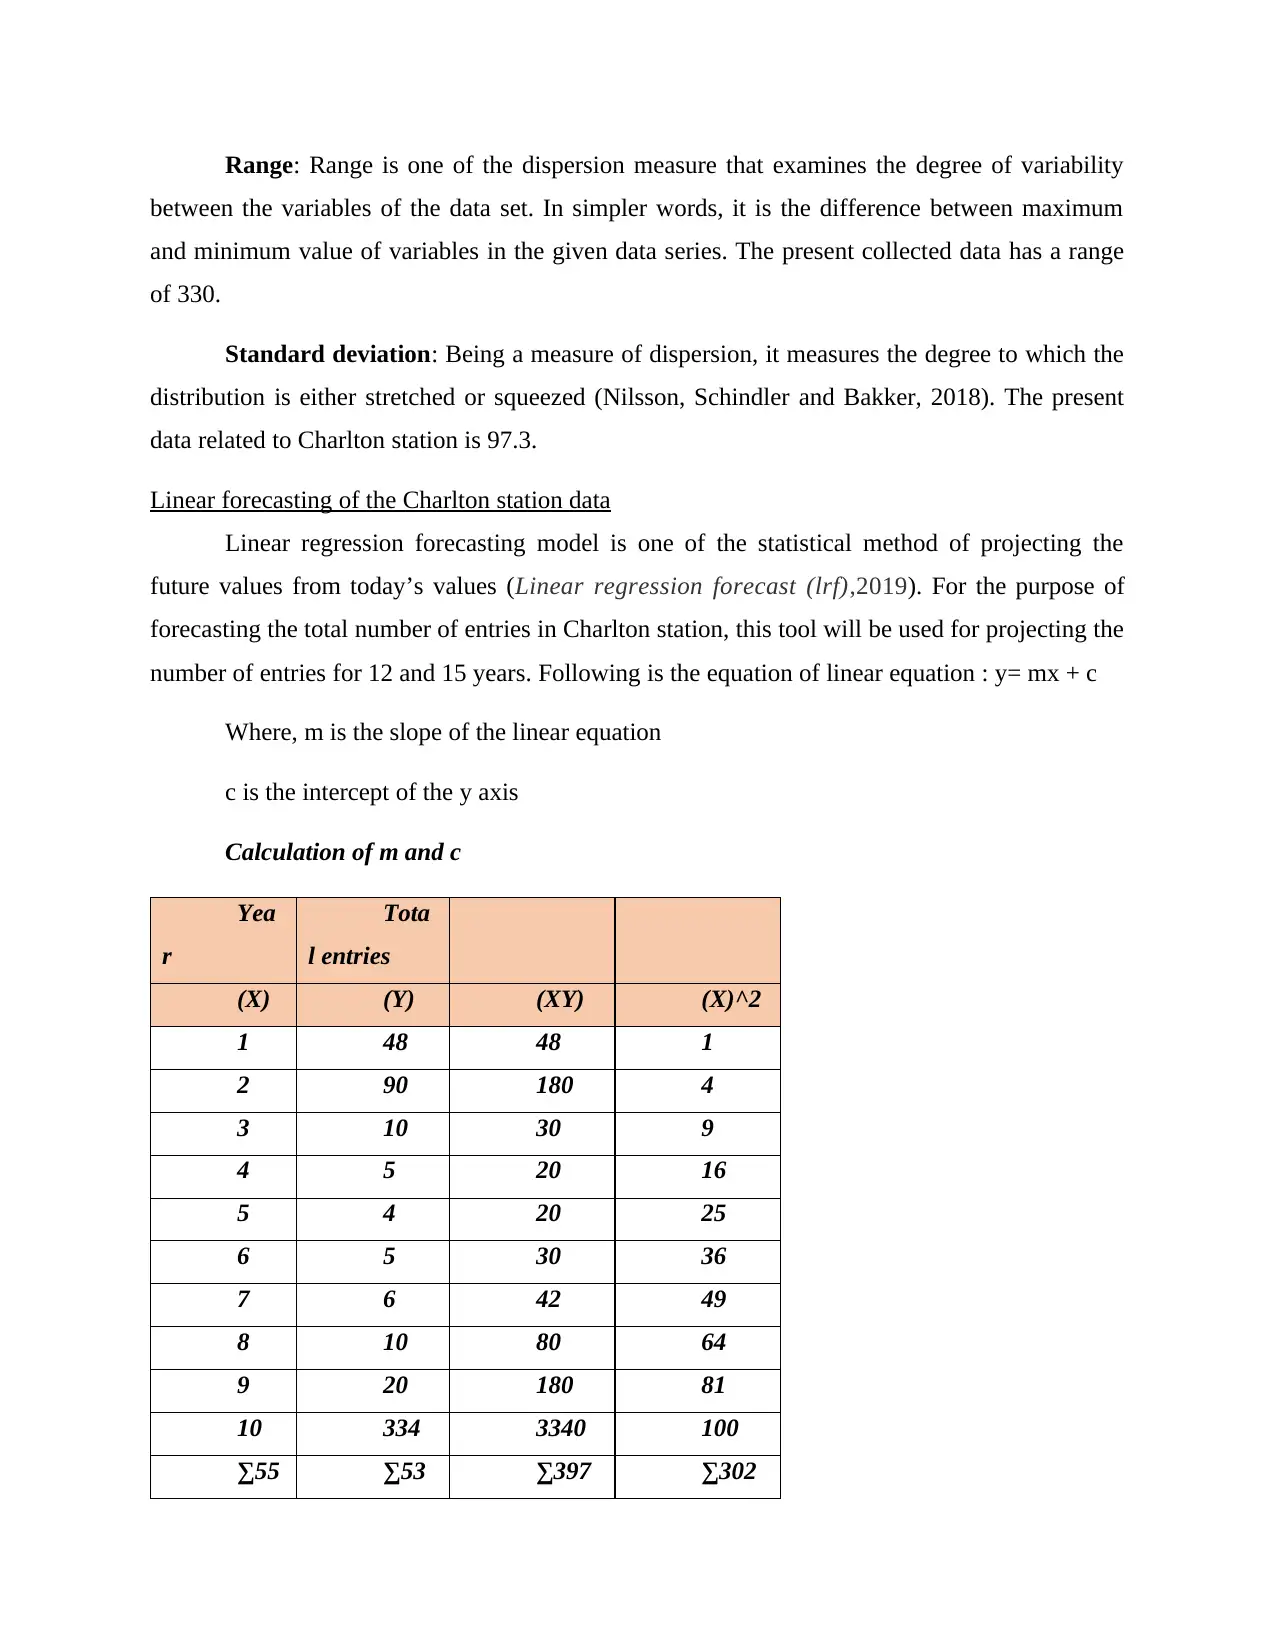
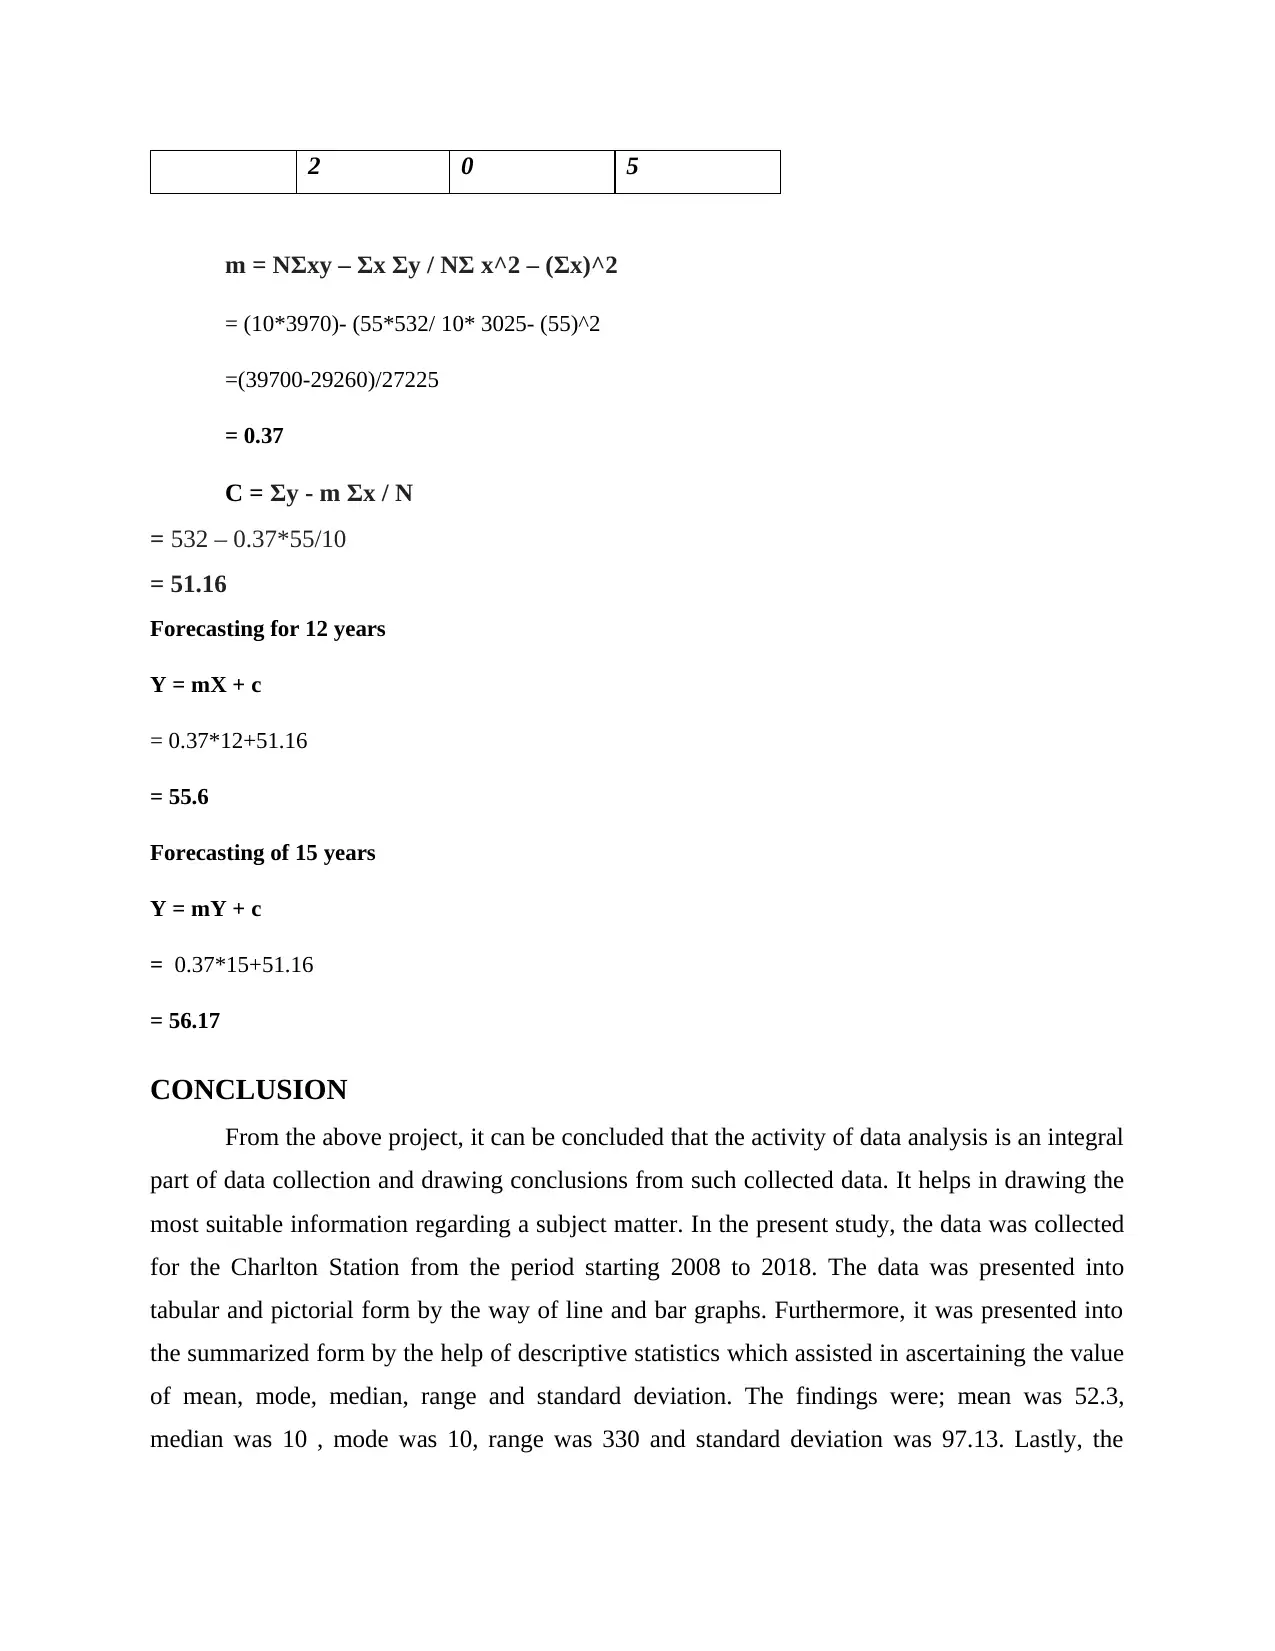
This report presents a comprehensive analysis of passenger data from Charlton Station spanning from 2008 to 2018. The data, initially arranged in a tabular format, is visualized using bar and line charts to illustrate trends in passenger entries. Descriptive statistics, including mean, mode, median, range, and standard deviation, are calculated to summarize the data and identify key characteristics. Furthermore, the report employs a linear regression model to forecast the total number of entries for the subsequent 12 and 15 years. The findings reveal insights into passenger trends and provide future projections. The report concludes with a summary of the data analysis process and its outcomes, along with relevant references to support the methodology and findings.
Document Page
Numeracy and data
analysis
tabler-icon-diamond-filled.svg

Secure Best Marks with AI Grader

Need help grading? Try our AI Grader for instant feedback on your assignments.
Document Page
Table of Contents
INTRODUCTION.....................................................................................................................................3
Arrangement of the data collected in the tabular form.............................................................................3
Representation of the tabular data in the pictorial form...........................................................................3
Calculations of mean, mode, median, range and standard deviation and presentation of final findings...5
Linear forecasting of the Charlton station data........................................................................................6
CONCLUSION..........................................................................................................................................7
REFERENCES..........................................................................................................................................8
Document Page
INTRODUCTION
Numeracy’s literal meaning is the ability of reasoning and applying basic concepts of
numeric. Data analysis can be referred to as a systematic process of gathering data, examining it,
transforming and cleaning it in the form of sorting and modeling the information so collected for
the purpose of extracting some useful information that could help in decision making of a person
or organization (Dierdorp and et.al., 2016). The present report will highlight the presentation of
data related to total number of passengers entered and exited. Further, the data collected will be
summarized into meaningful information by the use of descriptive statistics which will assist in
finding the mean, mode, median, standard deviation and range of the data. Lastly, forecasting
will be done for the total entries at the station with the application of linear regression model for
the period of 12 and 15 years.
MAIN BODY
Arrangement of the data collected in the tabular form
Data was collected for the Charlton station for the last ten years from 2008 to 2018 which
was related to the total number of passengers entered and exited the station. The data gathered
showed high degree of oscillations in the total entries at the station.
Year Total entries
2008-09 48
2009-10 90
2010-11 10
2011-12 5
2012-13 4
2013-14 5
2014-15 6
2015-16 10
2016-17 20
2017-18 334
Document Page
Representation of the tabular data in the pictorial form
Bar chart:
2008-09 2009-10 2010-11 2011-12 2012-13 2013-14 2014-15 2015-16 2016-17 2017-18
0
50
100
150
200
250
300
350
Total entries
Line chart:
2008-09 2009-10 2010-11 2011-12 2012-13 2013-14 2014-15 2015-16 2016-17 2017-18
0
50
100
150
200
250
300
350
400
Total entries
Interpretation: The data was presented in the form of bar char and line chart. Both the
charts shows the comparison of data over the time span of 10 years of Charlton station. It was
observed from the chart that total number of entries in the years 2011, 2012, 2013, 2014 and
tabler-icon-diamond-filled.svg

Secure Best Marks with AI Grader

Need help grading? Try our AI Grader for instant feedback on your assignments.
Document Page
2015 were lowest in the ten years. The momentum however, picked up in the year 2015 and in
the year 2017-18, the data related to the passengers sky-rocketed in the bar and line charts.
Calculations of mean, mode, median, range and standard deviation and presentation of final
findings
Measures of central tendency and measures of dispersion are all the elements of
descriptive statistics. It is that part of statistical tool which does the work of translating the raw
data into meaningful information. This descriptive analysis assist in determining the pattern of a
sample from the total population. It basically summarizes that data which has been gathered by
the way of historical record, experiment or survey (Zook and Pearce, 2017).
mean 53.2
mode 10
median 10
Range 330
standard
deviation
97.13
Mean: The average of the values in the simple language is known as mean of a data set.
It is basically that average value of the data series which helps in deriving the central tendency of
the data in the given series or sample population. The mean of the total entries of passengers at
the Charlton station was 53.2.
Mode: It represent the numerical quantity which has occurred the most in the given
sample population (Crowder, 2017). In the present data of the Charlton station, the mode is 10
because this value in the data collected has occurred twice in the collected information regarding
the station.
Median: It represents that value which has the capability of dividing the data in the two
segments that are upper and lower segments. It is the middle most value in the sample
population. In the present study, the median of total entries of passengers in Charlton station is
10.
Document Page
Range: Range is one of the dispersion measure that examines the degree of variability
between the variables of the data set. In simpler words, it is the difference between maximum
and minimum value of variables in the given data series. The present collected data has a range
of 330.
Standard deviation: Being a measure of dispersion, it measures the degree to which the
distribution is either stretched or squeezed (Nilsson, Schindler and Bakker, 2018). The present
data related to Charlton station is 97.3.
Linear forecasting of the Charlton station data
Linear regression forecasting model is one of the statistical method of projecting the
future values from today’s values (Linear regression forecast (lrf),2019). For the purpose of
forecasting the total number of entries in Charlton station, this tool will be used for projecting the
number of entries for 12 and 15 years. Following is the equation of linear equation : y= mx + c
Where, m is the slope of the linear equation
c is the intercept of the y axis
Calculation of m and c
Yea
r
Tota
l entries
(X) (Y) (XY) (X)^2
1 48 48 1
2 90 180 4
3 10 30 9
4 5 20 16
5 4 20 25
6 5 30 36
7 6 42 49
8 10 80 64
9 20 180 81
10 334 3340 100
∑55 ∑53 ∑397 ∑302
Document Page
2 0 5
m = NΣxy – Σx Σy / NΣ x^2 – (Σx)^2
= (10*3970)- (55*532/ 10* 3025- (55)^2
=(39700-29260)/27225
= 0.37
C = Σy - m Σx / N
= 532 – 0.37*55/10
= 51.16
Forecasting for 12 years
Y = mX + c
= 0.37*12+51.16
= 55.6
Forecasting of 15 years
Y = mY + c
= 0.37*15+51.16
= 56.17
CONCLUSION
From the above project, it can be concluded that the activity of data analysis is an integral
part of data collection and drawing conclusions from such collected data. It helps in drawing the
most suitable information regarding a subject matter. In the present study, the data was collected
for the Charlton Station from the period starting 2008 to 2018. The data was presented into
tabular and pictorial form by the way of line and bar graphs. Furthermore, it was presented into
the summarized form by the help of descriptive statistics which assisted in ascertaining the value
of mean, mode, median, range and standard deviation. The findings were; mean was 52.3,
median was 10 , mode was 10, range was 330 and standard deviation was 97.13. Lastly, the
tabler-icon-diamond-filled.svg

Paraphrase This Document

Need a fresh take? Get an instant paraphrase of this document with our AI Paraphraser
Document Page
linear regression model was applied for projecting the values of number of total entries for 12
and 15vyears which calculated to be 55.6 and 56.17 respectively.
chevron_up_icon
1 out of 8
circle_padding
hide_on_mobile
zoom_out_icon
logo.png

Your All-in-One AI-Powered Toolkit for Academic Success.

Available 24*7 on WhatsApp / Email

[object Object]