Chemical Engineering Lab Report: Spray Tower Experiment and Analysis
VerifiedAdded on 2023/03/23
|22
|3255
|82
Report
AI Summary
This report details an experiment involving a spray tower, a device used for air pollution control and spray drying, focusing on mass and energy balance analysis. The experiment involved heating air, humidifying it within the spray tower, and recycling the air and water. The report includes recorded temperature values and calculations to determine actual energy usage and water consumption. The results, however, showed discrepancies between theoretical and experimental values, attributed to instrument and human errors. The report details the experimental procedure, materials used, and safety measures taken. It presents the results in tables and figures, including calculations for mass of water gained by air, enthalpy changes, and rate of heating. The discussion section explores the challenges in maintaining adiabatic conditions, assumptions made, and potential sources of error within the experimental setup. The conclusion summarizes the findings and suggests recommendations.
Running head: EXPERIMENT LAB REPORT - TOWER SPREY 1
Experiment Lab Report - Tower Spray
Firstname Lastname
Name of Institution
Experiment Lab Report - Tower Spray
Firstname Lastname
Name of Institution
Paraphrase This Document
Need a fresh take? Get an instant paraphrase of this document with our AI Paraphraser
EXPERIMENT LAB REPORT - TOWER SPREY 2
Table of Content
Table of Content..................................................................................................................................2
List of Figures......................................................................................................................................3
List of Tables........................................................................................................................................3
Abstract................................................................................................................................................4
1. Introduction.................................................................................................................................5
1.1. Experiment Objective..........................................................................................................5
2. Theory..........................................................................................................................................5
3. Materials and Methods................................................................................................................6
3.1. Materials...............................................................................................................................6
3.2. Safety....................................................................................................................................6
3.3. Experiment Procedure........................................................................................................6
4. Results..........................................................................................................................................8
4.1. Air heater...........................................................................................................................11
4.2. Spray Tower.......................................................................................................................12
5. Discussion...................................................................................................................................15
Comments on the rate power of the heater..................................................................................15
Comment on Spray tower.............................................................................................................15
Errors.............................................................................................................................................16
6. Conclusions................................................................................................................................16
Recommendations..............................................................................................................................16
References..........................................................................................................................................17
Appendix............................................................................................................................................18
EXPERIMENT LAB REPORT - TOWER SPREY 3
List of Figures
Figure 1: The set-up diagram for the apparatus and instrument.............................................................8
Figure 2: Sample calculation for enthalpy and air flow rate................................................................18
Figure 3: Sample calculation for the mass of water gained by air........................................................19
Figure 4: Sample calculation for the mass DA per hour......................................................................20
Figure 5: Sample calculation for the rate of heating air.......................................................................21
Figure 6: Sample calculation for the enthalpy change for air heater....................................................22
List of Tables
Table 1: Table showing results recorded from experiment....................................................................9
⊘ This is a preview!⊘
Do you want full access?
Subscribe today to unlock all pages.
Trusted by 1+ million students worldwide
EXPERIMENT LAB REPORT - TOWER SPREY 4
Abstract
The spray tower is widely used for air pollution control and spray drying, etc. The study
investigates the spray tower’s mass balance and energy balance. In this experiment, the air
was first heated through air heater and then passed over the modifying process. After the air
absorbing the water moisture and being cool down the existing water and air was recycled.
Five temperature values were recorded and used to compute the actual energy used.
Theoretical mass and energy balance of input and output could have been determined but the
results obtained from the experiment showed that the actual energy used and the amount of
water consumed could not match the theoretical values. There were some errors caused by
faulty instruments and human errors due to improper operation
Paraphrase This Document
Need a fresh take? Get an instant paraphrase of this document with our AI Paraphraser
EXPERIMENT LAB REPORT - TOWER SPREY 5
1. Introduction
Energy balance and steady state mass around a process is an important part of process design
and process analysis. For instance, an operating system at steady state condition conform to
design mass and energy balances which it does not when not in the steady state condition. In
industrially spray tower use as a gas cleaning equipment. Spray tower can be very effective
for air pollution control spray drying and humidification. This experiment spray tower act as
running state adiabatic. During the process air heater humid the water and water level in the
spray tower decreases. Throughout the experiment process mass flows, energy flows and
temperature from six thermometers values were read and tabulated. Using this data, we can
calculate the mass and energy balance in entire system. By comparing calculated and
theoretical values we can estimate the efficiency of the spray tower.
1.1. Experiment Objective
To develop a mass and energy balance of all inputs and outputs from the system and
reconcile any discrepancies between the measured and calculated (expected0 input and output
2. Theory
At steady state condition, the system will be in balance as far as inflows and outflows of
materials are concerned together with the energy dissipation.
The commencement of improving the performance of the plant is by determining where raw
materials are heading towards plus the effect to the energy being supplied.
The lab simulates the operation of a typical operating chemical systmen in which both mass
and energy flows can be determined and measured directly. Furthermore, incase the balance
in the experiment fails to balance, there are provision of calculations to substantiate why
there is no balance. It operates as if you detect the reason why there is waste resources by
using the available reasons.
EXPERIMENT LAB REPORT - TOWER SPREY 6
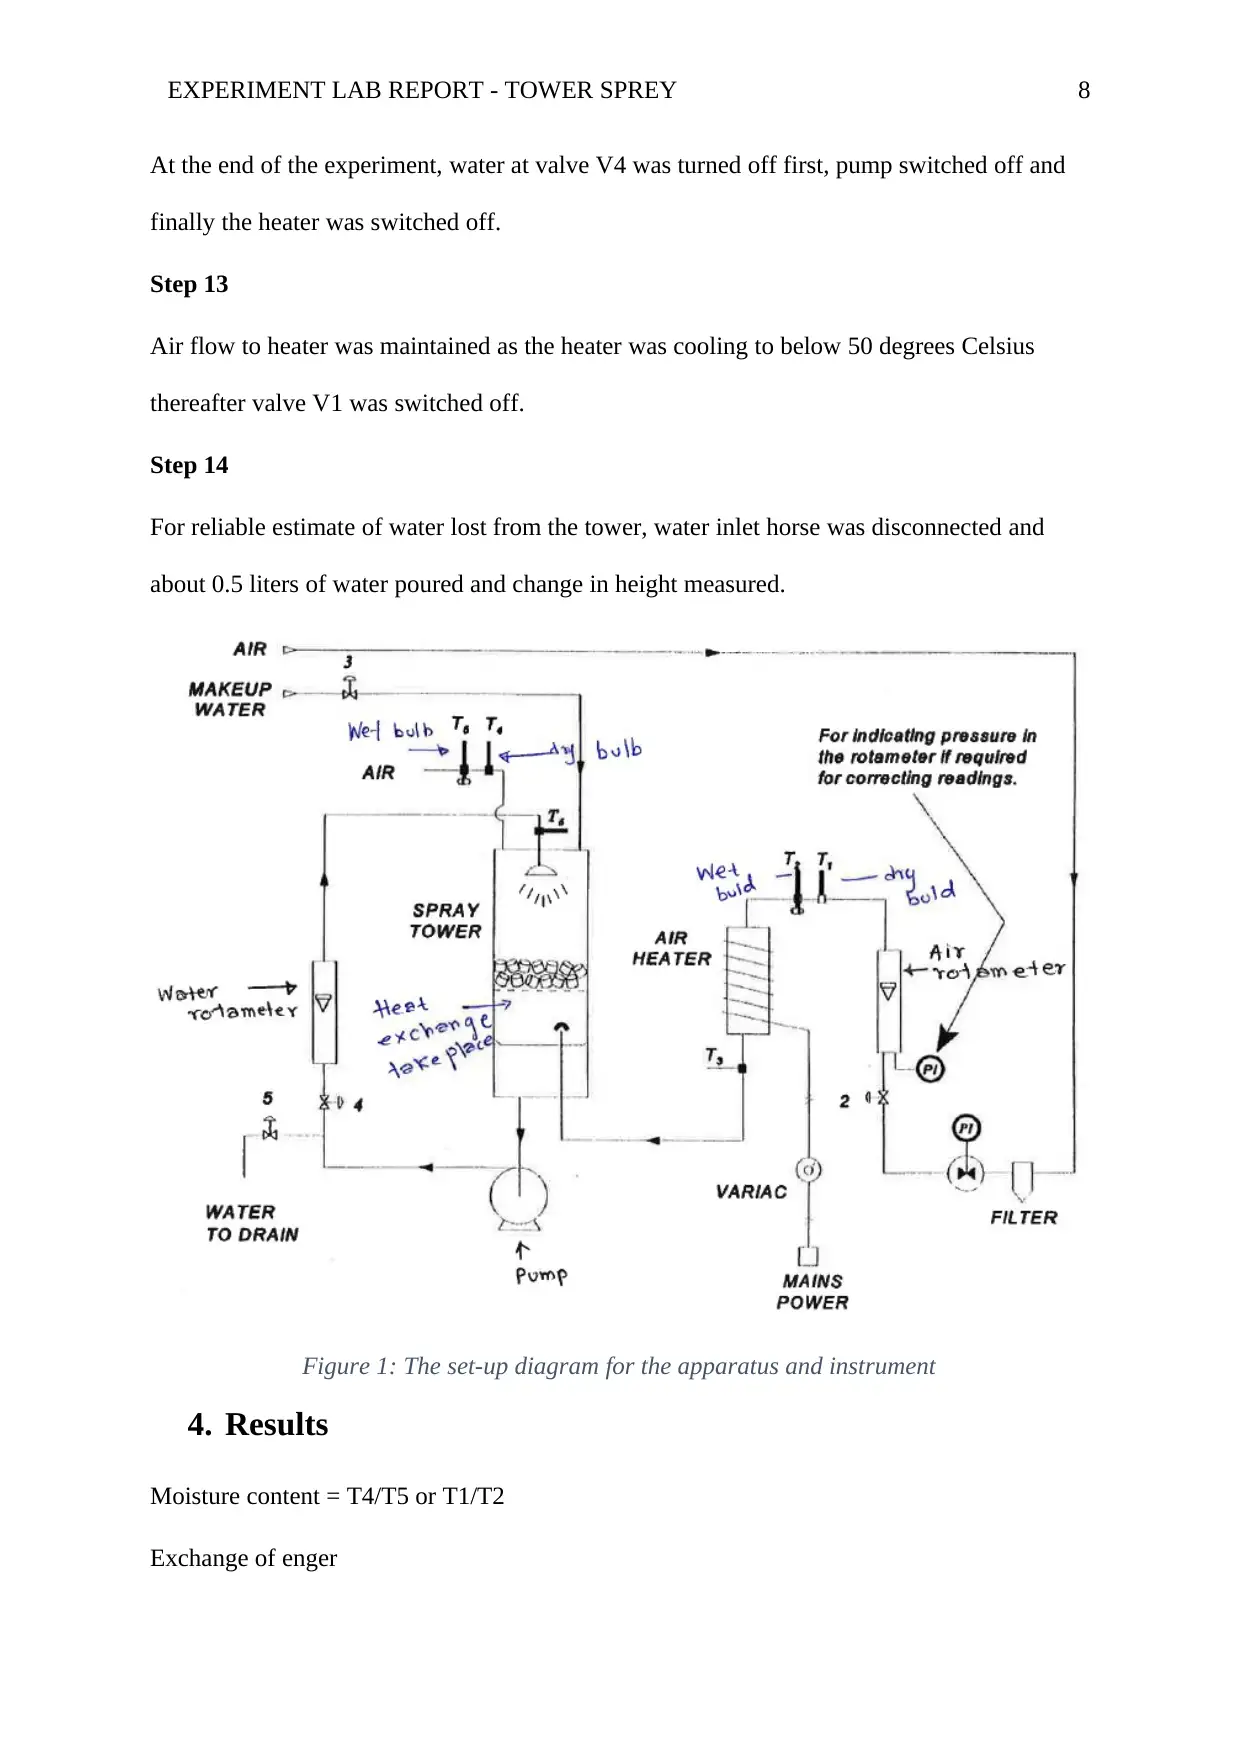
3. Materials and Methods
3.1. Materials
Before starting the experiment, various components as shown in the line diagram were
identified with the corresponding specific apparatus
3.2. Safety
The following safety measures were taken
Safety measure was taken with electrical connections and cables and hot apparatus
Lab coat and safety spectacles were worn
Air heater was switched on through out
When experiment was coming to an end, power supply was turned off first to allow air flow
temperature to be below 50 degrees Celsius.
3.3. Experiment Procedure
Step 1
Check that water reservoirs for the wet bulb thermometer T2 and T5 are full
Step 2
Water in the tower was top up by valve V3 to make the water level in the base of the tower to
be below the inner air tube (with mushroom shaped cap)
Step 3
Valve V2 was maintained closed and the pressure regulator valve V1 was adjusted until the
pressure gauge was approximately 10 psig
Valve V2 was thereafter opened while the flow rate adjusted so that the top of air rotameter
set to a scale reading of 19
care was taken when blowing out the monometer fluid in the simple pressure gauge
Step 4
⊘ This is a preview!⊘
Do you want full access?
Subscribe today to unlock all pages.
Trusted by 1+ million students worldwide
EXPERIMENT LAB REPORT - TOWER SPREY 7
Valve V5 was closed while the pump motor was switched as valve V4 adjusted to set the
upper surface of the water rotameter to a scale reading between 15 to 20
Step 5
The heater was turned on: it was preset to produce an output of 0.5kW, the value was
checked by the supervisor
Step 6
The system was allowed to equilibrate to confirm if the values obtained were less or more of
the constant 15 minutes.
Step 7
All temperatures from T1 to T6 were monitored while valve 2 and 4 were adjusted to
maintain the required flow rates.
Step 8
T3 was monitored and was maintained below 120ºC).
Step 9
Valve V4 was turned off when the equilibrium was reached, tower liquid holds up was
marked and read. The water flow rate was restored to set value left to run for 60 minutes to
100 minutes to give room for decrease in the column water level.
Step 10
The duration of the run, and the liquid level in column was recorded.
Step 11
Temperatures, flow rates, pressures and electrical power input was monitored and recorded
during the time of steady-state operation.
Step 12
Paraphrase This Document
Need a fresh take? Get an instant paraphrase of this document with our AI Paraphraser
EXPERIMENT LAB REPORT - TOWER SPREY 8
At the end of the experiment, water at valve V4 was turned off first, pump switched off and
finally the heater was switched off.
Step 13
Air flow to heater was maintained as the heater was cooling to below 50 degrees Celsius
thereafter valve V1 was switched off.
Step 14
For reliable estimate of water lost from the tower, water inlet horse was disconnected and
about 0.5 liters of water poured and change in height measured.
Figure 1: The set-up diagram for the apparatus and instrument
4. Results
Moisture content = T4/T5 or T1/T2
Exchange of enger
EXPERIMENT LAB REPORT - TOWER SPREY 9
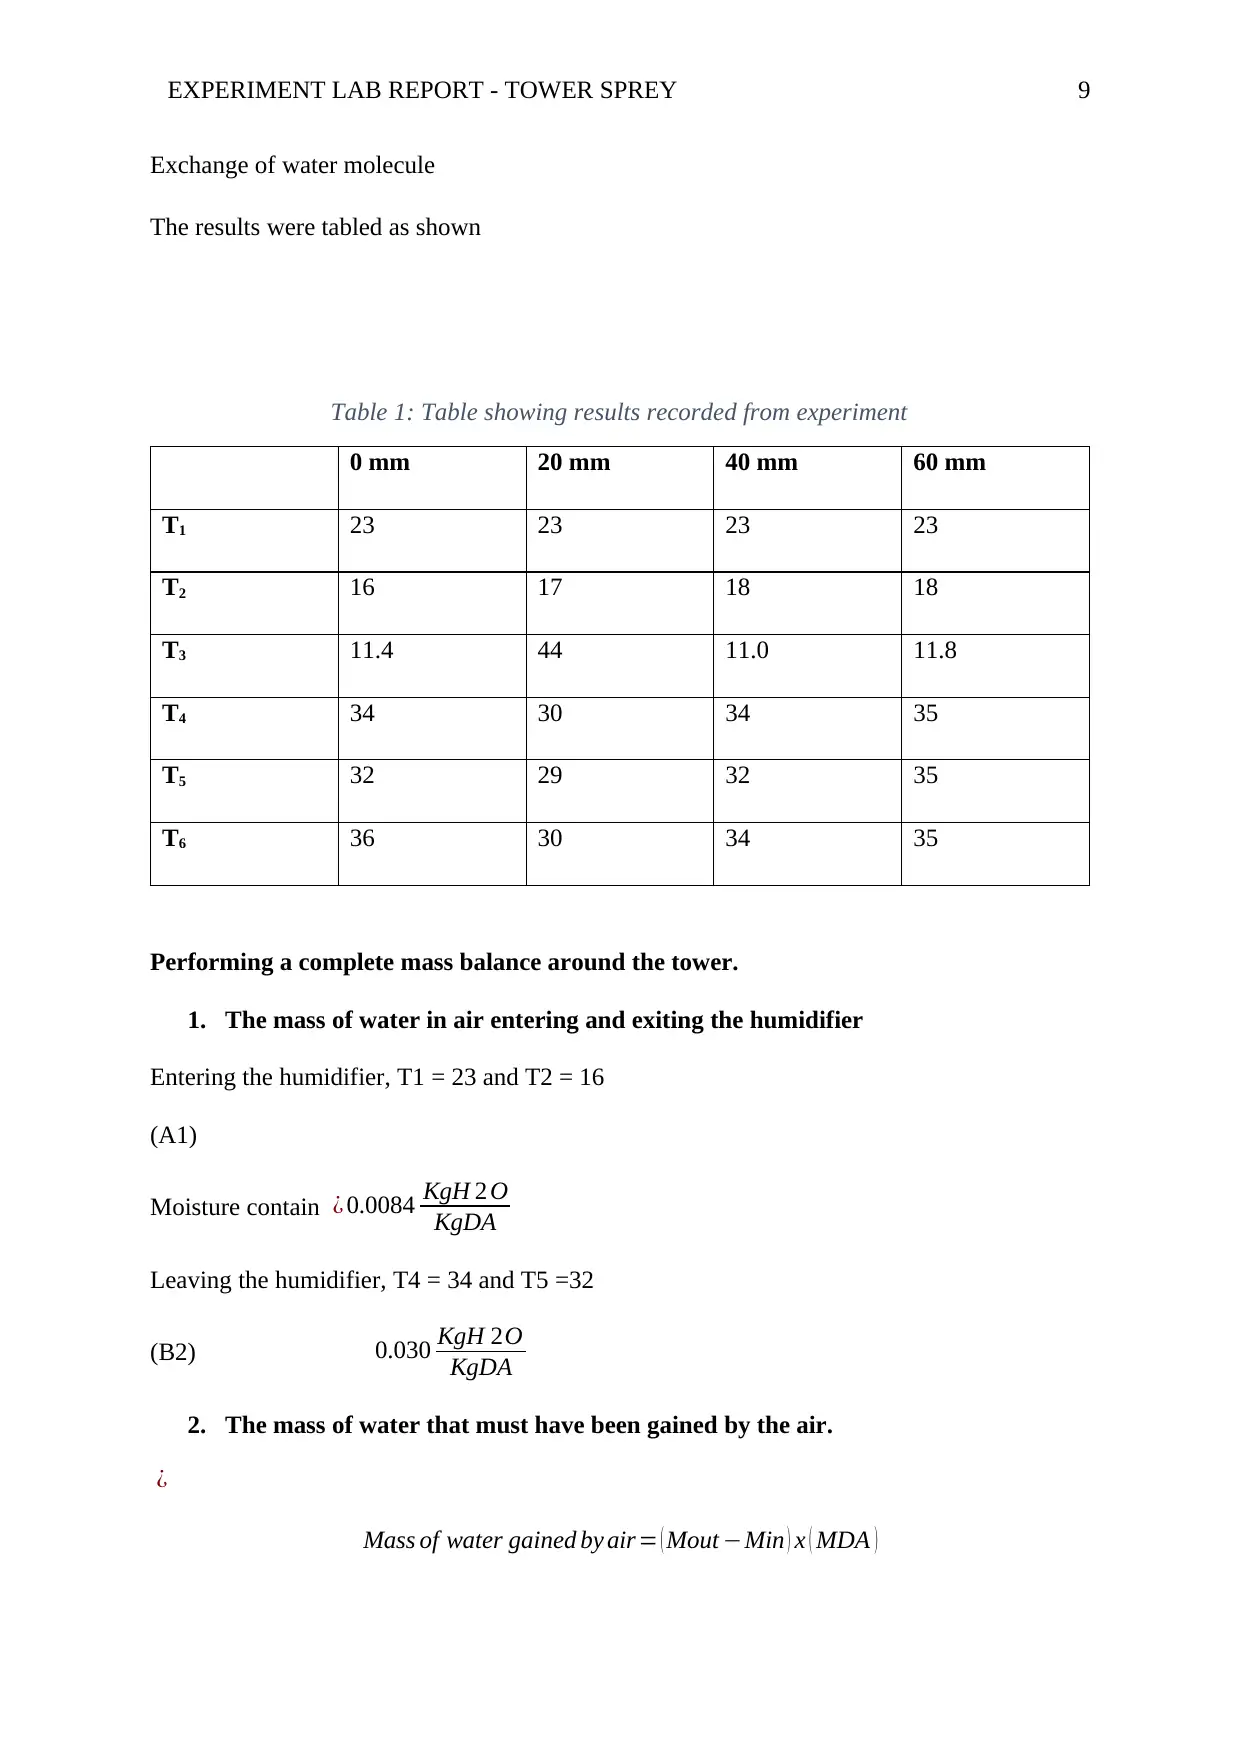
Exchange of water molecule
The results were tabled as shown
Table 1: Table showing results recorded from experiment
0 mm 20 mm 40 mm 60 mm
T1 23 23 23 23
T2 16 17 18 18
T3 11.4 44 11.0 11.8
T4 34 30 34 35
T5 32 29 32 35
T6 36 30 34 35
Performing a complete mass balance around the tower.
1. The mass of water in air entering and exiting the humidifier
Entering the humidifier, T1 = 23 and T2 = 16
(A1)
Moisture contain ¿ 0.0084 KgH 2 O
KgDA
Leaving the humidifier, T4 = 34 and T5 =32
(B2) 0.030 KgH 2O
KgDA
2. The mass of water that must have been gained by the air.
¿
Mass of water gained by air= ( Mout −Min ) x ( MDA )
⊘ This is a preview!⊘
Do you want full access?
Subscribe today to unlock all pages.
Trusted by 1+ million students worldwide
EXPERIMENT LAB REPORT - TOWER SPREY 10
( B− A ) x MassDA Kg air DA
mass∈¿ ¿
Mass of DA= flow rate
Humid Volume =0.85 m3
KgDA
Mass of DA= ( flow rate=68 L
mi )
0.85 ( m3
KgDA )
¿ 0.08 KgDA
Mass∈¿ ¿
Mass of DA=0.08 Kg . DA x 60=4.8 KgDA
h
Mass of water by= ( B− A )
¿ 0.030 KgH 2O
KgDA −0.0084 KgH 2 O
KgDA
¿ 0.0216 KgH 2O
KgDA
¿ 0.0216 x 40.8=0.10368 KgH 2 O
h
¿ 0.104 KgH 2 O
h x 100 g
Kg
After one hour, water will be lost ¿ 103.68 gH 2O
h ,104 ml , H 2O
h
After 1 hour 104 ml H2O will lost that is mass of water lost h
3. Comparing and commenting the value of mass of water which must gained with
the mass of water loss measured according to the change in the water height in
the column
104 ml H 2O
h ,mass of water gained by 1 hour
add water =1500 ml
¿ lost water =265+15=280 ml
Paraphrase This Document
Need a fresh take? Get an instant paraphrase of this document with our AI Paraphraser
EXPERIMENT LAB REPORT - TOWER SPREY 11
¿ 1500−280
Actual add=1220 ml
103 ml compared with 1220 ml amount to = lost of ten times the amount of water
This is due to water leaking through spray tower bottom and top and through T5 water leak
as well.
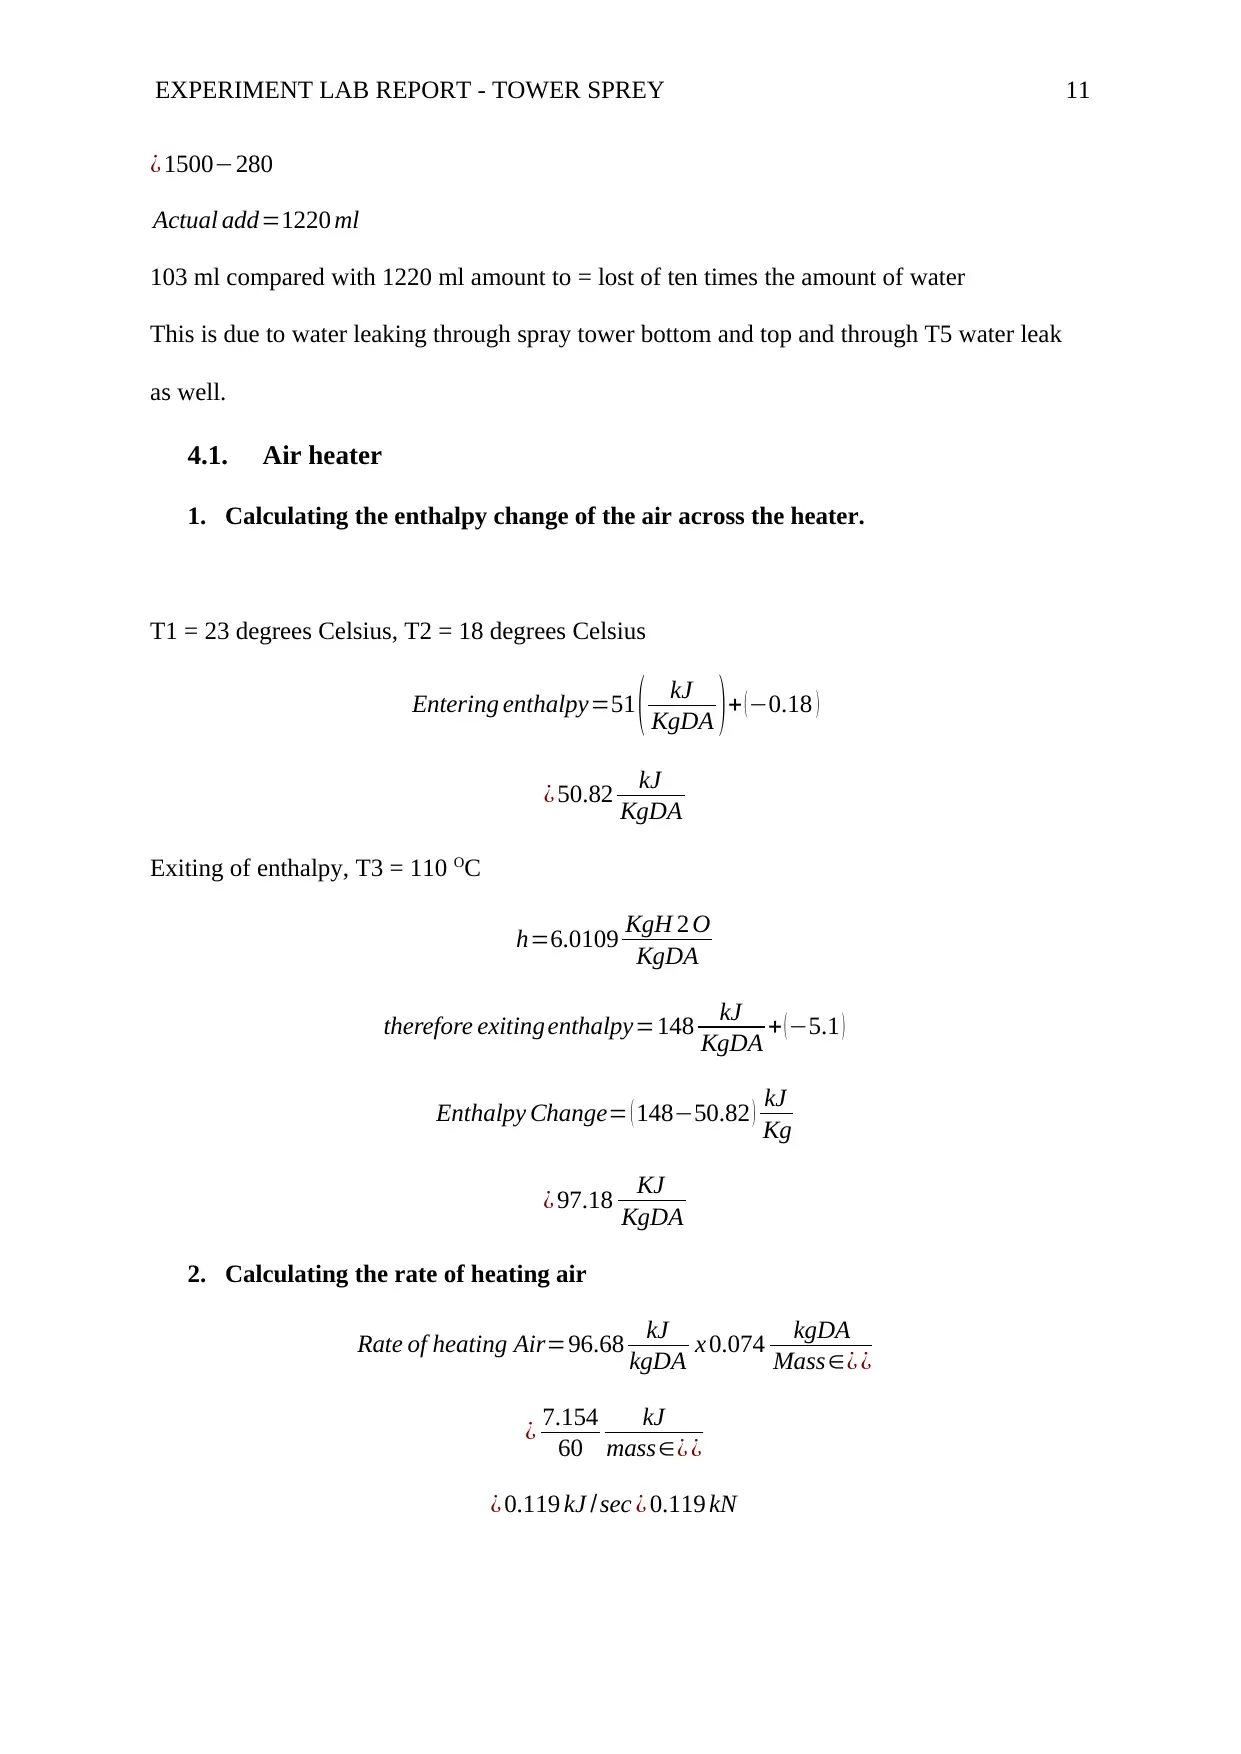
4.1. Air heater
1. Calculating the enthalpy change of the air across the heater.
T1 = 23 degrees Celsius, T2 = 18 degrees Celsius
Entering enthalpy=51 ( kJ
KgDA ) + ( −0.18 )
¿ 50.82 kJ
KgDA
Exiting of enthalpy, T3 = 110 OC
h=6.0109 KgH 2 O
KgDA
therefore exiting enthalpy=148 kJ
KgDA + (−5.1 )
Enthalpy Change= ( 148−50.82 ) kJ
Kg
¿ 97.18 KJ
KgDA
2. Calculating the rate of heating air
Rate of heating Air=96.68 kJ
kgDA x 0.074 kgDA
Mass∈¿ ¿
¿ 7.154
60
kJ
mass∈¿ ¿
¿ 0.119 kJ /sec ¿ 0.119 kN
¿ 1500−280
Actual add=1220 ml
103 ml compared with 1220 ml amount to = lost of ten times the amount of water
This is due to water leaking through spray tower bottom and top and through T5 water leak
as well.
4.1. Air heater
1. Calculating the enthalpy change of the air across the heater.
T1 = 23 degrees Celsius, T2 = 18 degrees Celsius
Entering enthalpy=51 ( kJ
KgDA ) + ( −0.18 )
¿ 50.82 kJ
KgDA
Exiting of enthalpy, T3 = 110 OC
h=6.0109 KgH 2 O
KgDA
therefore exiting enthalpy=148 kJ
KgDA + (−5.1 )
Enthalpy Change= ( 148−50.82 ) kJ
Kg
¿ 97.18 KJ
KgDA
2. Calculating the rate of heating air
Rate of heating Air=96.68 kJ
kgDA x 0.074 kgDA
Mass∈¿ ¿
¿ 7.154
60
kJ
mass∈¿ ¿
¿ 0.119 kJ /sec ¿ 0.119 kN
EXPERIMENT LAB REPORT - TOWER SPREY 12
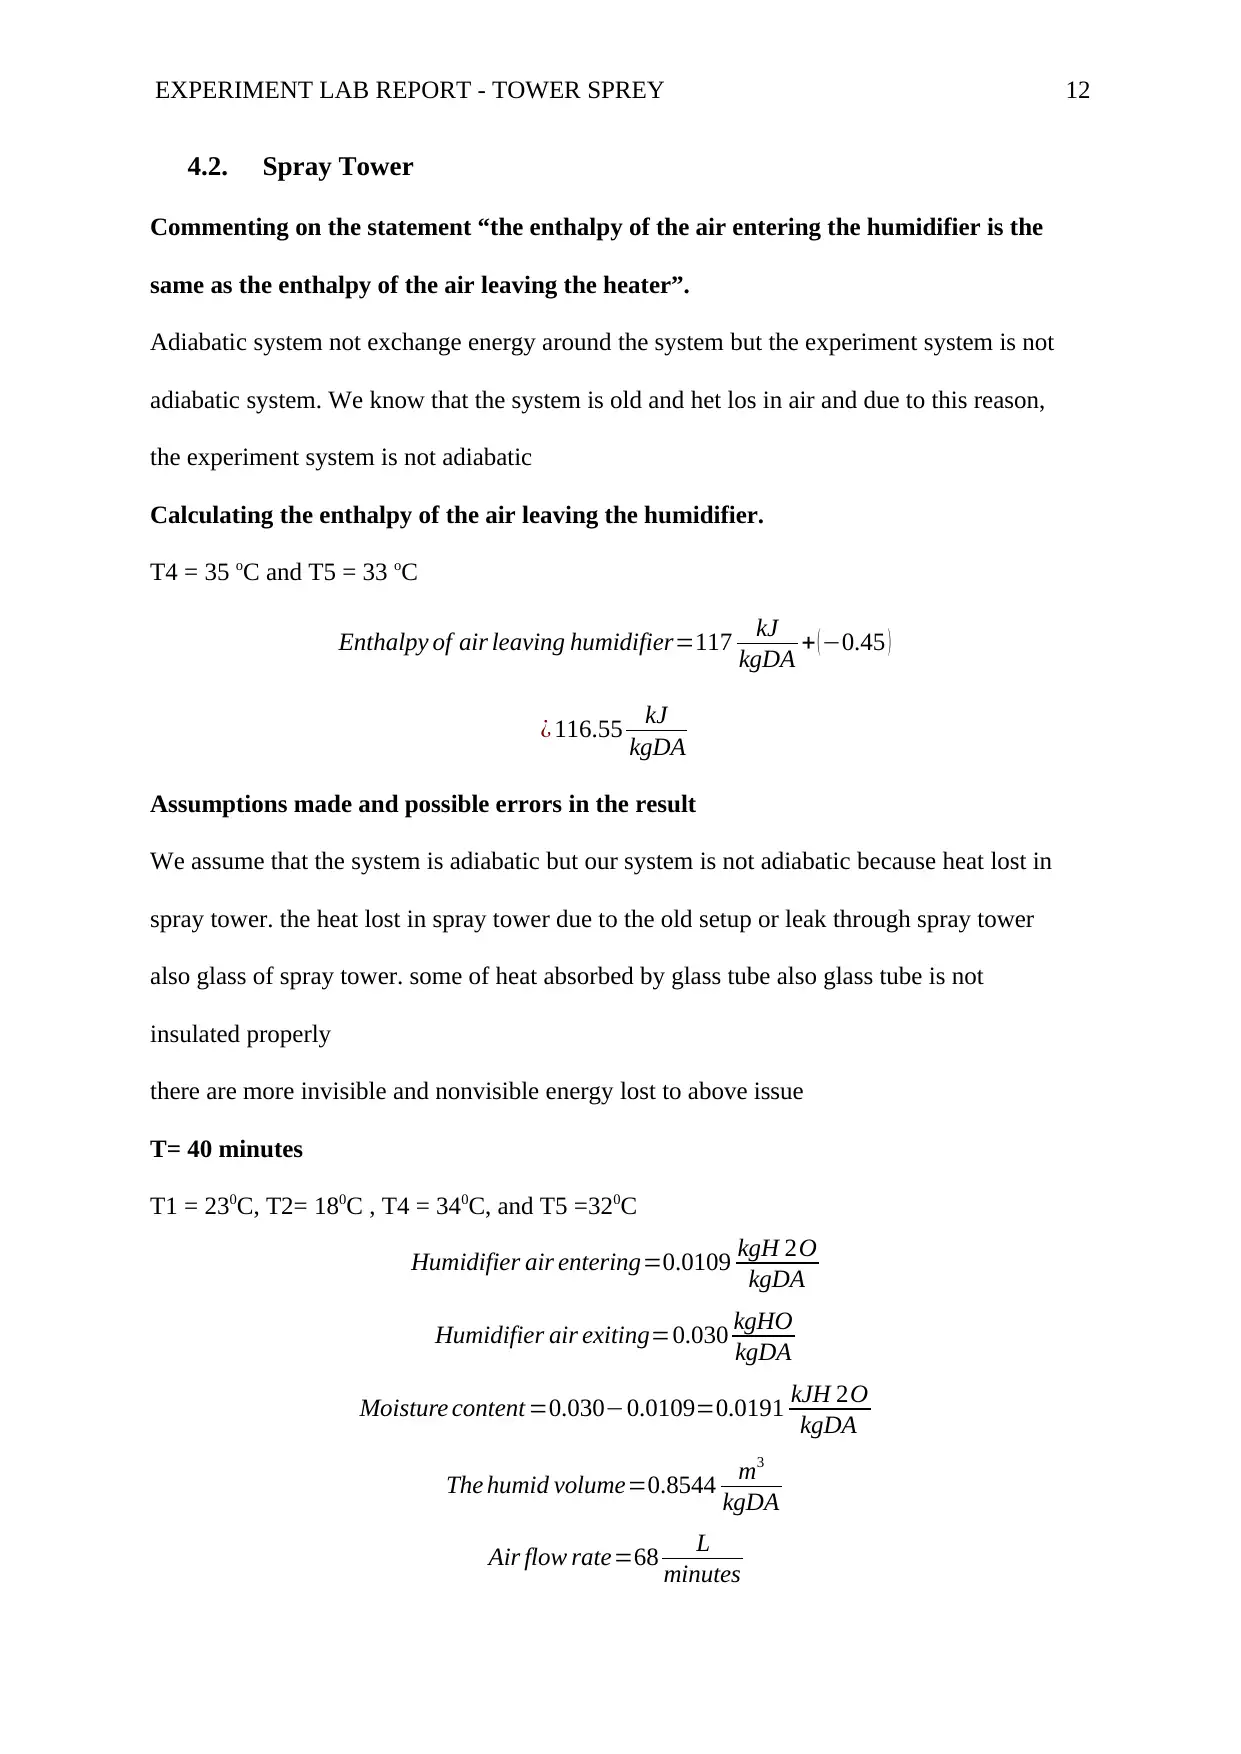
4.2. Spray Tower
Commenting on the statement “the enthalpy of the air entering the humidifier is the
same as the enthalpy of the air leaving the heater”.
Adiabatic system not exchange energy around the system but the experiment system is not
adiabatic system. We know that the system is old and het los in air and due to this reason,
the experiment system is not adiabatic
Calculating the enthalpy of the air leaving the humidifier.
T4 = 35 oC and T5 = 33 oC
Enthalpy of air leaving humidifier=117 kJ
kgDA + (−0.45 )
¿ 116.55 kJ
kgDA
Assumptions made and possible errors in the result
We assume that the system is adiabatic but our system is not adiabatic because heat lost in
spray tower. the heat lost in spray tower due to the old setup or leak through spray tower
also glass of spray tower. some of heat absorbed by glass tube also glass tube is not
insulated properly
there are more invisible and nonvisible energy lost to above issue
T= 40 minutes
T1 = 230C, T2= 180C , T4 = 340C, and T5 =320C
Humidifier air entering=0.0109 kgH 2O
kgDA
Humidifier air exiting=0.030 kgHO
kgDA
Moisture content =0.030−0.0109=0.0191 kJH 2O
kgDA
The humid volume=0.8544 m3
kgDA
Air flow rate=68 L
minutes
⊘ This is a preview!⊘
Do you want full access?
Subscribe today to unlock all pages.
Trusted by 1+ million students worldwide
1 out of 22
Related Documents


Your All-in-One AI-Powered Toolkit for Academic Success.
+13062052269
info@desklib.com
Available 24*7 on WhatsApp / Email
![[object Object]](/_next/static/media/star-bottom.7253800d.svg)
Unlock your academic potential
Copyright © 2020–2026 A2Z Services. All Rights Reserved. Developed and managed by ZUCOL.