Analysis of Chemical Fertilizer Impact on Maize Yields in Kenya
VerifiedAdded on 2023/06/04
|21
|2220
|220
Report
AI Summary
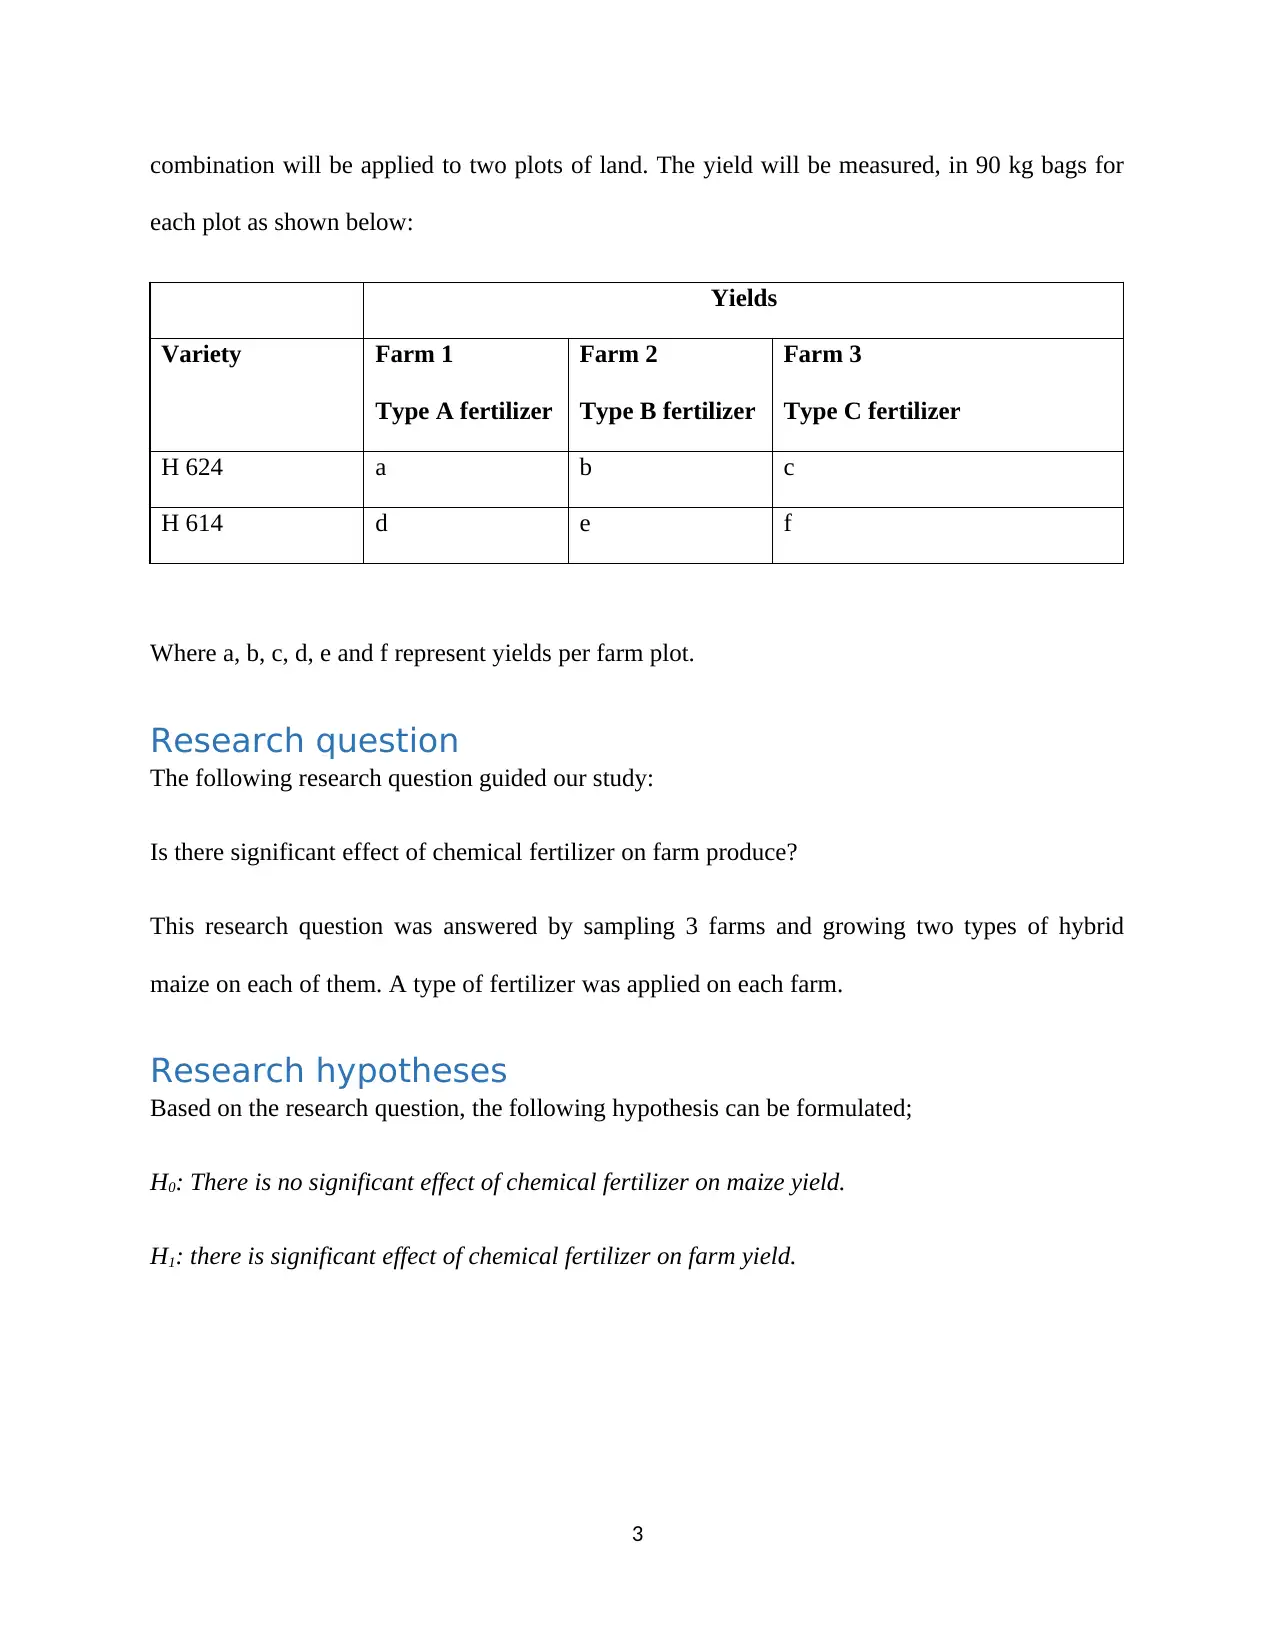
This report investigates the impact of chemical fertilizers on maize crop production through an experiment conducted in Kenya. The study compares the effects of different fertilizer types (A, B, and C) on two maize varieties (H 624 and H 614) across multiple farm plots. Data was collected and analyzed using IBM SPSS, including normality tests, descriptive statistics, and ANOVA. The results indicate a significant effect of chemical fertilizers on maize yields, leading to the rejection of the null hypothesis. Post hoc tests, such as Tukey HSD, were performed to determine specific differences between fertilizer types. The report concludes that different fertilizers lead to varying yields, and recommends farmers choose appropriate fertilizers for optimal crop production based on local conditions. The study provides detailed data collection records, experiment design, and analysis, offering valuable insights into agricultural practices and fertilizer effectiveness.

Assessing the impact of Chemical Fertilizers
on Crop Production
on Crop Production
Paraphrase This Document
Need a fresh take? Get an instant paraphrase of this document with our AI Paraphraser

Table of Contents
Introduction.................................................................................................................................................2
Research question.......................................................................................................................................3
Research hypotheses...................................................................................................................................3
Methods......................................................................................................................................................4
Data collection and analysis........................................................................................................................5
Results and discussion.................................................................................................................................6
Conclusion and Recommendations...........................................................................................................17
Conclusion.................................................................................................................................................17
Recommendations.....................................................................................................................................17
References.................................................................................................................................................18
1

Introduction
Agriculture plays a vital role toward growth of economies of economic blocks, states and
countries. It has been theorized that advances in the agricultural sector can promote shifts in
labor to higher productivity sectors that offer higher income. However, agricultural production
threshold in Africa and the developing world has not been met (Angela Lusigi, 1998).
Empirical research has recently outlined the significance of agriculture in the long term reduction
of poverty indices in Africa. However, for agricultural production to achieve this, measures have
to be put in place for driving structural change in the way agriculture is carried out. Introduction
and use of chemical fertilizers is one of these measures.
Supplying nutritious, safe and affordable food to a growing population is one of the issues facing
Africa at the moment. Achieving food security for her populace is by far a desirable thing. Many
factors are negatively affecting agricultural production potential in Africa some of which are soil
degradation, salinization of irrigated areas and climate change (BISHWAJIT GHOSE, 2014).
Yields of hybrid maize (Zea mays) could be low when grown below optimum management
practices and conditions. Use of improved varieties and optimum nitrogen fertilizer will unlock
the high yielding potential of hybrid maize.
This study was carried out to investigate the effect of applying different types of farm fertilizer
on two varieties of maize H 624 and H 614. These two breeds are maize hybrids grown in
Kenya, Africa. More specifically the question is whether or not manipulating the variety of
fertilizer applied to maize breeds affects the farm yields of maize.
This paper presents results and discussions of an experiment that was conducted to test two
varieties of maize in Kenya. Each variety will be tested with two types of fertilizers. Each
2
⊘ This is a preview!⊘
Do you want full access?
Subscribe today to unlock all pages.

Trusted by 1+ million students worldwide

combination will be applied to two plots of land. The yield will be measured, in 90 kg bags for
each plot as shown below:
Yields
Variety Farm 1
Type A fertilizer
Farm 2
Type B fertilizer
Farm 3
Type C fertilizer
H 624 a b c
H 614 d e f
Where a, b, c, d, e and f represent yields per farm plot.
Research question
The following research question guided our study:
Is there significant effect of chemical fertilizer on farm produce?
This research question was answered by sampling 3 farms and growing two types of hybrid
maize on each of them. A type of fertilizer was applied on each farm.
Research hypotheses
Based on the research question, the following hypothesis can be formulated;
H0: There is no significant effect of chemical fertilizer on maize yield.
H1: there is significant effect of chemical fertilizer on farm yield.
3
Paraphrase This Document
Need a fresh take? Get an instant paraphrase of this document with our AI Paraphraser

Methods
The analysis contained in this report consists of experimental data that was obtained from
secondary sources. The experiment was carried out by application of different types of fertilizers
on 3 farms, type A, type B and type 3 on plot 1, 2 and 3 respectively. Each farm was subdivided
into two plots. H 624 was planted in one plot and H 614 on the plot of each farm.
The method of data collection was through an experiment. A controlled study was carried out in
which we attempted to understand cause and effect relationship between chemical fertilizer
application and farm yields of maize.
Application of type A, type B and type C fertilizers were the treatments (independent variables)
while maize crop yields per acre formed the group scores (dependent variable) as a result of the
applied treatments. The fertilizer types were selected at random. A randomized complete block
(RCB) design was therefore designed for purposes of analysis.
For comparability purposes, fertilizer inputs were standardized. Equal rates of type A, type B and
type C fertilizers were applied on the farm plots. Experimental plots were variously irrigated at
equal rates at the jointing stage ensuring that all factors of crop production were met, fertilizer
application being the only varying factor.
The treatments were examined on whether they had a causal effect on the dependent variable.
Data collection and analysis
The farm plots were examined for purposes of this research. Response of crop to different
fertilizer types was recorded by examining leaf size and stem girth. This procedure was done
4

periodically till the crop attained maximum growth. At harvesting, the outer two rows of the
crops were not harvested for purposes of eliminating edge effects.
Each plot harvest was recorded for purposes of comparing the different yields per plot. Extra
moisture was removed from the maize grains by drying in the sun before measuring the weights.
The dried grains were packaged into 90kg bags and the number of bags obtained from each farm
plot sub section recorded.
This analysis was conducted using the IBM Statistical Package for Social Sciences (INM SPSS)
version 22.
Data source
Data
source
name
Source
organization
Data
descrip
tion
Data
form
at
URL Charg
e fee
Target
data
source
Data
1
Kenya
government
ministry of
agriculture
Maze
yields
.txt
https://www.kenyans.co.ke/government/
ministry-agriculture-livestock-fisheries
0.00 Yes
Data 2 Food and
agriculture
organisation
Maize
harvest
.txt
www.fao.org/kenya/en/
1.
2.
0.00 yes
Data collected
Yields
5
⊘ This is a preview!⊘
Do you want full access?
Subscribe today to unlock all pages.

Trusted by 1+ million students worldwide

Variety Farm 1
Type A
fertilizer
Farm 2
Type B
fertilizer
Farm 3
Type C
fertilizer
Farm 4
Type A fertilizer
Farm 5
Type B Fertilizer
H 624 20 23 19 19 24
H 614 18 20 17 17 19
Only three of the farms were sampled for purposes of the study as shown below.
Yields
Variety Farm 1
Type A fertilizer
Farm 2
Type B fertilizer
Farm 3
Type C fertilizer
H 624 20 23 19
H 614 18 20 17
Results and discussion
The average maize yields for the four plot sub sections varied between 18 to 22-90 kg bags.
6
Paraphrase This Document
Need a fresh take? Get an instant paraphrase of this document with our AI Paraphraser

Normality check
Tests for normality were performed on the independent and dependent variables and Q-Q plots
plotted.
Tests of Normalitya
Treatment
Kolmogorov-Smirnovb
Statistic df Sig.
Farm output Type A .260 2 .
a. Treatment = Type A
b. Lilliefors Significance Correction
7
Tests for normality were performed on the independent and dependent variables and Q-Q plots
plotted.
Tests of Normalitya
Treatment
Kolmogorov-Smirnovb
Statistic df Sig.
Farm output Type A .260 2 .
a. Treatment = Type A
b. Lilliefors Significance Correction
7

Tests of Normalitya
Treatment
Kolmogorov-Smirnovb
Statistic df Sig.
Farm output Type B .260 2 .
a. Treatment = Type B
b. Lilliefors Significance Correction
8
Treatment
Kolmogorov-Smirnovb
Statistic df Sig.
Farm output Type B .260 2 .
a. Treatment = Type B
b. Lilliefors Significance Correction
8
⊘ This is a preview!⊘
Do you want full access?
Subscribe today to unlock all pages.

Trusted by 1+ million students worldwide

9
Paraphrase This Document
Need a fresh take? Get an instant paraphrase of this document with our AI Paraphraser

Tests of Normalitya
Treatment
Kolmogorov-Smirnovb
Statistic df Sig.
Farm output Type C .260 2 .
a. Treatment = Type C
b. Lilliefors Significance Correction
10
Treatment
Kolmogorov-Smirnovb
Statistic df Sig.
Farm output Type C .260 2 .
a. Treatment = Type C
b. Lilliefors Significance Correction
10

The above plots suggest that the normality assumption is met.
Univariate analysis
Treatment: Type A
Descriptivesa
Treatment Statistic Std. Error
Farm output Type A Mean 19.00 1.000
95% Confidence Interval for
Mean
Lower Bound 6.29
Upper Bound 31.71
5% Trimmed Mean .
Median 19.00
Variance 2.000
Std. Deviation 1.414
Minimum 18
Maximum 20
11
Univariate analysis
Treatment: Type A
Descriptivesa
Treatment Statistic Std. Error
Farm output Type A Mean 19.00 1.000
95% Confidence Interval for
Mean
Lower Bound 6.29
Upper Bound 31.71
5% Trimmed Mean .
Median 19.00
Variance 2.000
Std. Deviation 1.414
Minimum 18
Maximum 20
11
⊘ This is a preview!⊘
Do you want full access?
Subscribe today to unlock all pages.

Trusted by 1+ million students worldwide
1 out of 21
Your All-in-One AI-Powered Toolkit for Academic Success.
+13062052269
info@desklib.com
Available 24*7 on WhatsApp / Email
Unlock your academic potential
Copyright © 2020–2025 A2Z Services. All Rights Reserved. Developed and managed by ZUCOL.