Chemistry Lab Report 8: Measurement and Significant Figures Experiment
VerifiedAdded on 2022/08/29
|9
|848
|20
Report
AI Summary
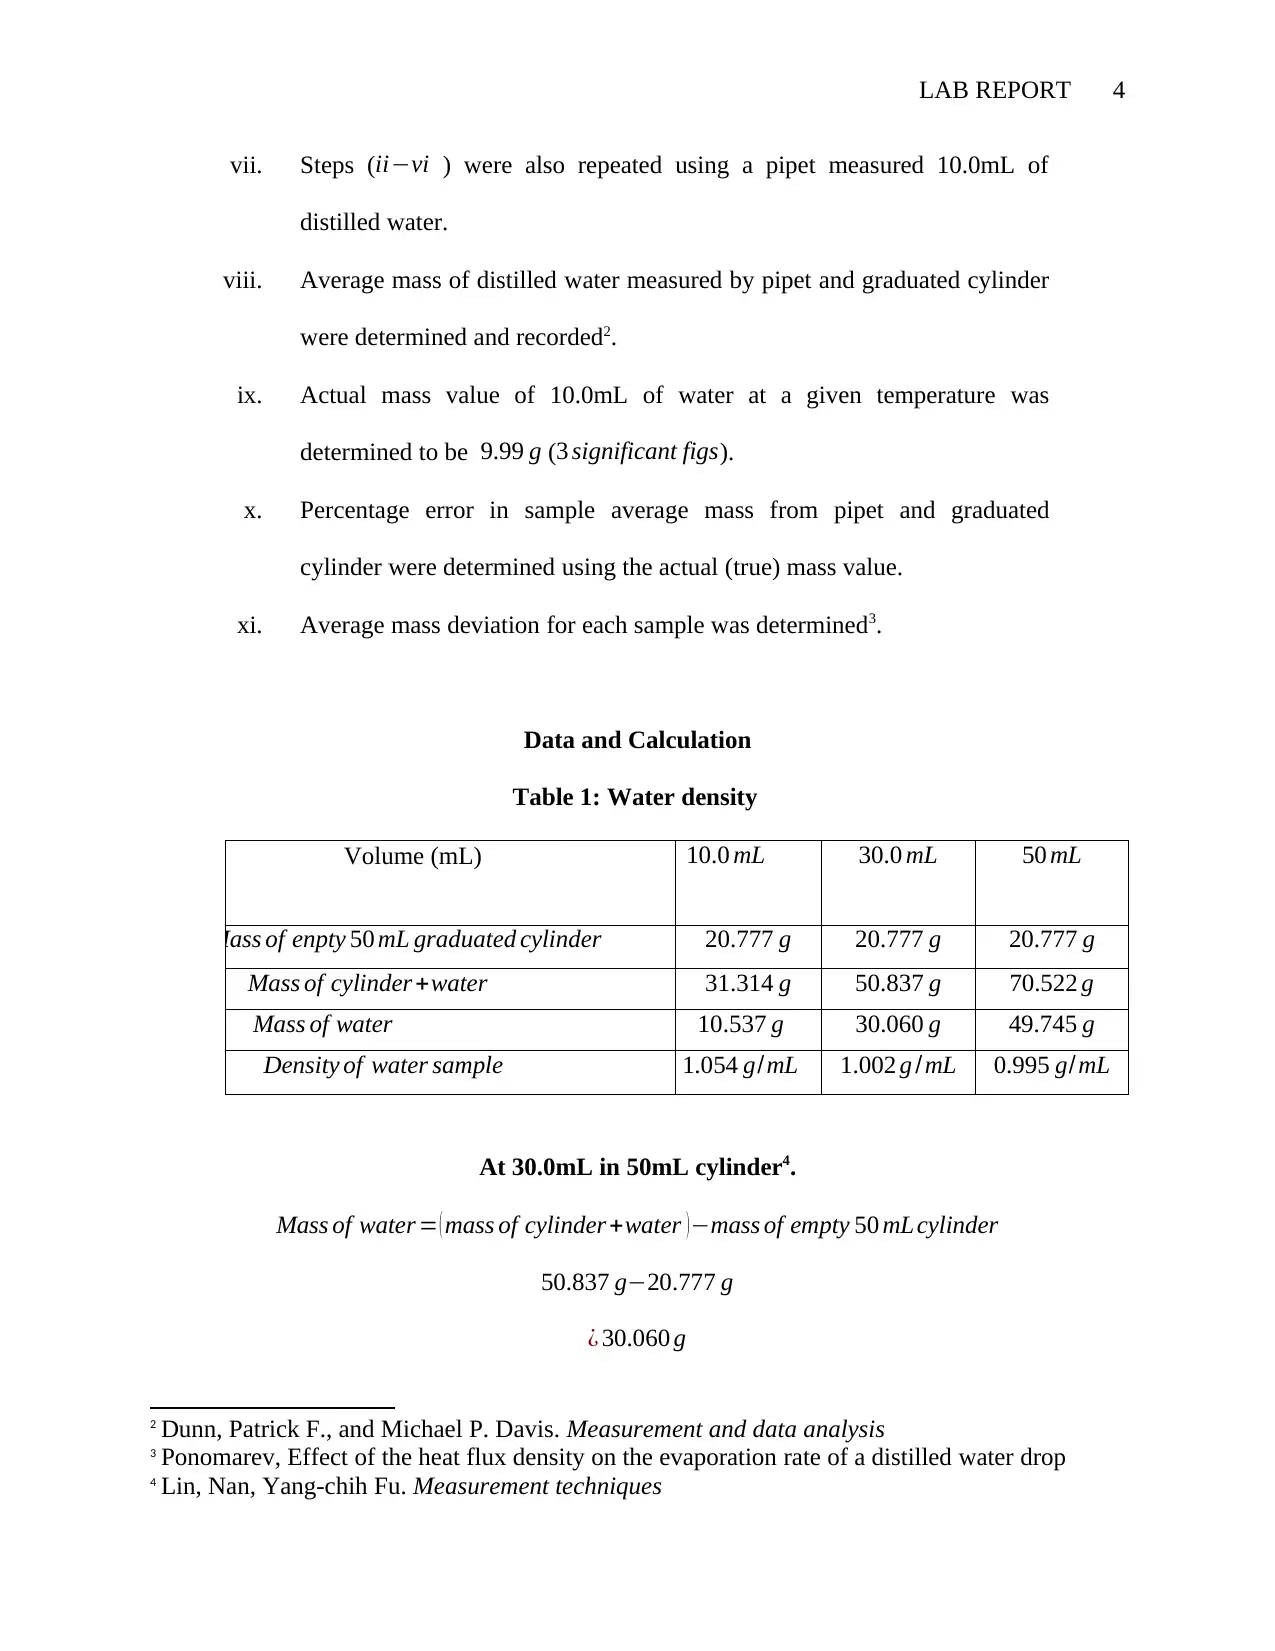
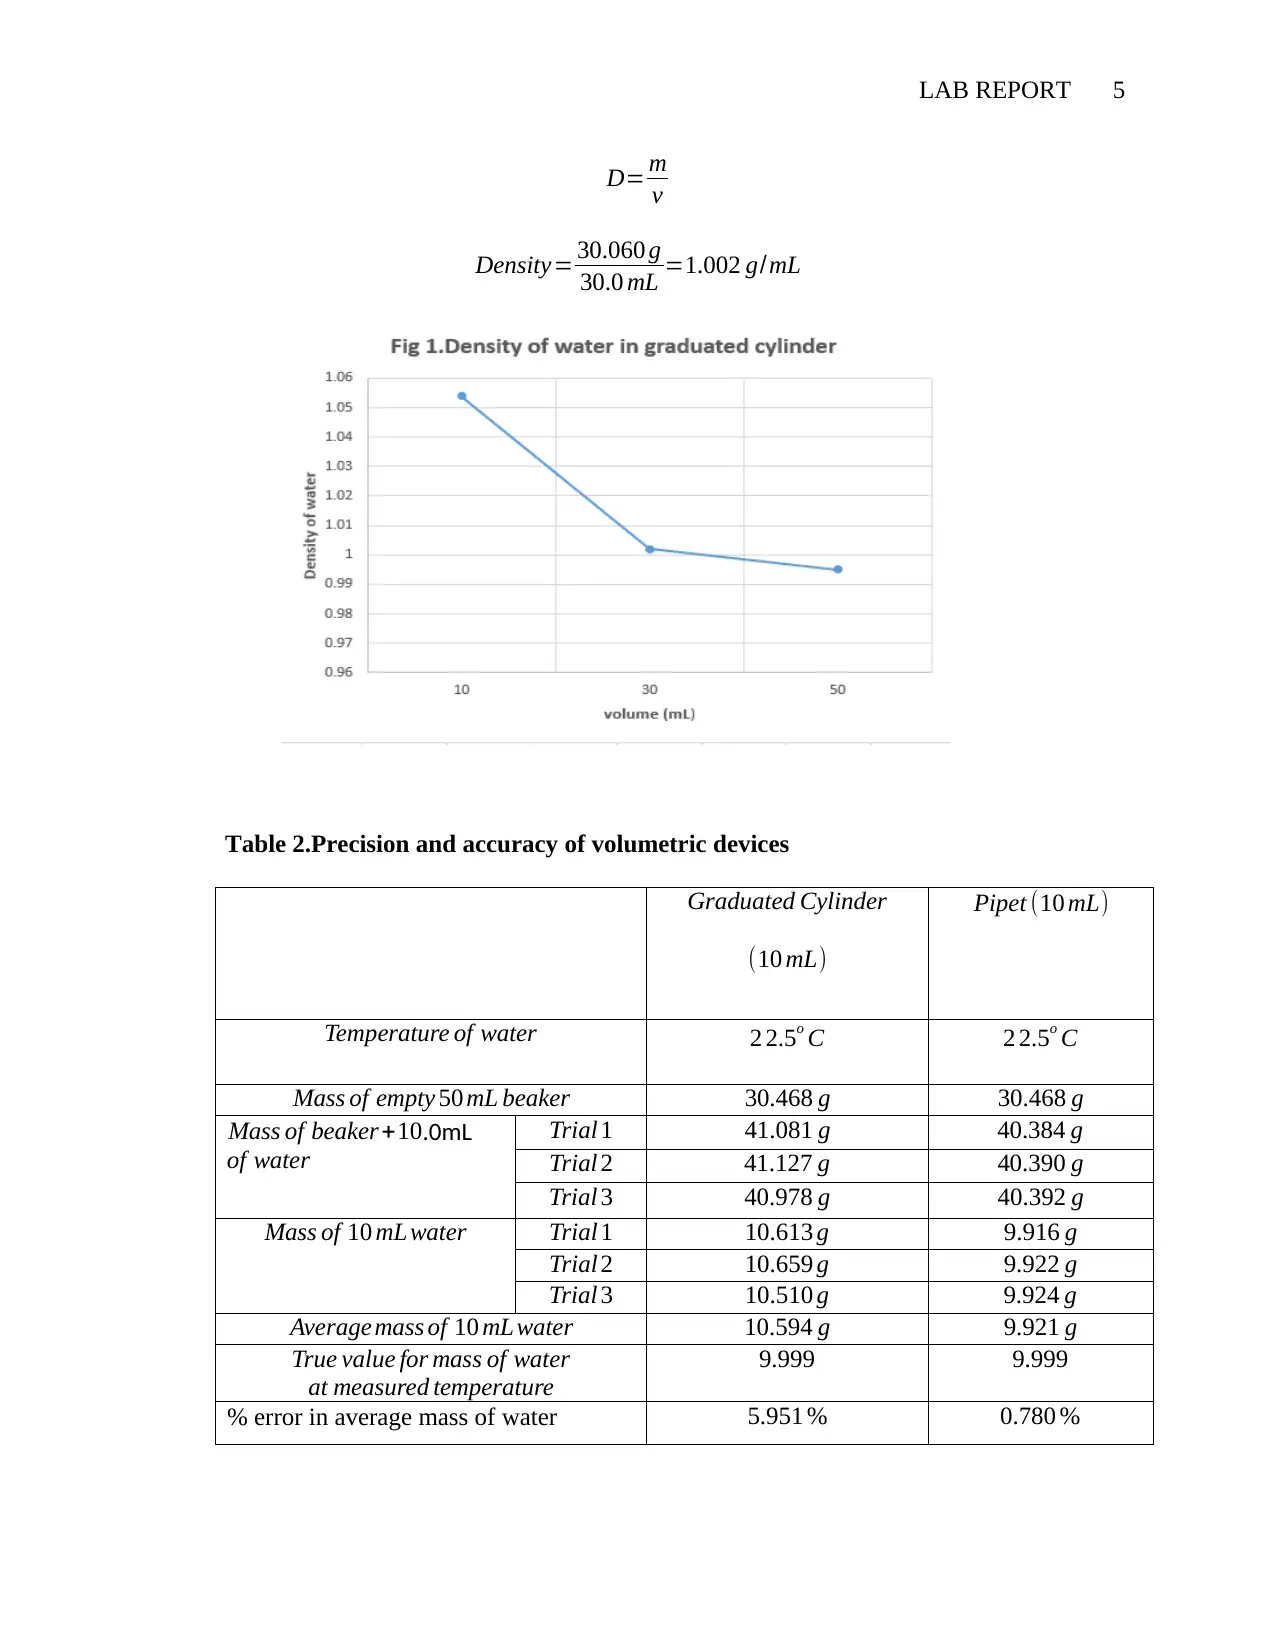
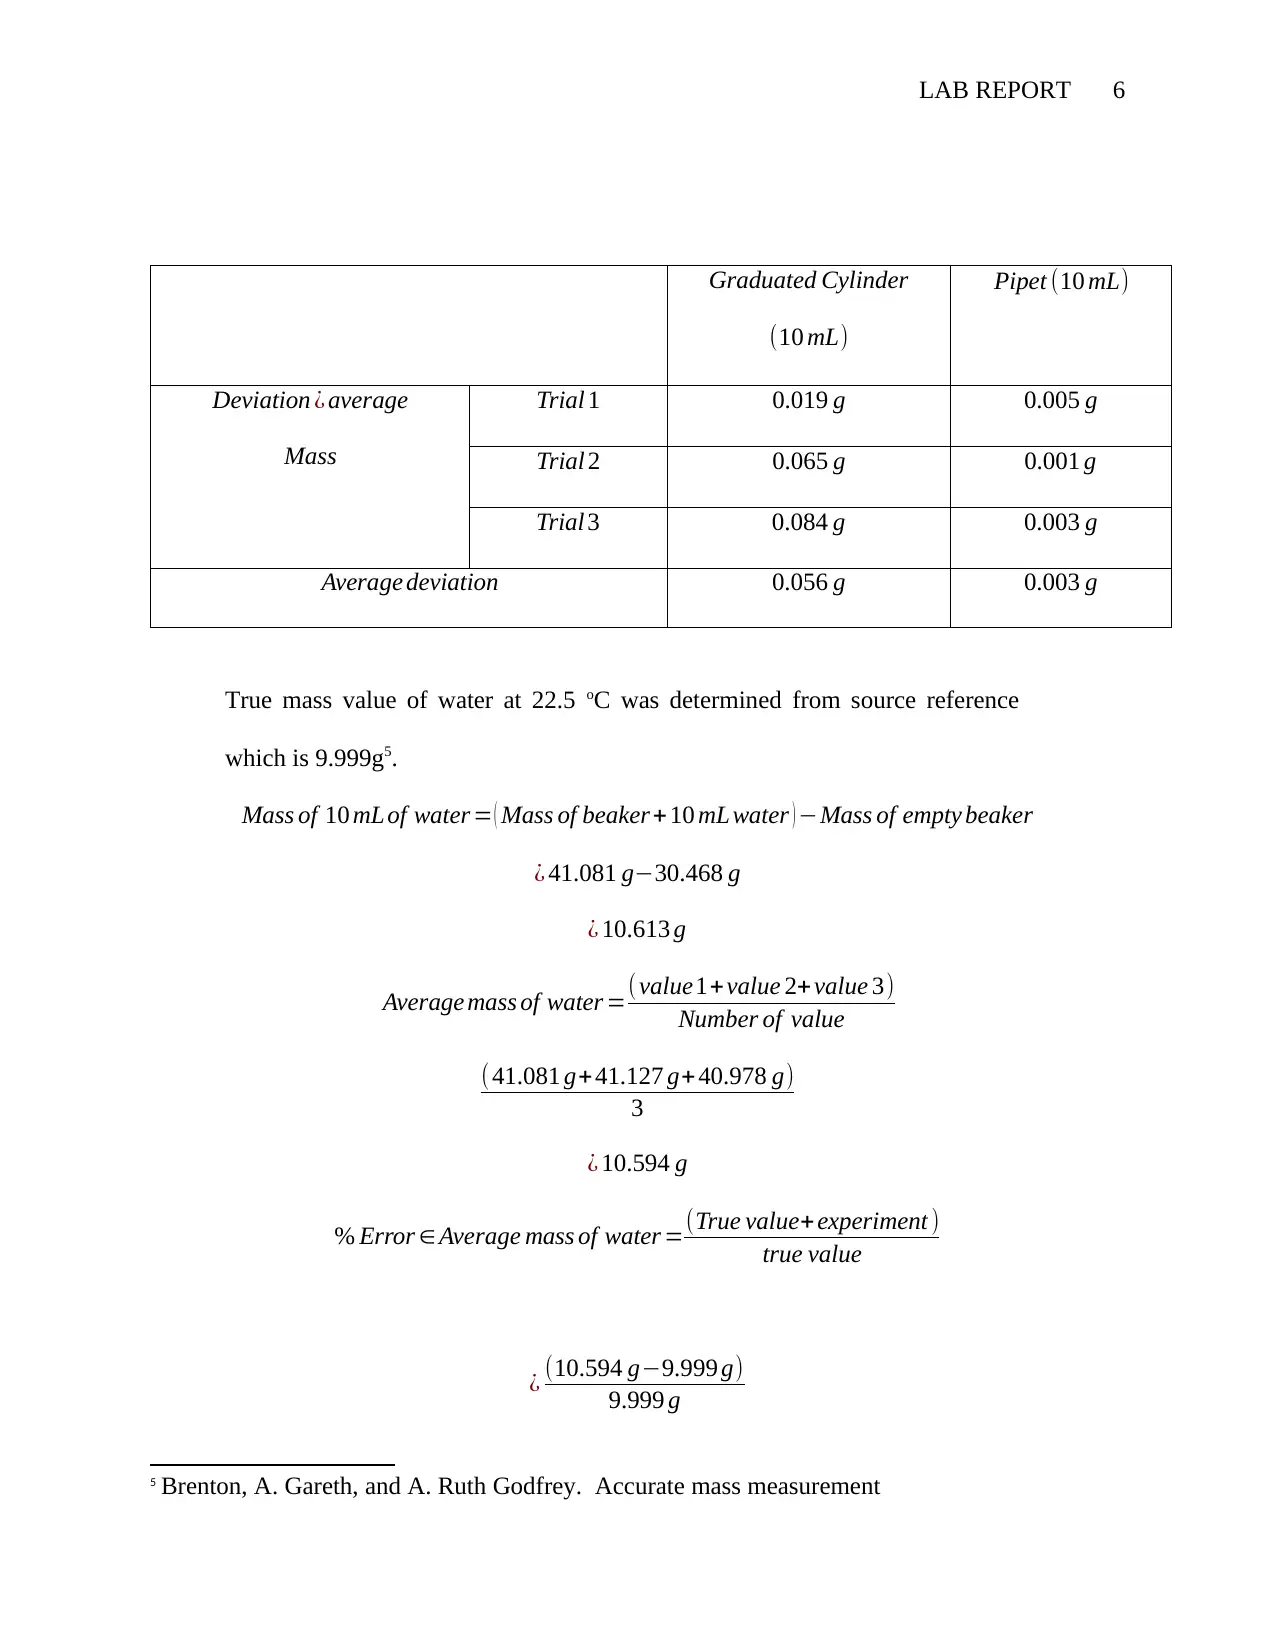
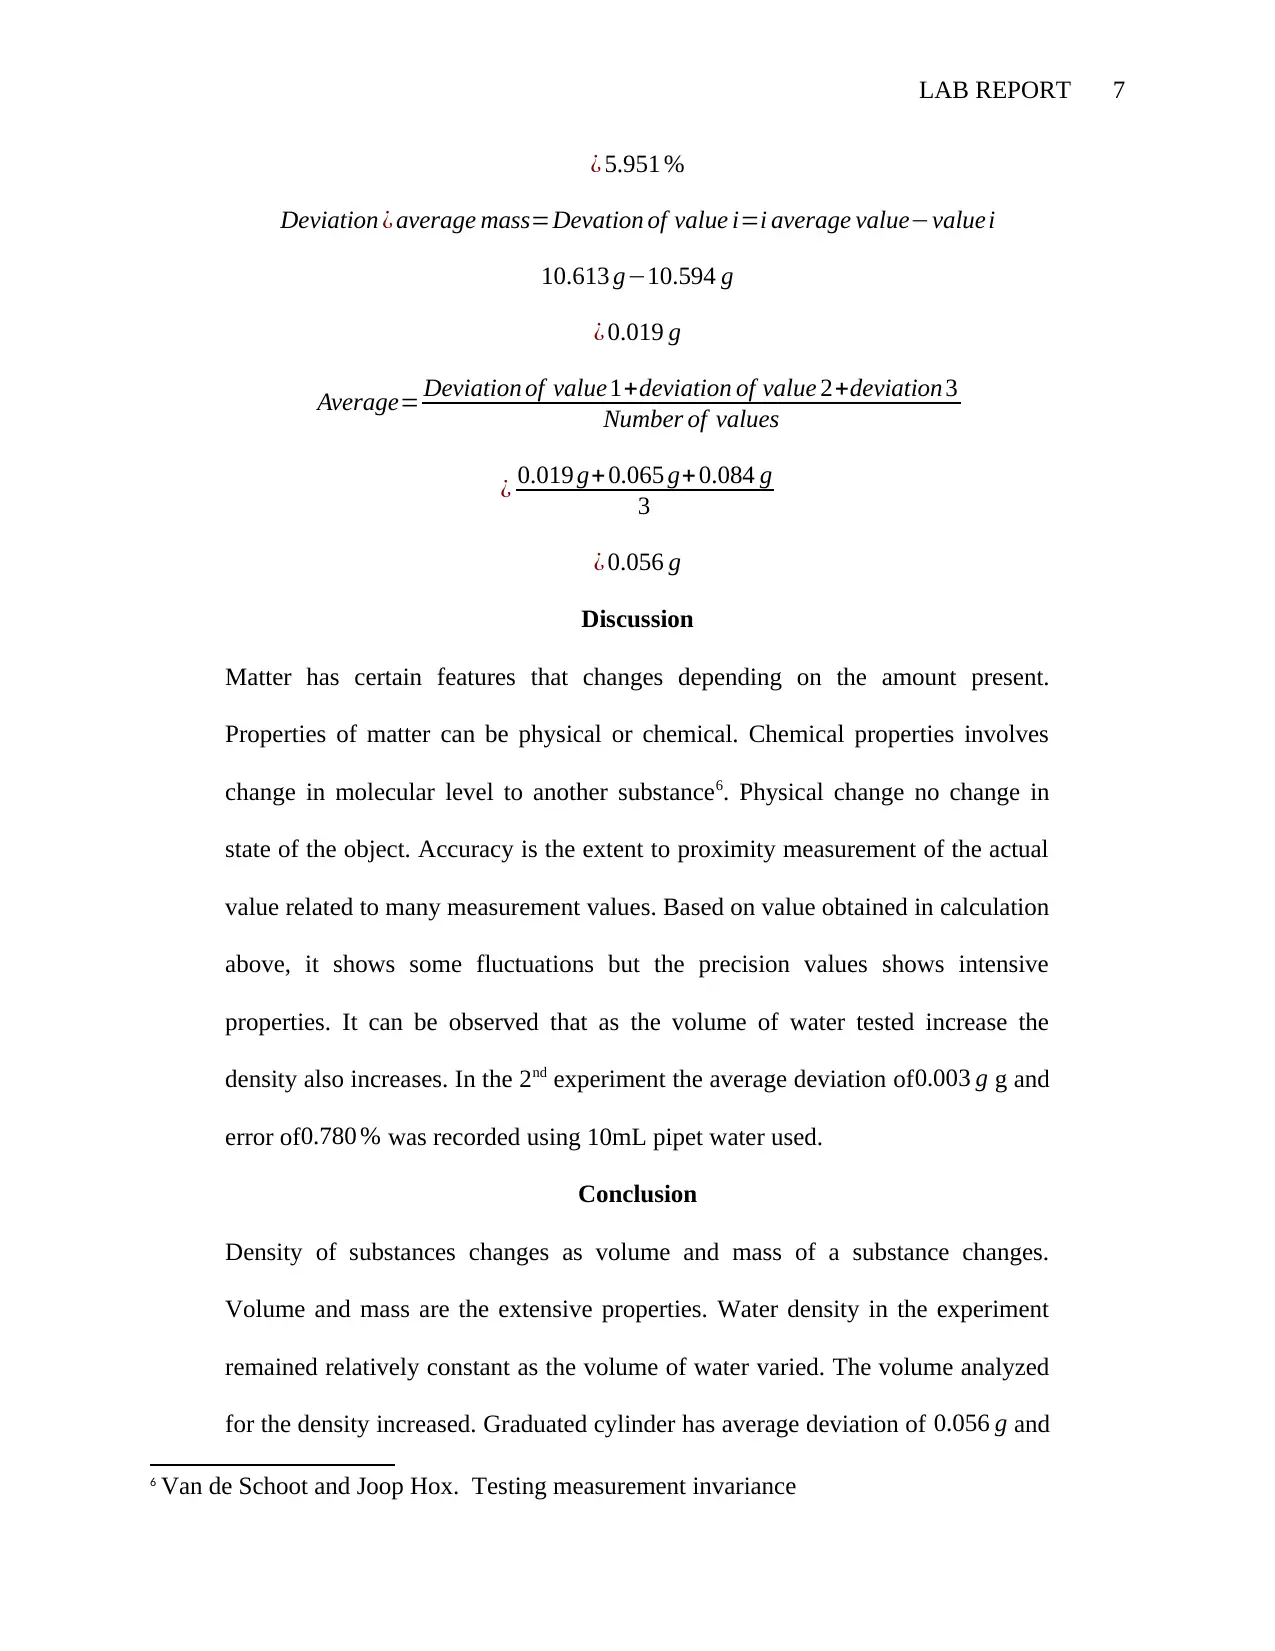
This lab report details a chemistry experiment focused on measurement and significant figures. The objectives were to accurately read scales, report measurements with correct significant figures, and assess precision and accuracy. The experiment involved determining the density of water using a graduated cylinder and examining the precision and accuracy of volumetric devices (graduated cylinder and pipet). Data was collected and analyzed to calculate the density of water, average mass deviation, and percentage error. The results showed that the density of water remained relatively constant, and the pipet provided more accurate measurements compared to the graduated cylinder. The report includes procedures, data tables, calculations, discussion of findings, and conclusions, along with references to support the analysis.

LAB REPORT 1
MEASUREMENT AND SIGNIFICANT FIGURES EXPERIMENT
By Name
Course
Instructor
Institution
Location
Date: 25/03/2020
MEASUREMENT AND SIGNIFICANT FIGURES EXPERIMENT
By Name
Course
Instructor
Institution
Location
Date: 25/03/2020
Paraphrase This Document
Need a fresh take? Get an instant paraphrase of this document with our AI Paraphraser

LAB REPORT 2
Objectives:
i. To read scale correctly and report the measurements with precise
significant figures.
ii. To learn how to report precise significant figures in calculation results
involving measurements.
iii. To assess precision and accuracy in measurements by comparing of
measured value and true value.
iv. To represent determined data by use of graphs.
Requirements
i. Distilled water
ii. Analytical balance
iii. Dropper
iv. Alcohol
v. 10 mL pipet
vi. 50 mL Graduated Cylinder
vii. 50 mL Beaker
viii. 150 mL Beaker
ix. 25 mL Graduated Cylinder
Procedure
1st Part: Density of water
i. 50mL dry and clean graduated cylinder was weighed on balance and its
mass recorded1.
1 Pedhazur, Elazar J., and Liora Pedhazur Schmelkin. Measurement, design, and
analysis

LAB REPORT 3
ii. 10mL distilled water was added into a cylinder .9mL was first added to the
cylinder and the remaining was added by use of a dropper up to the mark.
iii. Cylinder with 10mL of water was weighed and its mass recorded.
iv. Using the same 2nd step procedure, water was added to 30.0mL mark.
The cylinder with 30.0mL of water is weighed and its mass recorded.
v. Using the same method 2 and 4, the water was added to 50.0 mark then
weighed and mass recorded.
vi. Mass of water was calculated by getting the difference in mass between
the empty cylinder from10.0 mL, 30 mL and 50.0 mL cylinders.
vii. Density of water is determined by use of the formulaD= m
v .
2nd Part: Precision and Accuracy of volumetric devices.
i. 100mL of distilled water was poured into 150mL beaker .Water
temperature was recorded using alcohol thermometer.
ii. 50mL beaker was weighed using analytical balance and mass recorded.
iii. 10.0mL distilled water was measured by use of 25mL graduated cylinder
(using the same procedure used in part 1 above) and then added into 50mL
beaker.
iv. 10mL (with water) beaker was weighed and mass recorded.
v. Mass of distilled water was calculated by getting the difference between
masses of 50mL empty beaker from mass of beaker with 10ml of water.
vi. The steps(ii−v ) were repeated 2 more times to find multiple data (trials).
⊘ This is a preview!⊘
Do you want full access?
Subscribe today to unlock all pages.

Trusted by 1+ million students worldwide

LAB REPORT 4
vii. Steps (ii−vi ) were also repeated using a pipet measured 10.0mL of
distilled water.
viii. Average mass of distilled water measured by pipet and graduated cylinder
were determined and recorded2.
ix. Actual mass value of 10.0mL of water at a given temperature was
determined to be 9.99 g (3 significant figs).
x. Percentage error in sample average mass from pipet and graduated
cylinder were determined using the actual (true) mass value.
xi. Average mass deviation for each sample was determined3.
Data and Calculation
Table 1: Water density
Volume (mL) 10.0 mL 30.0 mL 50 mL
Mass of enpty 50 mL graduated cylinder 20.777 g 20.777 g 20.777 g
Mass of cylinder +water 31.314 g 50.837 g 70.522 g
Mass of water 10.537 g 30.060 g 49.745 g
Density of water sample 1.054 g/mL 1.002 g /mL 0.995 g/mL
At 30.0mL in 50mL cylinder4.
Mass of water = ( mass of cylinder +water )−mass of empty 50 mL cylinder
50.837 g−20.777 g
¿ 30.060 g
2 Dunn, Patrick F., and Michael P. Davis. Measurement and data analysis
3 Ponomarev, Effect of the heat flux density on the evaporation rate of a distilled water drop
4 Lin, Nan, Yang-chih Fu. Measurement techniques
Paraphrase This Document
Need a fresh take? Get an instant paraphrase of this document with our AI Paraphraser

LAB REPORT 5
D= m
v
Density= 30.060 g
30.0 mL =1.002 g/mL
Table 2.Precision and accuracy of volumetric devices
Graduated Cylinder
(10 mL)
Pipet (10 mL)
Temperature of water 2 2.5o C 2 2.5o C
Mass of empty 50 mL beaker 30.468 g 30.468 g
Mass of beaker+10.0mL
of water
Trial 1 41.081 g 40.384 g
Trial 2 41.127 g 40.390 g
Trial 3 40.978 g 40.392 g
Mass of 10 mL water Trial 1 10.613 g 9.916 g
Trial 2 10.659 g 9.922 g
Trial 3 10.510 g 9.924 g
Average mass of 10 mL water 10.594 g 9.921 g
True value for mass of water
at measured temperature
9.999 9.999
% error in average mass of water 5.951 % 0.780 %

LAB REPORT 6
Graduated Cylinder
(10 mL)
Pipet (10 mL)
Deviation ¿ average
Mass
Trial 1 0.019 g 0.005 g
Trial 2 0.065 g 0.001 g
Trial 3 0.084 g 0.003 g
Average deviation 0.056 g 0.003 g
True mass value of water at 22.5 oC was determined from source reference
which is 9.999g5.
Mass of 10 mL of water = ( Mass of beaker + 10 mL water ) −Mass of empty beaker
¿ 41.081 g−30.468 g
¿ 10.613 g
Average mass of water =( value1+value 2+ value 3)
Number of value
( 41.081 g+41.127 g+ 40.978 g)
3
¿ 10.594 g
% Error ∈ Average mass of water =(True value+ experiment )
true value
¿ (10.594 g−9.999 g)
9.999 g
5 Brenton, A. Gareth, and A. Ruth Godfrey. Accurate mass measurement
⊘ This is a preview!⊘
Do you want full access?
Subscribe today to unlock all pages.

Trusted by 1+ million students worldwide

LAB REPORT 7
¿ 5.951 %
Deviation ¿ average mass=Devation of value i=i average value−valuei
10.613 g−10.594 g
¿ 0.019 g
Average= Deviation of value1+deviation of value 2+deviation 3
Number of values
¿ 0.019 g+ 0.065 g+ 0.084 g
3
¿ 0.056 g
Discussion
Matter has certain features that changes depending on the amount present.
Properties of matter can be physical or chemical. Chemical properties involves
change in molecular level to another substance6. Physical change no change in
state of the object. Accuracy is the extent to proximity measurement of the actual
value related to many measurement values. Based on value obtained in calculation
above, it shows some fluctuations but the precision values shows intensive
properties. It can be observed that as the volume of water tested increase the
density also increases. In the 2nd experiment the average deviation of 0.003 g g and
error of0.780 % was recorded using 10mL pipet water used.
Conclusion
Density of substances changes as volume and mass of a substance changes.
Volume and mass are the extensive properties. Water density in the experiment
remained relatively constant as the volume of water varied. The volume analyzed
for the density increased. Graduated cylinder has average deviation of 0.056 g and
6 Van de Schoot and Joop Hox. Testing measurement invariance
Paraphrase This Document
Need a fresh take? Get an instant paraphrase of this document with our AI Paraphraser

LAB REPORT 8
the one of the pipet is 0.003g.The pipet values are more accurate with smaller
deviation compared to one of graduated cylinder with error percentage of 0.780%
and 5.951 % respectively.
References
Brenton, A. Gareth, and A. Ruth Godfrey. 2010. "Accurate mass measurement:
terminology and treatment of data." Journal of the American Society for Mass
Spectrometry 1821-1835.
Dunn, Patrick F., and Michael P. Davis. 2017. Measurement and data analysis for
engineering and science. New York: CRC press.

LAB REPORT 9
Lin, Nan, Yang-chih Fu, and Ray-May Hsung. 2017. The position generator:
Measurement techniques for investigations of social capital. Routledge.
Pedhazur, Elazar J., and Liora Pedhazur Schmelkin. 2013. "Measurement, design, and
analysis." An integrated approach 13-15.
Ponomarev, Konstantin, Evgeniya Orlova, and Dmitry Feoktistov. 2016. "Effect of the
heat flux density on the evaporation rate of a distilled water drop." In EPJ Web of
Conferences 01060.
Van de Schoot, Rens, Peter Lugtig, and Joop Hox. 2012. "A checklist for testing
measurement invariance." European Journal of Developmental Psychology 486-
492.
⊘ This is a preview!⊘
Do you want full access?
Subscribe today to unlock all pages.

Trusted by 1+ million students worldwide
1 out of 9
Your All-in-One AI-Powered Toolkit for Academic Success.
+13062052269
info@desklib.com
Available 24*7 on WhatsApp / Email
Unlock your academic potential
Copyright © 2020–2026 A2Z Services. All Rights Reserved. Developed and managed by ZUCOL.


