Data Analysis Report: Chester Weather and Linear Forecasting
VerifiedAdded on 2020/11/23
|8
|1360
|120
Report
AI Summary
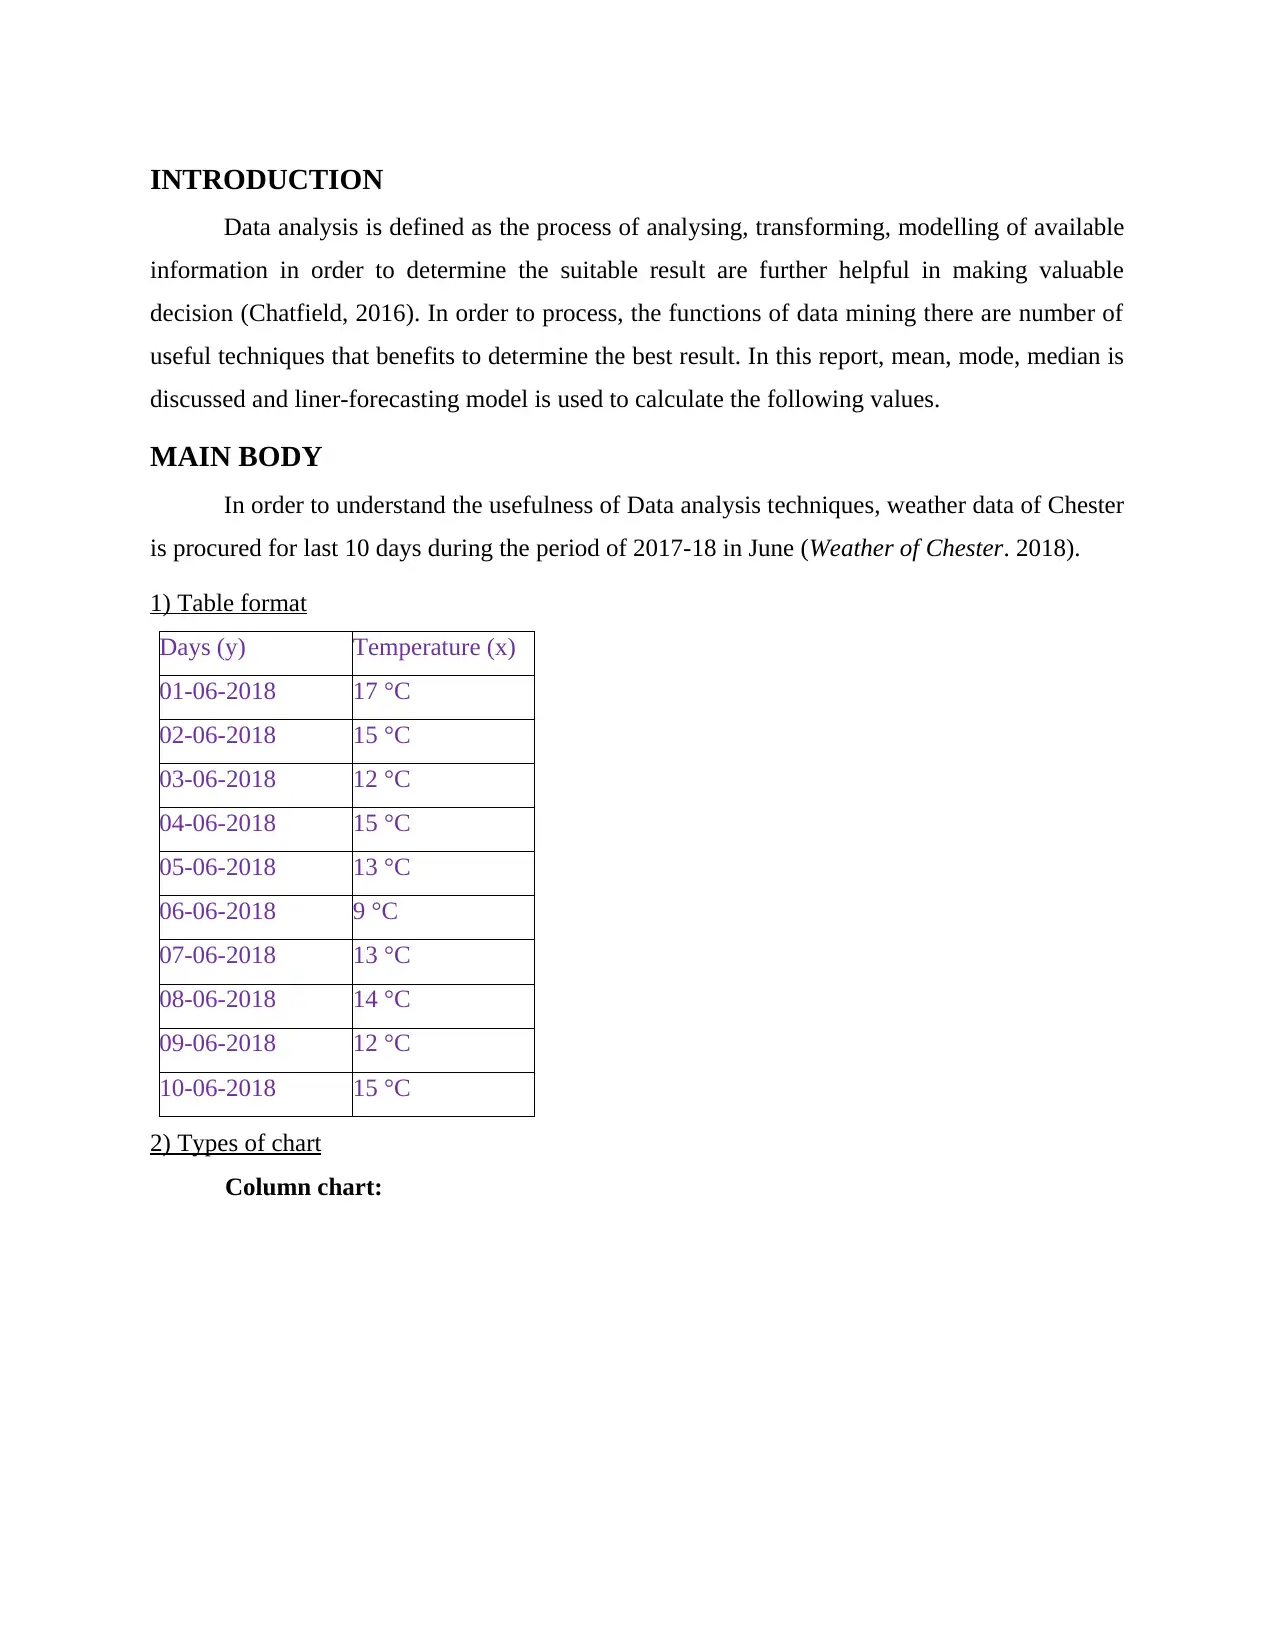
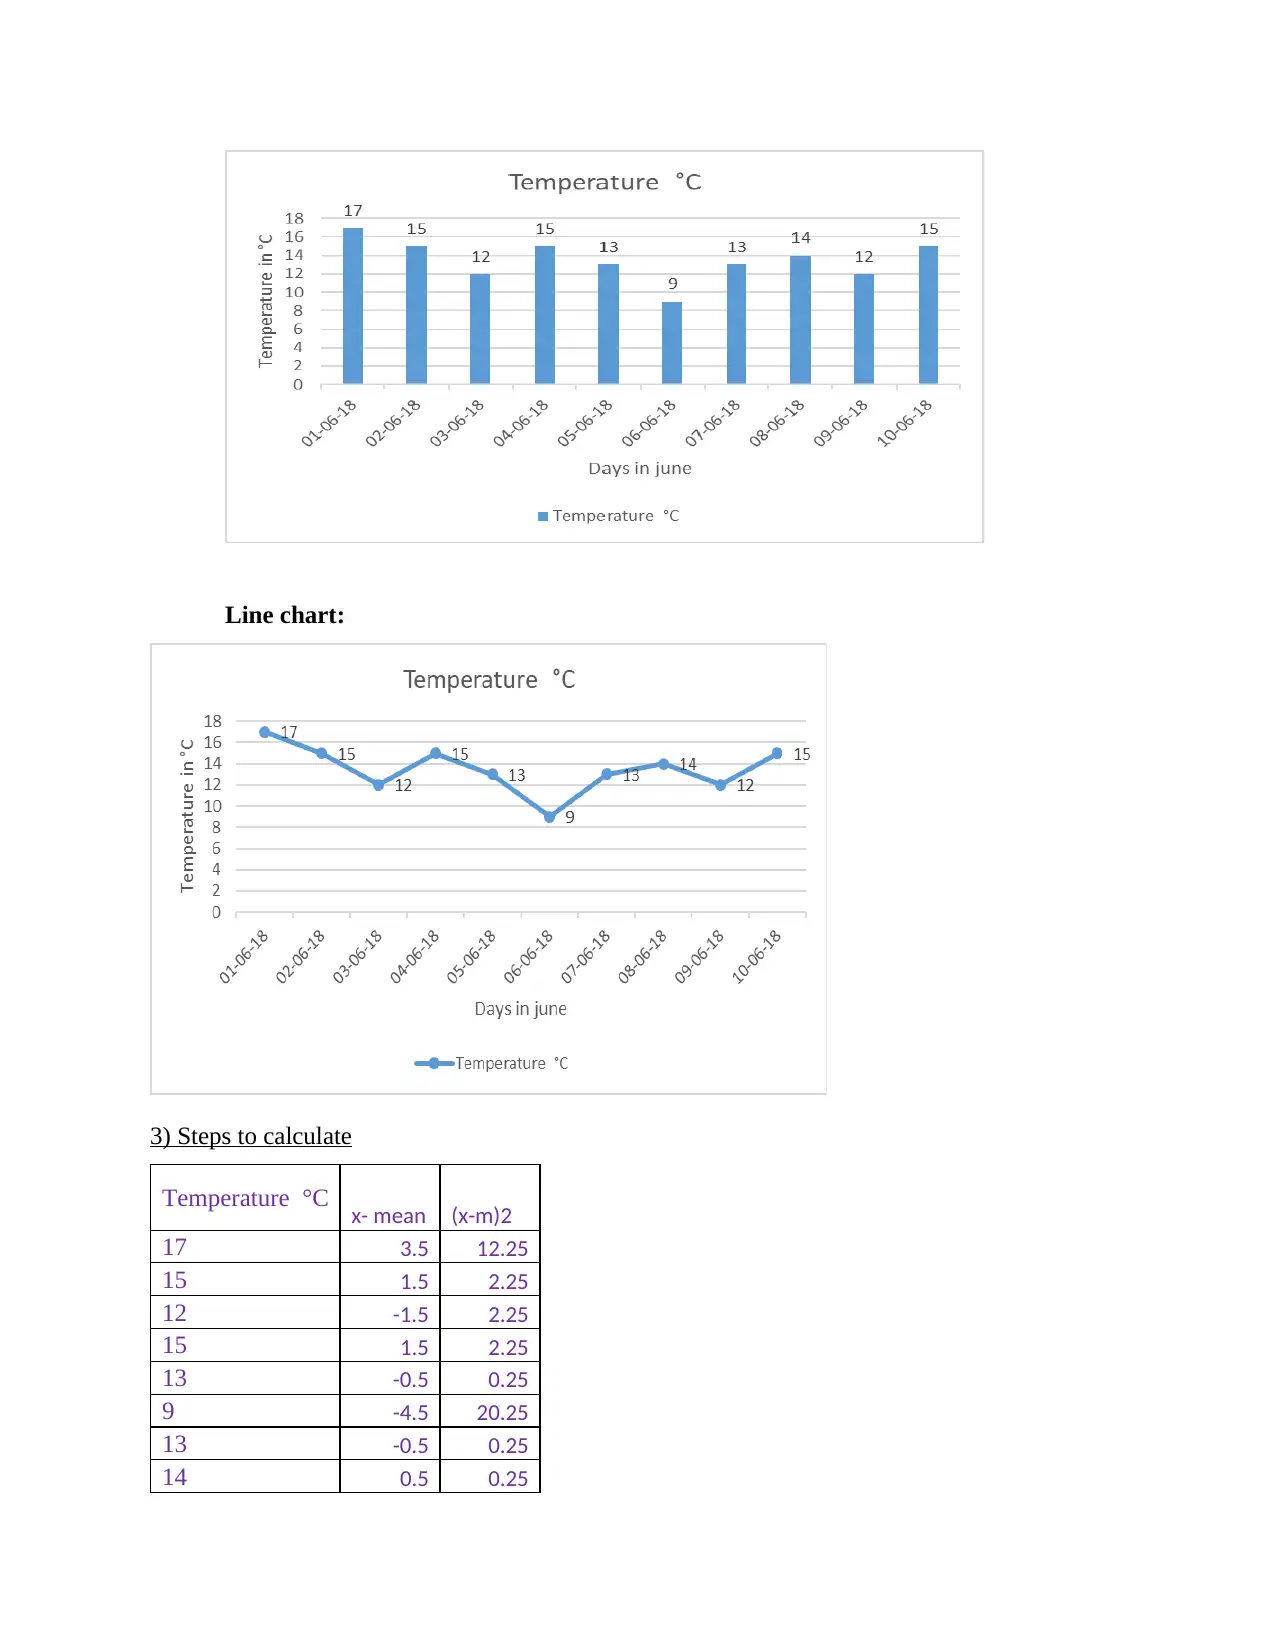
This report provides a comprehensive analysis of weather data from Chester, focusing on various data analysis techniques. The report begins with an introduction to data analysis and its importance in decision-making. It then presents weather data for a 10-day period in June 2018, formatted in a table. The main body of the report details the calculation of key statistical measures such as mean, median, mode, range, and standard deviation, with step-by-step explanations and formulas. Column and line charts are included to visualize the data. Furthermore, the report utilizes a linear forecasting model to predict temperature values for future days, demonstrating the application of data analysis in forecasting. The report concludes by summarizing the usefulness of data analysis tools for better decision-making and forecasting, referencing relevant sources. This report is a valuable resource for students studying data analysis and related fields, providing practical examples and clear explanations of key concepts. Students can find similar resources and solved assignments on Desklib to aid their studies.

Numeracy and Data
Analysis
Analysis
Paraphrase This Document
Need a fresh take? Get an instant paraphrase of this document with our AI Paraphraser

Contents
Contents...........................................................................................................................................2
INTRODUCTION...........................................................................................................................3
MAIN BODY..................................................................................................................................3
1) Table format............................................................................................................................3
2) Types of chart..........................................................................................................................3
3) Steps to calculate.....................................................................................................................4
4. Linear forecasting model.........................................................................................................6
CONCLUSION................................................................................................................................7
REFERENCES................................................................................................................................8

INTRODUCTION
Data analysis is defined as the process of analysing, transforming, modelling of available
information in order to determine the suitable result are further helpful in making valuable
decision (Chatfield, 2016). In order to process, the functions of data mining there are number of
useful techniques that benefits to determine the best result. In this report, mean, mode, median is
discussed and liner-forecasting model is used to calculate the following values.
MAIN BODY
In order to understand the usefulness of Data analysis techniques, weather data of Chester
is procured for last 10 days during the period of 2017-18 in June (Weather of Chester. 2018).
1) Table format
Days (y) Temperature (x)
01-06-2018 17 °C
02-06-2018 15 °C
03-06-2018 12 °C
04-06-2018 15 °C
05-06-2018 13 °C
06-06-2018 9 °C
07-06-2018 13 °C
08-06-2018 14 °C
09-06-2018 12 °C
10-06-2018 15 °C
2) Types of chart
Column chart:
⊘ This is a preview!⊘
Do you want full access?
Subscribe today to unlock all pages.

Trusted by 1+ million students worldwide

Line chart:
3) Steps to calculate
Temperature °C x- mean (x-m)2
17 3.5 12.25
15 1.5 2.25
12 -1.5 2.25
15 1.5 2.25
13 -0.5 0.25
9 -4.5 20.25
13 -0.5 0.25
14 0.5 0.25
3) Steps to calculate
Temperature °C x- mean (x-m)2
17 3.5 12.25
15 1.5 2.25
12 -1.5 2.25
15 1.5 2.25
13 -0.5 0.25
9 -4.5 20.25
13 -0.5 0.25
14 0.5 0.25
Paraphrase This Document
Need a fresh take? Get an instant paraphrase of this document with our AI Paraphraser

12 -1.5 2.25
15 1.5 2.25
13.5 44.5
Mean 13.5
Median 16
Mode 15
Range 8
Maximum
range 17
Minimum 9
STDEV 2.1095
i) Mean:
It is also known as average that is basically calculated by adding the values of number and
then dividing these with total number of observations. Few steps to calculate means such as:
Return to average of numbers
Determine average of number that is based on single criteria.
Formula to calculate mean in excel is =AVERAGE(Value1, Value2…)
Formula in statistics = x¯¯¯=∑xN
So mean of Temperature =13.5 0C,
ii) Median:
In simple terms, it is considered to be the middle value of large group of numbers that usually
separate the lower half from upper half. It is observed that when data series are with odd digits of
values than median is the actual middle component and in case if series is even value than
median is the average of the two middle elements (Pole, West and Harrison, 2018). Following are
the basic steps to calculate median:
Arrange data into series from lowest to greatest.
Din case of odd number the middle values is taken as median and if values are even than
two number are selected to determine the average median.
Formula to calculate median in excel is =MEDIAN(number1, number 2…)
Formula in Statistics = Median=(n+1 / 2)thterm
So median of Temperature =16 0C,
iii) Mode:

It is as kind of average that usually defined as the most frequently occurring of a number
within a given series of data. It is observed that in many series there may not be a single mode or
two or multiple mode according to nature of data series, either binomial or multimodal series.
There is a systematic manner to calculate mode for a following data series such as:
Collect and arrange the data series in ascending order so that separation can be made
easily.
The highest number of time single digits appear into a series is considering being modal
values of that particular data series.
Formula to calculate mode is =MODE.MULT(number1, number 2…)
Formula to calculate median in excel is =MODE(number1, number 2…)
So mode of Temperature = 15 0C,
iv) Range: It is referred to be the collection of values among a maximum and a minimum value.
In Excel, a range is characterized by the reference of the upper left cell (least values) of the range
and the reference of the lower right cell (greatest values) of the range. In addition, separate cells
can be added to this choice, at that point the range is called an unpredictable cell go. In Excel, the
base and greatest esteem are incorporated (Wang and Sun, 2015). There is a simple basic step to
calculate range the highest values minus lowest value in series.
Range is calculated by minimising minimum range from maximum range
Formula to calculate Maximum range = MAX (number1, number 2…); 17
Formula to calculate Minimum Range = MIN (number1, number 2…); 9
Range is calculated for Temperature = MAX – MIN; (17-9 ) = 8 0C,
v) Standard Deviation:
In statistics, the standard deviation (SD), is denoted by sigma σ or the Latin letter s) which is
an important measure used to calculate the amount of difference or dispersion within a value of
particular data set. It is determined as the square base of change by deciding the variety between
every data points that is relevant toward the mean. In the event that the information focuses are
further from the mean, there is a higher deviation inside the informational index; in this way, the
more spread out the data, the higher the standard deviation. Few steps to calculate standard
deviations are:
⊘ This is a preview!⊘
Do you want full access?
Subscribe today to unlock all pages.

Trusted by 1+ million students worldwide

Arrange data into continuous series so that result can easily be determined.
Apply the formula according to the nature of series such as = STDEV.S( ), where s
denote sample SD or =STDEV.P( )in which p stands for population.
Standard deviation for Temperature = 8 0C
4. Linear forecasting model
To determine the value of m in y = mx + c the following are the assumption values of c
=30, x=10 and y =20 so putting values in equation:
1. Steps to calculate m = m (the Slope) needs some calculation:
m = Change in Y / Change in X
2. Step to calculate c = it remains constant factor. As it will be calculated as c = y - mx
3. Using the calculated 'm' and 'c' values, forecast the weather indicator for day 15 and day
23.
For forecasting day 15 was forecasted as 12.886 0C for temperature For forecasting day 23
was forecasted as 16.2213 0C
This forecast is calculated by using formula
FORECAST.LINEAR(x,yknownvalues,xknownvalues).
CONCLUSION
From the above report, it has been concluded that data analysis is a crucial tool that helps
to determine the values for better decision making and forecasting. Different techniques are
helpful in extracting accurate values of gives data series.
Paraphrase This Document
Need a fresh take? Get an instant paraphrase of this document with our AI Paraphraser

REFERENCES
Books and Journals:
Chatfield, C., 2016. The analysis of time series: an introduction. Chapman and Hall/CRC.
Pole, A., West, M. and Harrison, J., 2018. Applied Bayesian forecasting and time series analysis.
Chapman and Hall/CRC.
Wang, D. and Sun, Z., 2015. Big data analysis and parallel load forecasting of electric power
user side. Proceedings of the CSEE, 35(3), pp.527-537.
Online
Weather of Chester. 2019. [Online] Available Through:
<https://www.bbc.com/weather/2653228?day=1>.
1 out of 8
Related Documents
Your All-in-One AI-Powered Toolkit for Academic Success.
+13062052269
info@desklib.com
Available 24*7 on WhatsApp / Email
Unlock your academic potential
Copyright © 2020–2026 A2Z Services. All Rights Reserved. Developed and managed by ZUCOL.


