Analysis of Child Mortality Data Using Python and Jupyter Notebook

Verified

Added on  2020/04/01

|10
|493
|59
Project
AI Summary
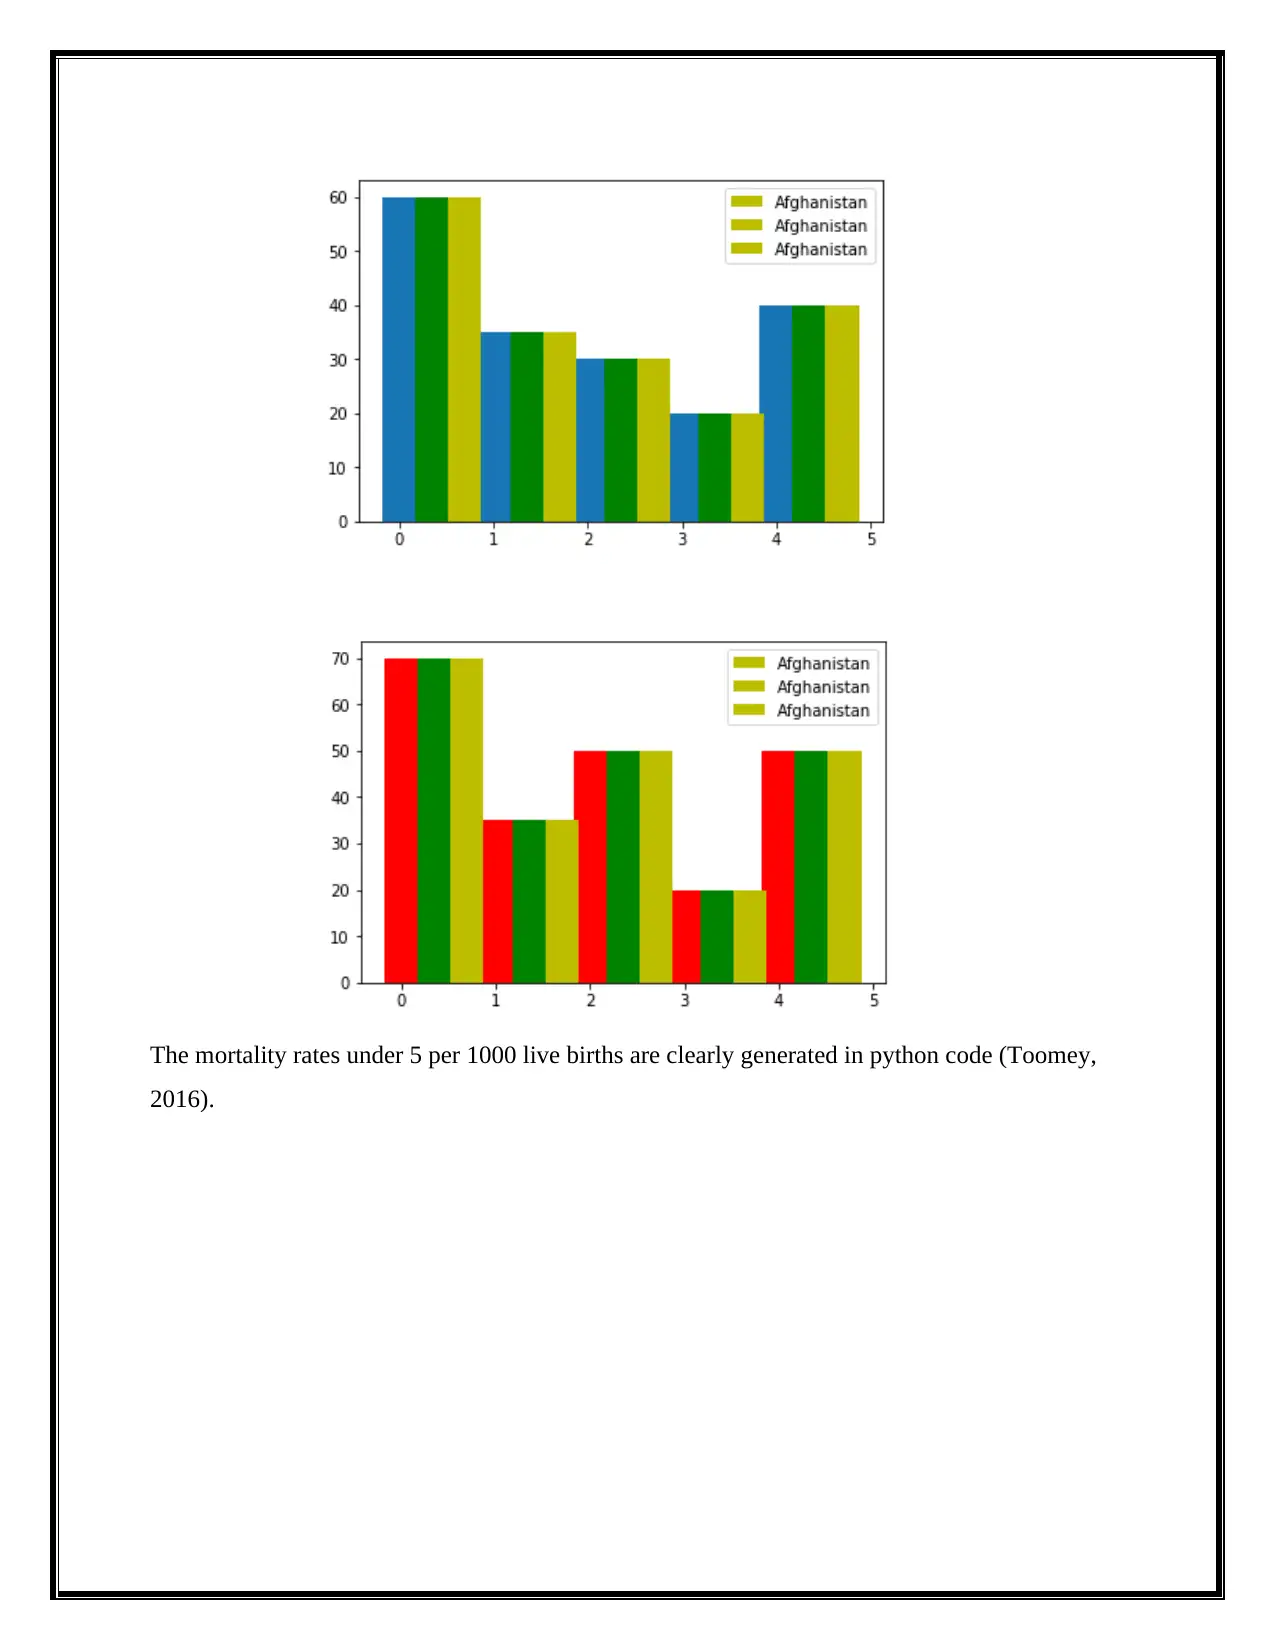
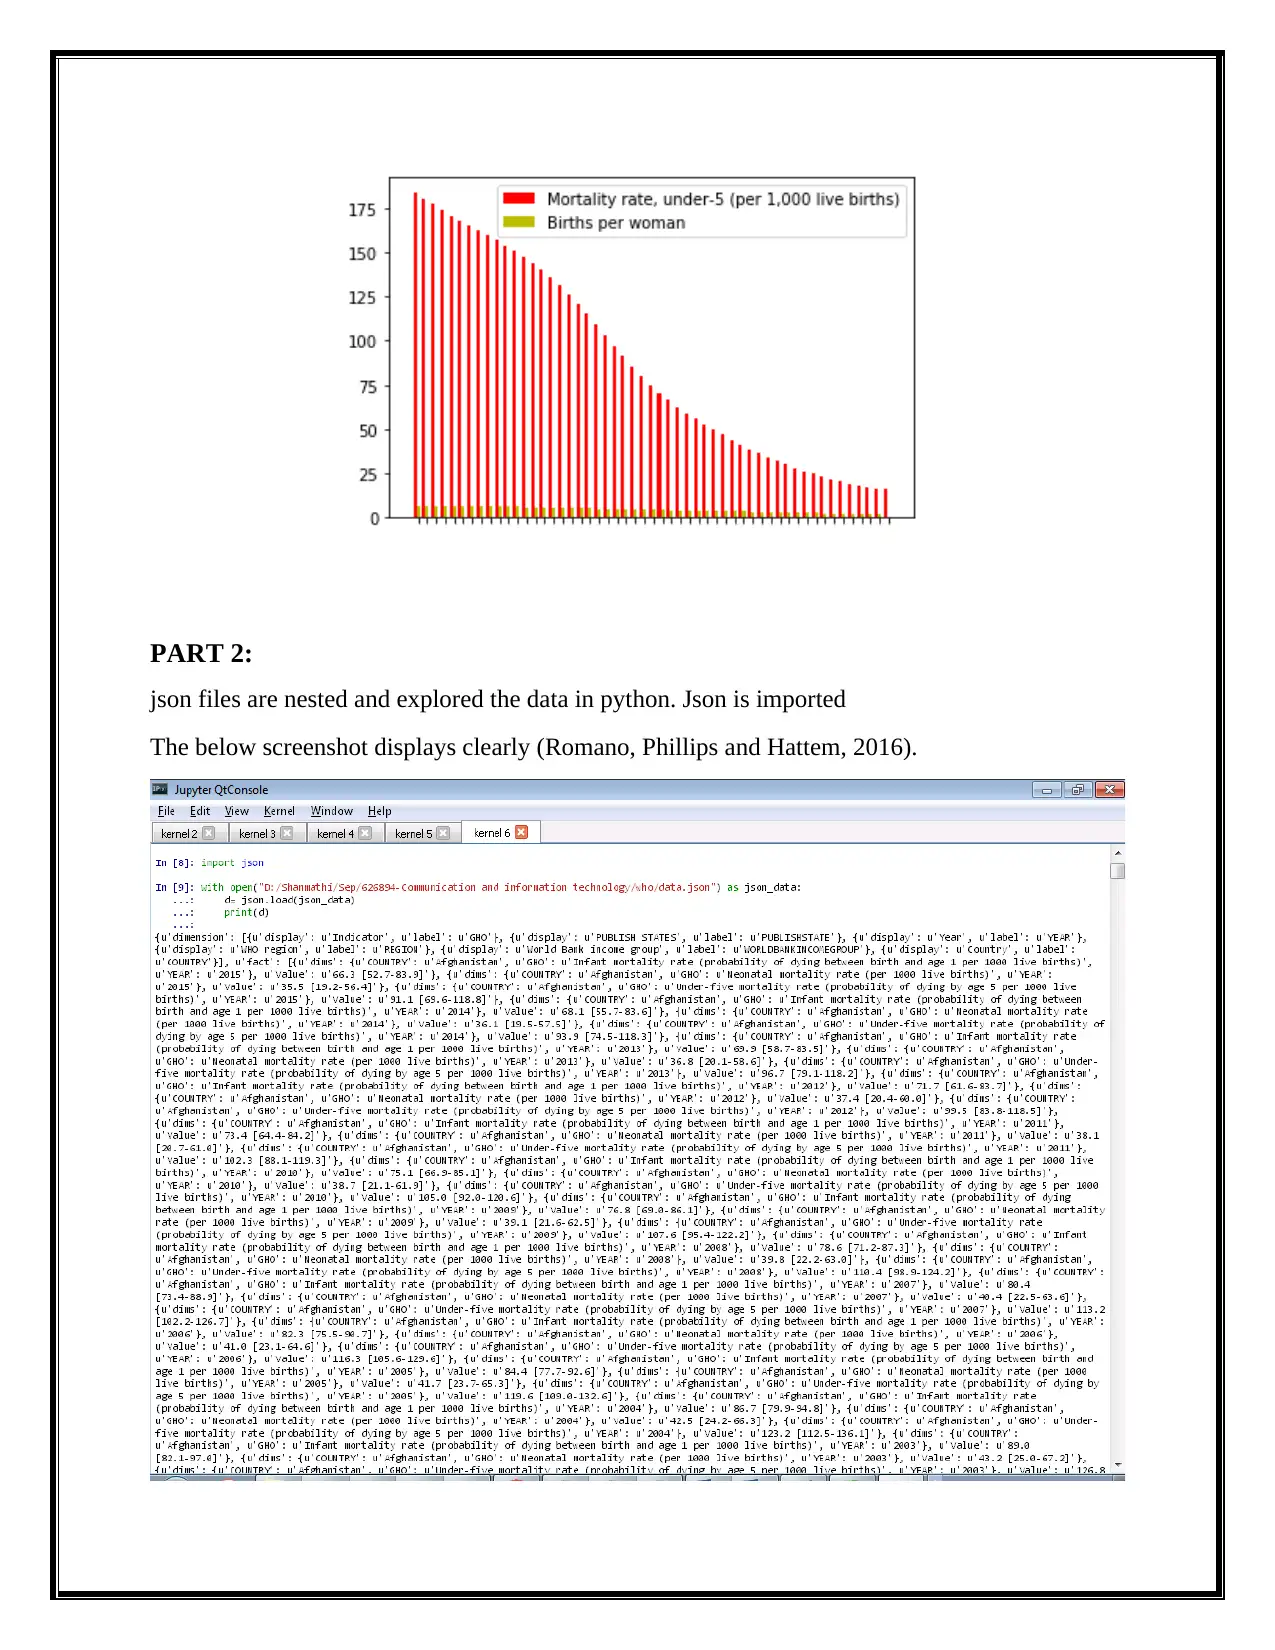
This project analyzes child mortality data using Python and Jupyter Notebook. The assignment involves data wrangling from provided CSV files, generating Python code, and creating graphs to visualize mortality trends. The analysis includes infant, neonatal, and under-five mortality rates, with insights into the data trends. The project utilizes Pandas library and focuses on data visualization. The project also explores data using JSON files. The project is designed to provide a comprehensive understanding of child mortality data analysis and visualization techniques using Python and Jupyter Notebook, and the insights are generated from the provided WHO data.
Document Page
Communication and
Information Technology
tabler-icon-diamond-filled.svg

Paraphrase This Document

Need a fresh take? Get an instant paraphrase of this document with our AI Paraphraser
Document Page
Table of Contents
Overview.........................................................................................................................................2
TASK 2...........................................................................................................................................2
PART 1.......................................................................................................................................2
PART 2:......................................................................................................................................6
Implementation..............................................................................................................................8
Conclusion......................................................................................................................................8
Document Page
Overview
Python Jupiter notebook will be used for child mortality as per requirements. The data
will be analyzed, investigated and will be provided as python code with generated graph
screenshots. Data wrangling process will be done. The provided csv files will be used and output
will be generated for child mortality with various graphs.
The data is taken from the (WHO) provided link.
TASK 2
The task 2 is divided into 2:
1. Part 1
2. Part 2
PART 1
Form the provided csv file, the python code is generated and implemented in part 1. The
below screenshot displays the csv file generated in python code for displaying the country, year,
infant mortality rate, Neonatal mortality rate and Under-five mortality rate. By importing Pandas
library files, the code is generated further (SHADAN, 2017).
Document Page
tabler-icon-diamond-filled.svg

Paraphrase This Document

Need a fresh take? Get an instant paraphrase of this document with our AI Paraphraser
Document Page
Graphs are generated and displayed in the below screenshots. It explains the mortality rates for
various years. The insights into the data trends are analyzed and provided. The changes are
shown for various years mentioned in the requirements (Jacqueline Kazil, 2017).
Document Page
The mortality rates under 5 per 1000 live births are clearly generated in python code (Toomey,
2016).
Document Page
PART 2:
json files are nested and explored the data in python. Json is imported
The below screenshot displays clearly (Romano, Phillips and Hattem, 2016).
tabler-icon-diamond-filled.svg

Paraphrase This Document

Need a fresh take? Get an instant paraphrase of this document with our AI Paraphraser
Document Page
The higher level analysis of mortality at various levels are shown below (Jupyter-notebook-
beginner-guide.readthedocs.io, 2017).
Document Page
Implementation
Conclusion
Python Jupiter notebook is used for child mortality as per requirements. The data is
analyzed, investigated and is provided as python code with generated graph screenshots. Data
wrangling process is done. The provided csv files is used and output is generated for child
mortality with various graphs.
References
Jacqueline Kazil, K. (2017). Wrangle your data with Python. [online] O'Reilly Media. Available
at: https://www.oreilly.com/learning/wrangle-your-data-with-python [Accessed 18 Sep. 2017].
Jupyter-notebook-beginner-guide.readthedocs.io. (2017). Jupyter/IPython Notebook Quick Start
Guide — Jupyter/IPython Notebook Quick Start Guide 0.1 documentation. [online] Available at:
https://jupyter-notebook-beginner-guide.readthedocs.io/en/latest/ [Accessed 18 Sep. 2017].
Romano, F., Phillips, D. and Hattem, R. (2016). Python. Birmingham: Packt Publishing.
Document Page
SHADAN, M. (2017). Python - Install Anaconda, Jupyter Notebook, Spyder. [online] Rstudio-
pubs-static.s3.amazonaws.com. Available at:
http://rstudio-pubs-static.s3.amazonaws.com/242584_29bdf274c291408090962b3e860a299e.ht
ml [Accessed 18 Sep. 2017].
Toomey, D. (2016). Learning Jupyter. Birmingham: Packt Publishing.
chevron_up_icon
1 out of 10
circle_padding
hide_on_mobile
zoom_out_icon
[object Object]