Macroeconomic Analysis of China's Economic Performance (2005-2014)
VerifiedAdded on 2023/06/09
|12
|3112
|76
Report
AI Summary
This report provides a comprehensive analysis of China's economic performance between 2005 and 2014, focusing on key macroeconomic indicators. It begins with an introduction to China's economic landscape, highlighting its significance in the global market and the role of the Communist Party. The report then delves into the analysis of real GDP and its growth rate, presenting data and discussing factors that influenced these indicators. The analysis further includes a comparison of China's real GDP per capita with that of the United States. The report also examines the labor market, including unemployment trends and government measures to achieve full employment. Finally, it analyzes inflation trends and government strategies to achieve price stability. The analysis uses figures and data from the World Bank, providing a detailed view of the Chinese economy's strengths and weaknesses during the specified period. The report concludes with an assessment of the government's policies and their impact on economic outcomes.

Running head: ECONOMICS ASSIGNMENT
Economics assignment
Name of the student
Name of the university
Author Note
Economics assignment
Name of the student
Name of the university
Author Note
Paraphrase This Document
Need a fresh take? Get an instant paraphrase of this document with our AI Paraphraser
1ECONOMICS ASSIGNMENT
1. Introduction:
The People’s Republic of China (PRC) is a sovereign country of East Asia where
maximum number of population can be seen. The Communist party dominates this extended
and earliest civilization, where the entire political system is based on dynasties or hereditary
monarchies. Based on nominal GDP, this socialistic country has ranked the second largest
across the world. Moreover, the International Monetary Fund (IMF) has stated that China’s
economy is the largest one by purchasing power parity (PPP), across the world (Zhao, et al.,
2018). The public sector of China plays a significant role in political and social aspects. This
is due to its bigger contribution to the country’s national income compare to private sector.
China has the largest manufacturing economy and one of the biggest exporters across the
world. In addition to this, the country has fastest growing market for consumer along with
second largest market for importing goods. Hence, in international market China has played
significance role through doing international trade. In 2001, China has become a member of
the World Trade Organisation (WTO) while it has done free trade agreements with various
countries like Australia, ASEAN, New Zealand, South Korea, Pakistan and Switzerland as
well (Feinerman, 2017). Economical discrimination can be seen across the country, for
instance, provinces in the coastal are more developed and industrialized compare the
surrounding area of China.
As economic importance of China is increasing significantly, it can be beneficial to
analyze some macroeconomic factors like real gross domestic product (GDP), per capita real
GDP along with unemployment rate and inflation of China to understand its economic
performance.
2ECONOMICS ASSIGNMENT
2. Production output performance analysis:
2.1 Real GDP and real GDP growth rate:
Gross domestic product (GDP) of a country provides monetary value of all goods and
services that are produced within a particular time, such as, one year. This macroeconomic
indicator is of two types, which are, nominal and real GDP. Nominal GDP considers inflation
and consequently it cannot provide actual economic condition of the country (Feldstein,
2017). On the contrary, real gross domestic product represents an inflation-adjusted measure,
which provides the value of every goods and services that a country produces during a
particular time and expressed in terms of base-year prices. This base year prices is called
constant price. Hence, this macroeconomic indicator represents actual economic condition of
a country as it considers changing price level. To calculate GDP, it is essential to add the
expenditure value of consumers, business sectors and public sectors along with net export.
The formula for calculating real GDP is:
Real GDP = GDP / (1+ Inflation since constant year or base year)
Real GDP growth rate or real economic growth rate represents economic growth of a
county from one period to another (Rossi & Sekhposyan, 2015). This value is measured in
percentage for showing the change rate of GDP for a country, for instance, from one year to
another. Real GDP growth rate can be obtained from the value of Real GDP of a country and
the formula for calculating this value is:
Real GDP growth rate helps policymaker of a country to implement proper fiscal
policies for stimulating economic growth or controlling inflation.
⊘ This is a preview!⊘
Do you want full access?
Subscribe today to unlock all pages.
Trusted by 1+ million students worldwide
3ECONOMICS ASSIGNMENT
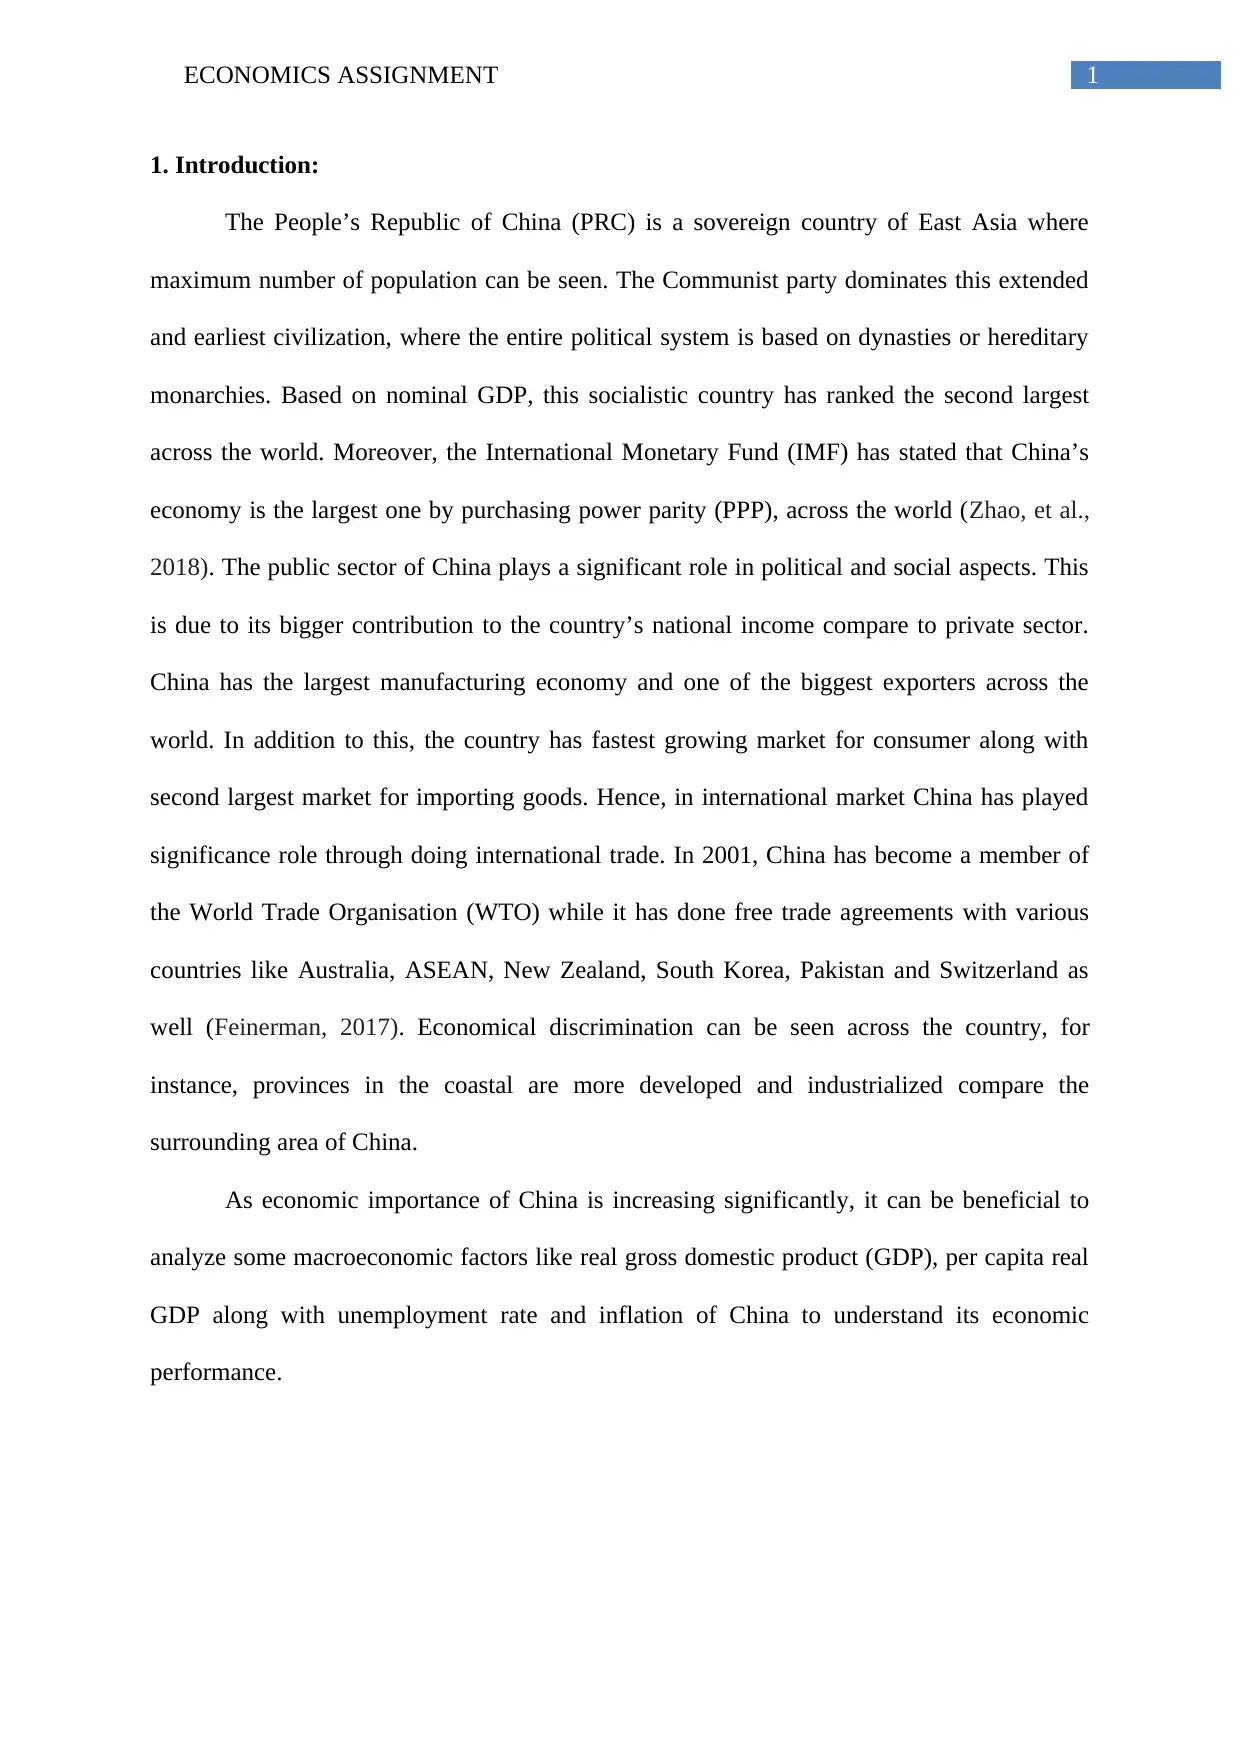
2.2 Real GDP growth rate analysis on China:
2004 2006 2008 2010 2012 2014 2016
0
2
4
6
8
10
12
14
16
GDP growth (annual %)
GDP growth (annual %)
Figure 1: Real GDP growth rate of China
Source: (Data.worldbank.org, 2018)
Figure 1 has represented slow down of China’s real GDP growth rate since 2006. In
this context, two reasons can be discussed to analyse this negative economic outcome of this
country. Firstly, manufacturing sector has controlled economic condition of this county for
long years. However, due to large number of aged population and lower wages, China has
influenced young generations adversely to get a job in this sector (Data.worldbank.org,
2018). Secondly, the global financial crisis of 2008 has not influenced this country
significantly though after effect of this crisis has become one of main causes to reduce
economic growth of this country. The government has spent huge amount of money during
this phase for which huge amount of debt has been generated (Feenstra et al., 2013).
Moreover, the government of this country is has tried to shift it export and manufacturing
sectors towards a service one for which the value of net export has declined in China.
Paraphrase This Document
Need a fresh take? Get an instant paraphrase of this document with our AI Paraphraser
4ECONOMICS ASSIGNMENT
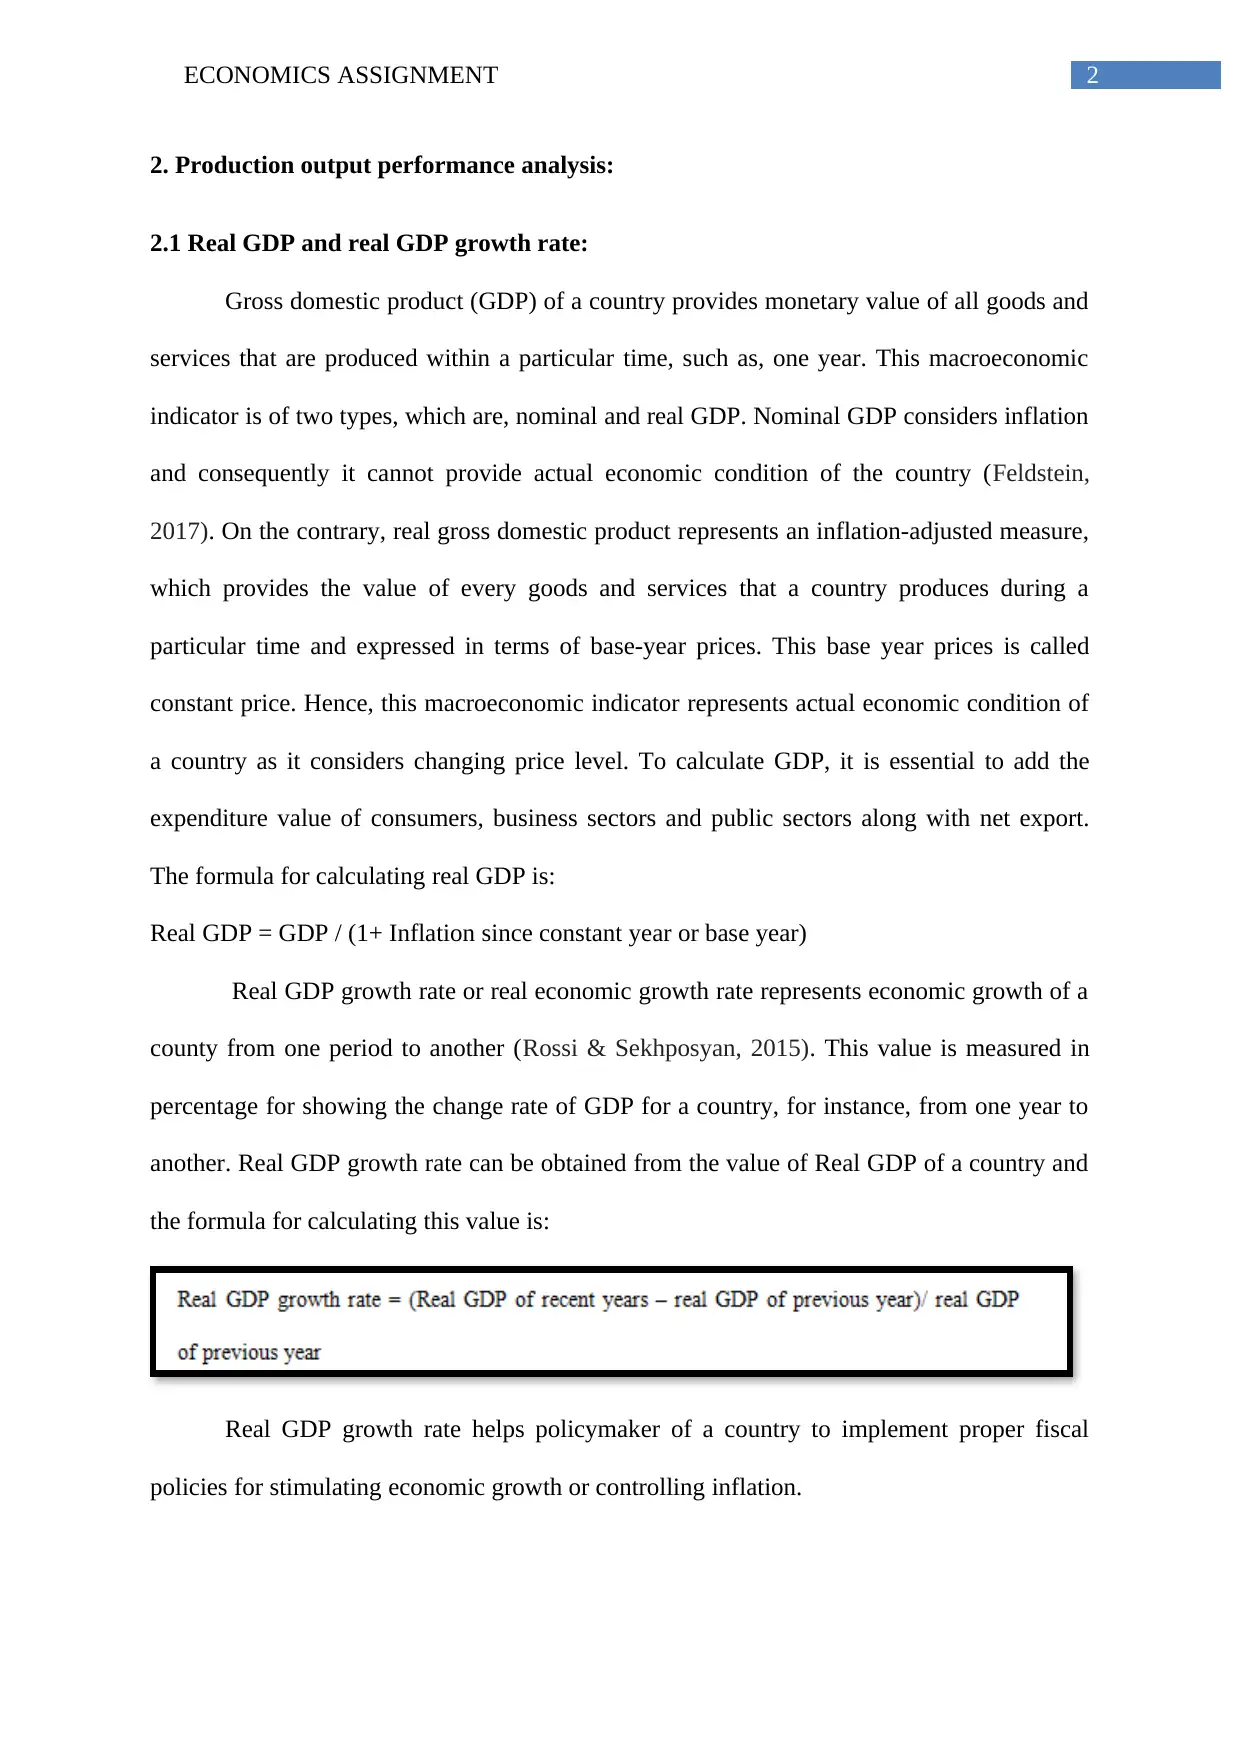
2.3 Real GDP per capita analysis:
To measure real GDP per capita, real GDP is divided with the help of total population
and this is inflation-adjusted. This type of economic indicator is used to compare the living
standard between two countries over the particular time. Here, economic performance of
China is compared with the U.S.A. The U.S.A has possessed the largest economy all over the
world. According to the International Monetary Fund, this country has ranked 6th in this
world based on per capita GDP (Neuenkirch & Neumeier, 2015). This highly developed
country has service sector with advanced technology. In addition to this, financial services,
retail and health care have helped this country to lead the economy.
2004 2006 2008 2010 2012 2014 2016
0
10000
20000
30000
40000
50000
60000
GDP per capita of China (current
US$)
GDP per capita of U.S (current
US$)
Figure 2: Real GDP per capita comparison between China and U.S
Source: (Data.worldbank.org, 2018)
Figure 2 has represented that real GDP per capita of U.S.A has remained high
compare to that of China. From here it can be said that standard of living in U.S has remained
better compare to China between 2005 and 2014 (Data.worldbank.org, 2018). This
macroeconomic indicator for both countries has increased sharply between these years. Due
to Financial crisis, this per capita has decreased in U.S.A while in China it has not decreased.
5ECONOMICS ASSIGNMENT
2.4 Government measurement to achieve economic growth:
In 2014, the government of China has tried to reduce its borrowing costs through
applying proper fiscal policy. In 2015, this country has reduced currency exchange rate of the
Yuan in terms of U.S dollar (Zhang, Nie, Shi & Zhang, 2018). Consequently, the country has
become more competitive. To achieve economic growth again, the government has focused
on its old economic drivers by investing in real estate and infrastructure.
3. Labour market analysis:
3.1 Concept of unemployment including types:
Unemployment also represents economic condition of a country, as higher
unemployment rate leads economic growth to decrease further. Hence, the government of
each country implies to obtain proper policies and programs for reducing the number of total
unemployment within the economy. According to this concept, a person intends to get a job
at existing wages but cannot find any due to lack of job opportunities (Grieve, 2018). The
chief measurement of unemployment is unemployment rate, where total number of
unemployed persons is divided with the help of total number of work force. Within a country,
three types of unemployment can be seen, viz., frictional, cyclical and structural
unemployment. Frictional unemployment is a temporary concept where a person remains
unemployed for changing the job. This type of unemployment does not generate any negative
implications on economy On the contrary, cyclical unemployment generates due to
fluctuations of business cycle. During the phase of recession, economic growth of a country
decreases and this in turn generates huge number unemployment (Boyce, Wood, Daly &
Sedikides, 2015). However, during the phase of expansion, this type of unemployment
reduces. This type of unemployment requires some times to reduce. Structural unemployment
is other type long-term unemployment when unskilled people loss jobs due to structural
changes.
⊘ This is a preview!⊘
Do you want full access?
Subscribe today to unlock all pages.
Trusted by 1+ million students worldwide
6ECONOMICS ASSIGNMENT
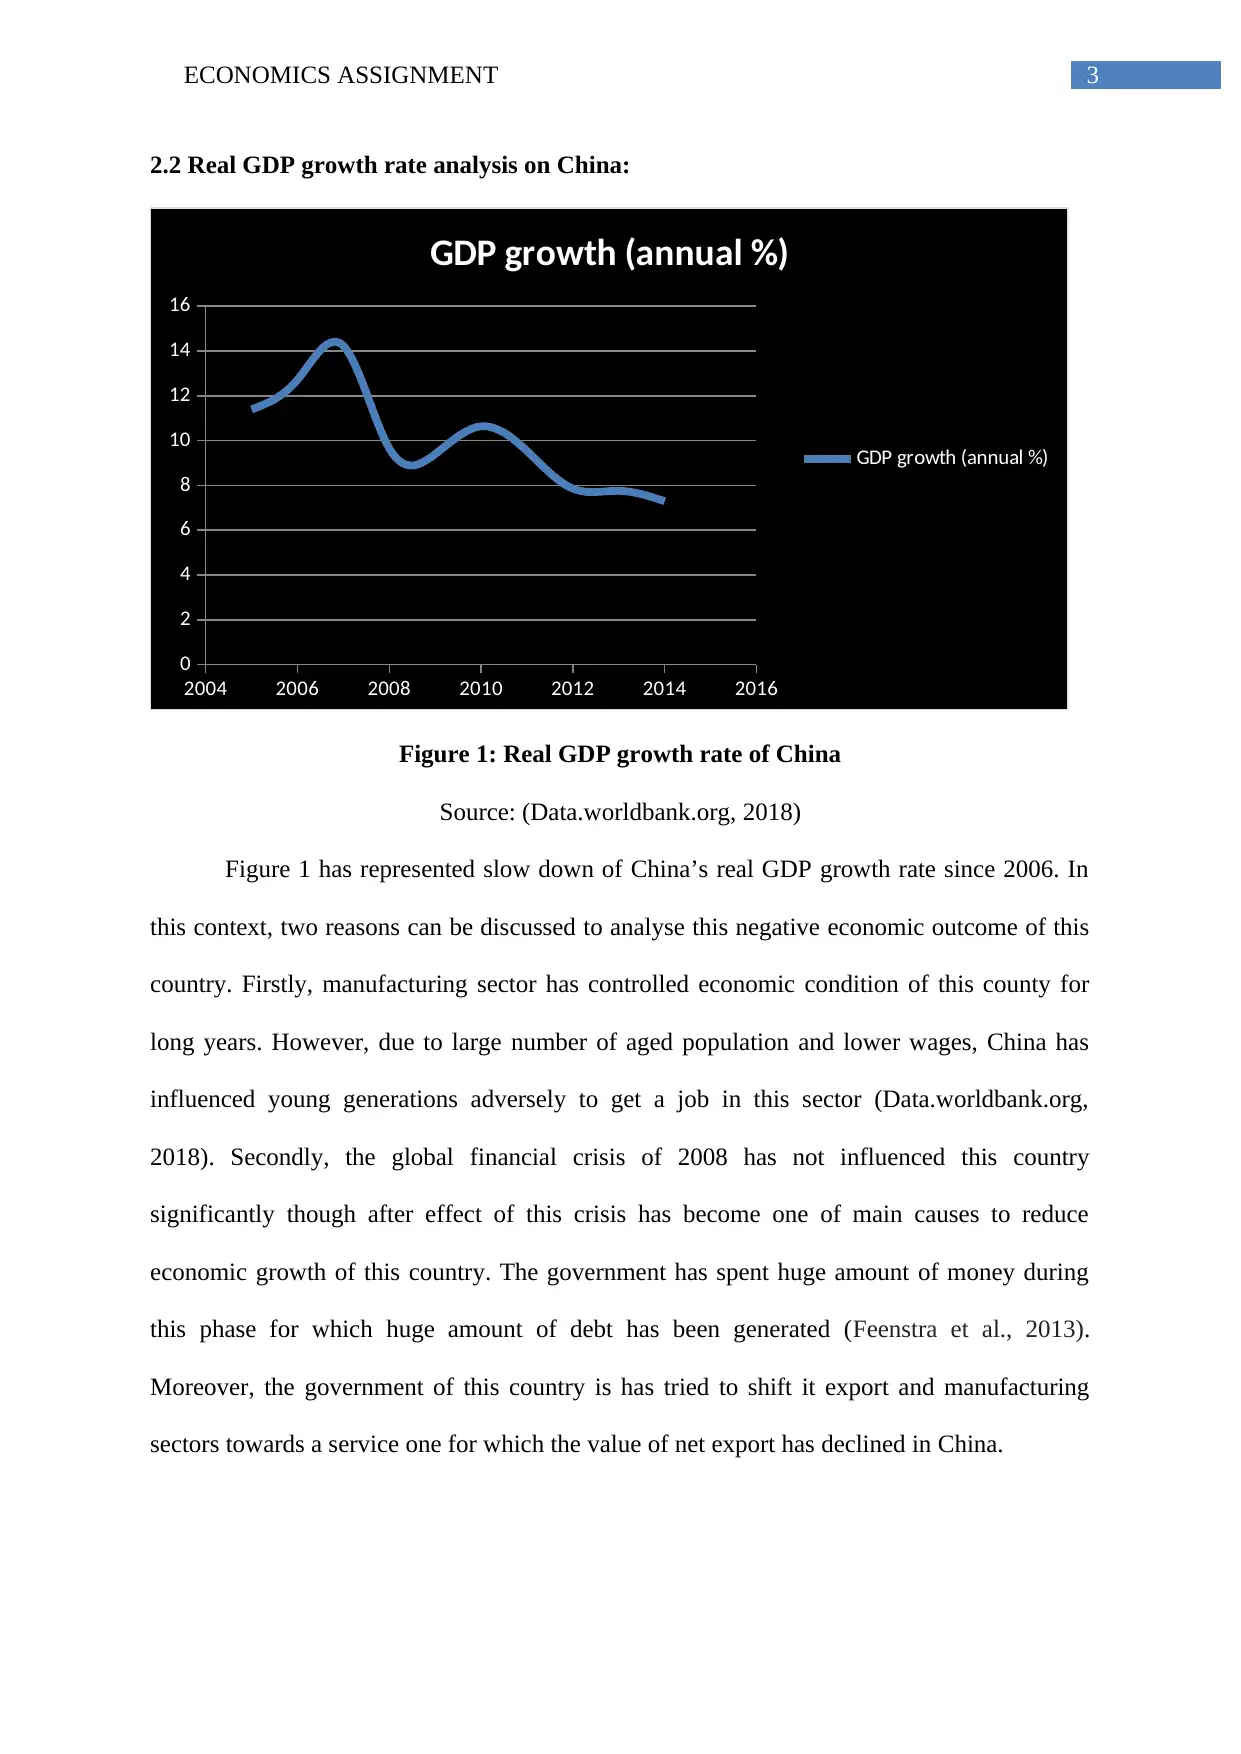
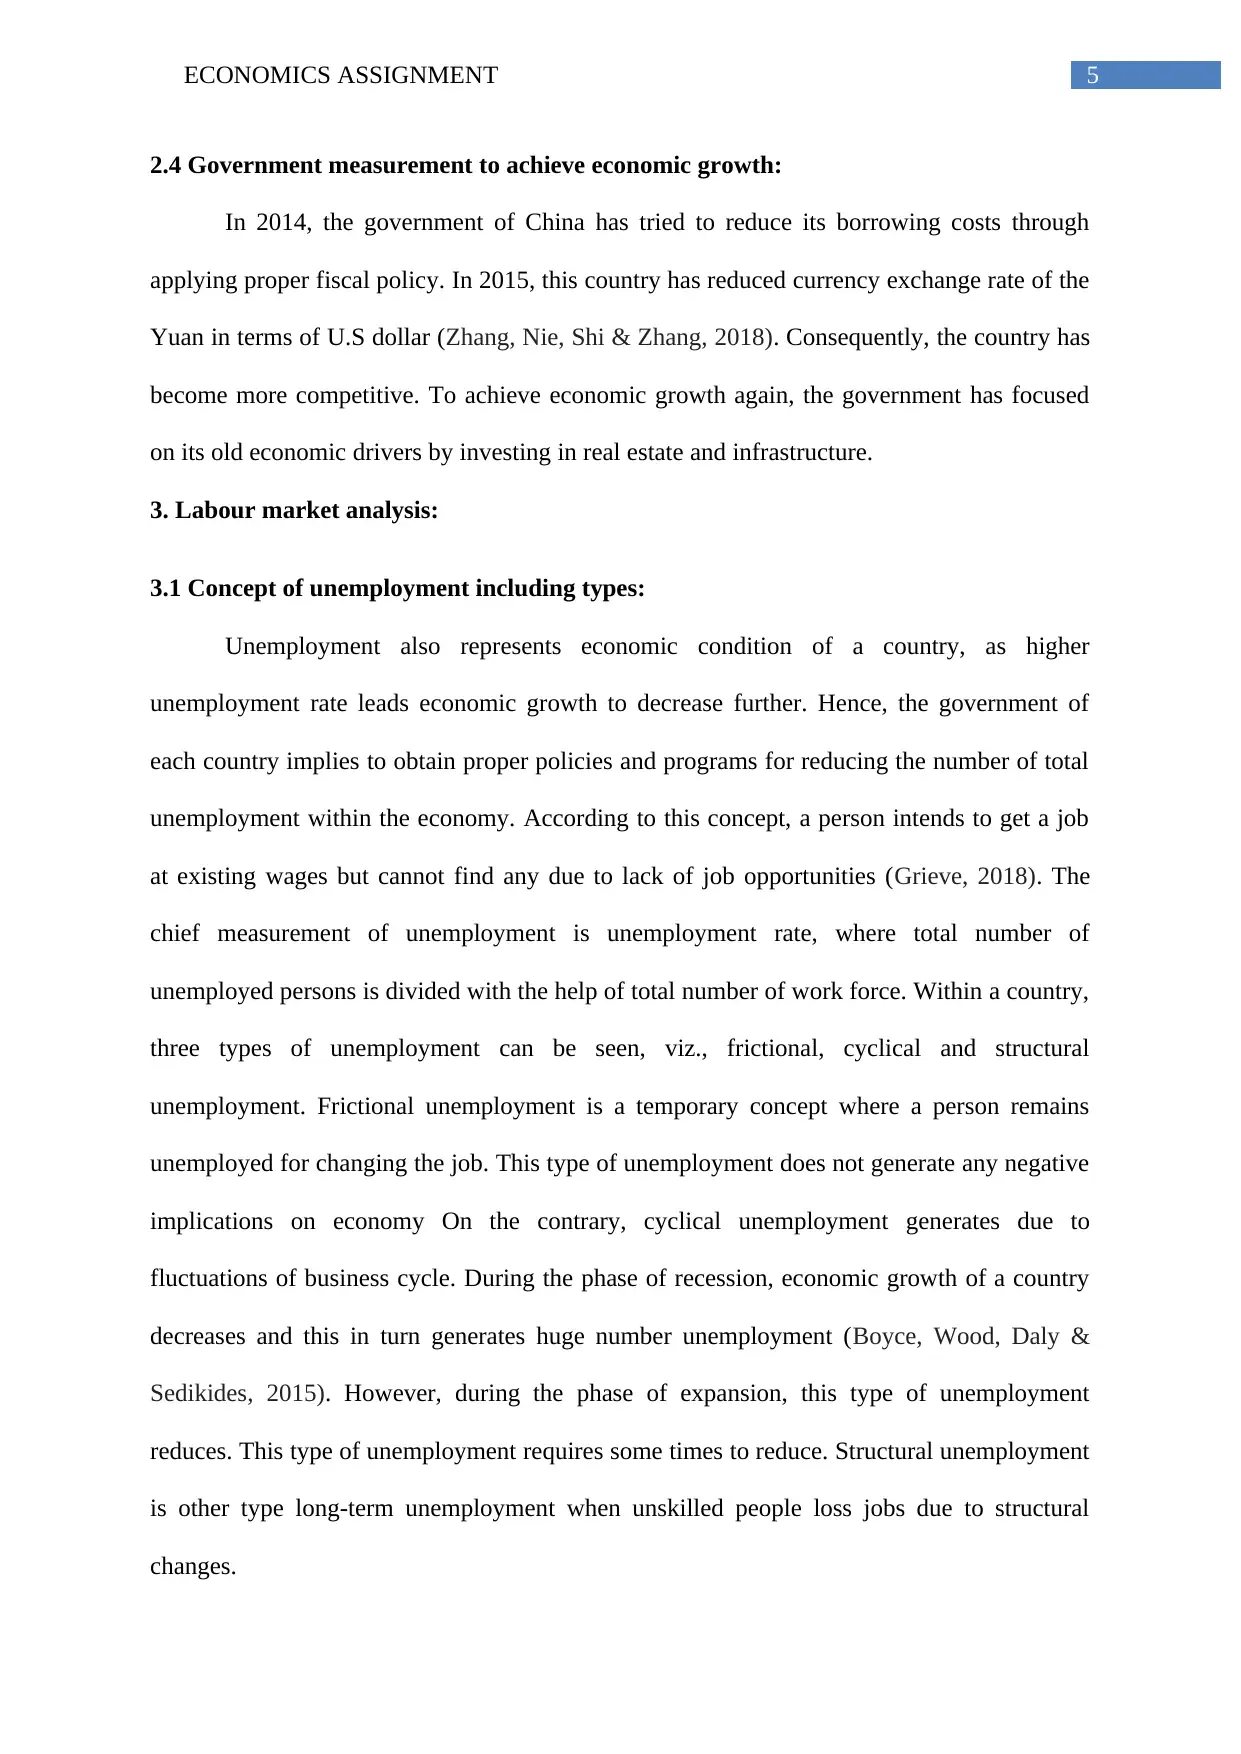
3.2 Trend of unemployment in China:
Unemployment rate represents total number of labour force, which is jobless and this
measurement is measured in terms of percentage. The formula to calculate unemployment
rate is:
2004 2006 2008 2010 2012 2014 2016
0
0.5
1
1.5
2
2.5
3
3.5
4
4.5
5
Unemployment, total (% of total labor
force) (modeled ILO estimate)
Unemployment, total (% of
total labor force) (modeled ILO
estimate)
Figure 3: Unemployment trend of China
Source: (Data.worldbank.org, 2018)
According to above figure, unemployment rate of China has increased over the due to
lack of job opportunity. As the country has experienced economic transform, this higher rate
of unemployment has occurred. Existing wages of China cannot attract young generation to
work within the country. As a result, many people have remained unemployed. Moreover,
financial crisis also have led this unemployment rate to increase further. As the government
expenditure has increased sharply for managing this financial crisis, Chin has experienced
Paraphrase This Document
Need a fresh take? Get an instant paraphrase of this document with our AI Paraphraser
7ECONOMICS ASSIGNMENT
huge burden of debt (Huang & Fidrmuc, 2016). Moreover, exports of this country have
declined and this in turn has forced demand of this country to decrease further. As a result,
many people have lost their jobs.
3.3 Government measures to achieve full employment:
To obtaining full employment, the government of China has taken various measures
through adopting monetary and fiscal policies. It provides facilities to community services,
tourism, trade and commercial circulation and so on to develop further for creating more job
opportunities within these industries. In addition to this, the government has paid huge
attention to its labour market for exploiting human resources and for this it has developed
labour-intensive industries. Those industries have relative advantage with the market and
whose products have captured significant market share within this country (Lu et al., 2017).
Moreover, both central and local governments have provided special aids of funds to assist
labours of urban and rural labourers for getting providing training. By providing favourable
taxation policy, governments have supported unemployed persons to start-up their business
and at the same time, the country has encouraged small business sectors to hired unemployed
persons.
4. Price level analysis:
4.1 Concept of inflation:
Inflation means a rate of price increase over the year for all goods and services of a
country. This is measured in percentage, which in terms represents that increase in inflation
can decrease the purchasing power of consumers. If inflation increases by small percentage
that it can positively affect national income of a country by increasing it (Brown, 2017).
However, higher rate of inflation is not good as it reduces standard of living of citizens, as
they cannot purchase their required products with higher prices. Inflation can be occurred for
two reasons, which are, demand-pull inflation and cost-push inflation. Demand-pull inflation
8ECONOMICS ASSIGNMENT
occurs when aggregate demand of a country increases and this further lead price level to
increase further. In addition to this, cost-push inflation occurs when production cost of a
company increases.
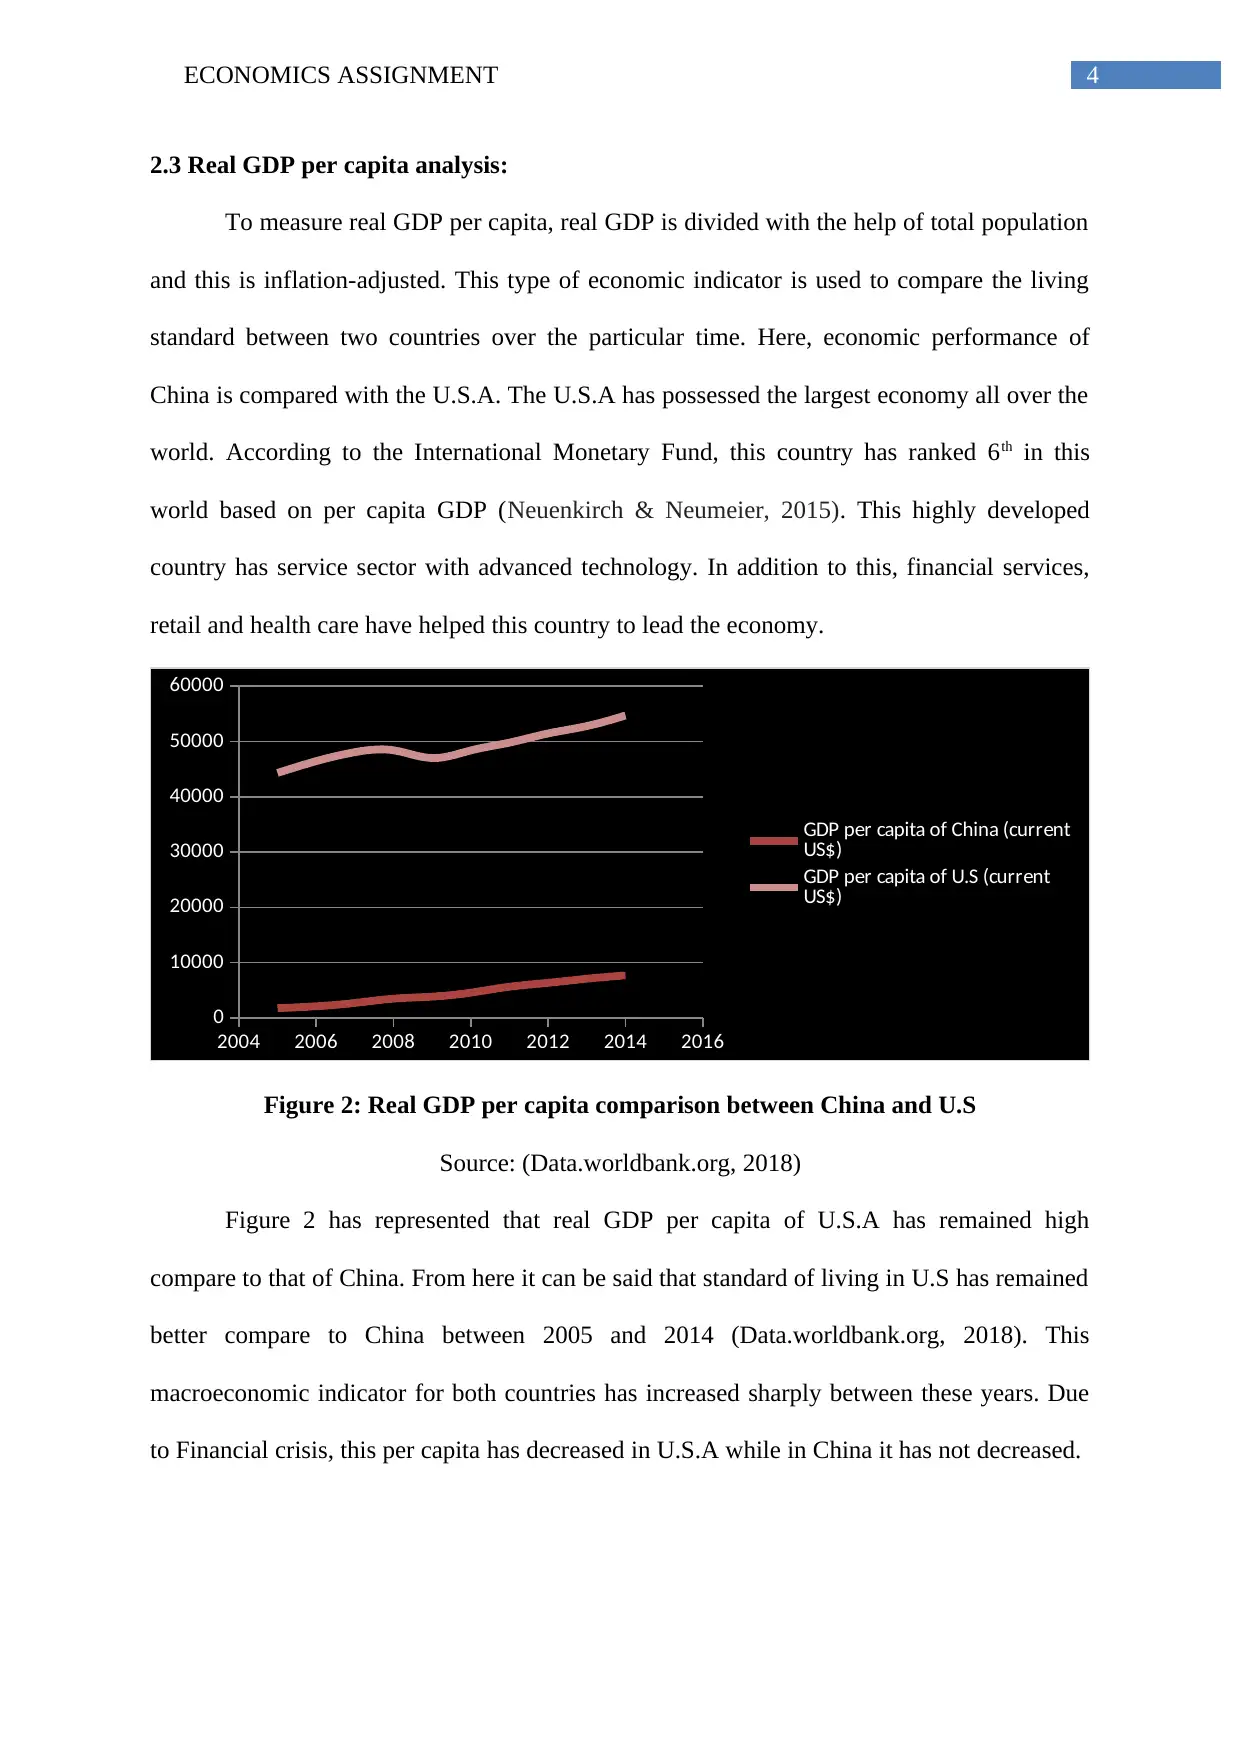
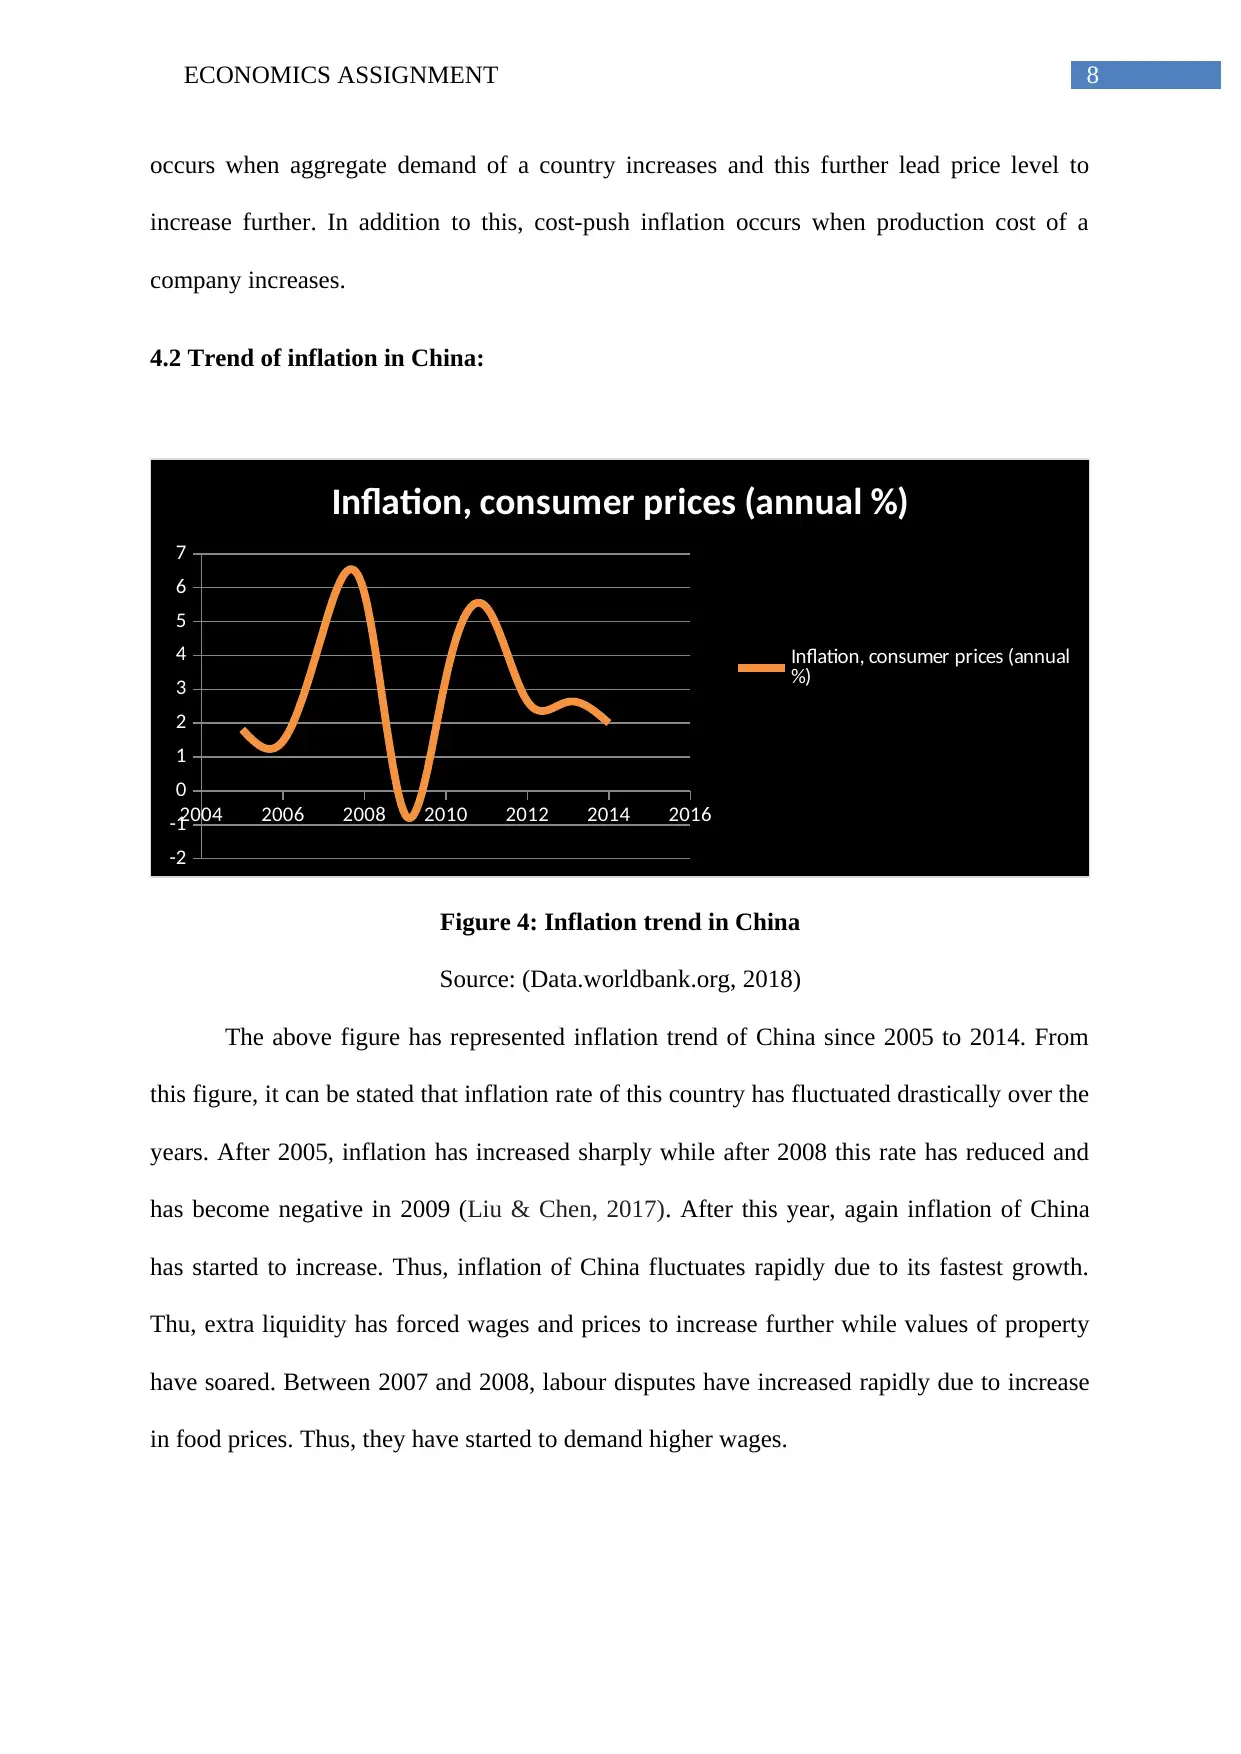
4.2 Trend of inflation in China:
2004 2006 2008 2010 2012 2014 2016
-2
-1
0
1
2
3
4
5
6
7
Inflation, consumer prices (annual %)
Inflation, consumer prices (annual
%)
Figure 4: Inflation trend in China
Source: (Data.worldbank.org, 2018)
The above figure has represented inflation trend of China since 2005 to 2014. From
this figure, it can be stated that inflation rate of this country has fluctuated drastically over the
years. After 2005, inflation has increased sharply while after 2008 this rate has reduced and
has become negative in 2009 (Liu & Chen, 2017). After this year, again inflation of China
has started to increase. Thus, inflation of China fluctuates rapidly due to its fastest growth.
Thu, extra liquidity has forced wages and prices to increase further while values of property
have soared. Between 2007 and 2008, labour disputes have increased rapidly due to increase
in food prices. Thus, they have started to demand higher wages.
occurs when aggregate demand of a country increases and this further lead price level to
increase further. In addition to this, cost-push inflation occurs when production cost of a
company increases.
4.2 Trend of inflation in China:
2004 2006 2008 2010 2012 2014 2016
-2
-1
0
1
2
3
4
5
6
7
Inflation, consumer prices (annual %)
Inflation, consumer prices (annual
%)
Figure 4: Inflation trend in China
Source: (Data.worldbank.org, 2018)
The above figure has represented inflation trend of China since 2005 to 2014. From
this figure, it can be stated that inflation rate of this country has fluctuated drastically over the
years. After 2005, inflation has increased sharply while after 2008 this rate has reduced and
has become negative in 2009 (Liu & Chen, 2017). After this year, again inflation of China
has started to increase. Thus, inflation of China fluctuates rapidly due to its fastest growth.
Thu, extra liquidity has forced wages and prices to increase further while values of property
have soared. Between 2007 and 2008, labour disputes have increased rapidly due to increase
in food prices. Thus, they have started to demand higher wages.
⊘ This is a preview!⊘
Do you want full access?
Subscribe today to unlock all pages.
Trusted by 1+ million students worldwide
9ECONOMICS ASSIGNMENT
4.3 Government measure to achieve stable price:
The government of China as tried to avoid this inflation rate by applying various
policies. However, these activities have remained unaffected (Su et al., 2017). The
government has tightened its monetary policy after global financial crisis. In 2011, it has
increased interest rate to achieve rapid growth of China’s economic condition.
5. Conclusion:
In conclusion, it can be said that economic condition of China has fluctuated over the
year. The global financial crisis has affected this country adversely. Hence, to overcome this
phase, the government of this country has spent huge amount of money and this in turn has
generated huge public debt. Moreover, due to some structural changes, economic growth of
this country has reduced over the year. In addition to this, GDP per capita of China has
remained low compare to that of U.S. This implies that, U.S has remained the largest
economy across the world with better standard of living for its citizens. Moreover,
unemployment rate has also remained high due to lower wages and lower aggregate demand
of the country. The government has applied various monetary and fiscal policies to reduce
this negative economic phenomenon of this country. In addition to this, inflation rate has also
fluctuated drastically between 2005 and 2014. However, the government cannot control this
by large amount.
Paraphrase This Document
Need a fresh take? Get an instant paraphrase of this document with our AI Paraphraser
10ECONOMICS ASSIGNMENT
References:
Boyce, C. J., Wood, A. M., Daly, M., & Sedikides, C. (2015). Personality change following
unemployment. Journal of Applied Psychology, 100(4), 991.
Brown, B. (2017). A MODERN CONCEPT OF ASSET PRICE INFLATION IN BOOM
AND DEPRESSION. Quarterly Journal of Austrian Economics, 20(1).
Feenstra, R. C., Ma, H., Peter Neary, J., & Prasada Rao, D. S. (2013). Who shrunk China?
Puzzles in the measurement of real GDP. The Economic Journal, 123(573), 1100-
1129.
Feinerman, J. V. (2017). New hope for corporate governance in China?. In Law and the
Market Economy in China (pp. 97-119). Routledge.
Feldstein, M. (2017). Underestimating the real growth of GDP, personal income, and
productivity. Journal of Economic Perspectives, 31(2), 145-64.
GDP growth (annual %) | Data. (2018). Data.worldbank.org. Retrieved 5 August 2018, from
https://data.worldbank.org/indicator/NY.GDP.MKTP.KD.ZG?
end=2014&locations=CN&start=2005
Grieve, R. H. (2018). A misinterpretation of Keynes’s concept of involuntary
unemployment. Equilibrium. Quarterly Journal of Economics and Economic
Policy, 13(2), 331-348.
Huang, S., & Fidrmuc, J. (2016). Unemployment and the Speed of Transition in China. Asian
Economic Papers, 15(1), 156-170.
Liu, H. Y., & Chen, X. L. (2017). The imported price, inflation and exchange rate pass-
through in China. Cogent Economics & Finance, 5(1), 1279814.
Lu, Y., Geng, Y., Liu, Z., Cote, R., & Yu, X. (2017). Measuring sustainability at the
community level: An overview of China's indicator system on National
Demonstration Sustainable Communities. Journal of cleaner production, 143, 326-
335.
11ECONOMICS ASSIGNMENT
Neuenkirch, M., & Neumeier, F. (2015). The impact of UN and US economic sanctions on
GDP growth. European Journal of Political Economy, 40, 110-125.
Rossi, B., & Sekhposyan, T. (2015). Macroeconomic uncertainty indices based on nowcast
and forecast error distributions. American Economic Review, 105(5), 650-55.
Su, C. W., Yu, H., Chang, H. L., & Li, X. L. (2017). How does inflation determine inflation
uncertainty? A Chinese perspective. Quality & Quantity, 51(3), 1417-1434.
Zhang, Y., Nie, R., Shi, R., & Zhang, M. (2018). Measuring the capacity utilization of the
coal sector and its decoupling with economic growth in China’s supply-side
reform. Resources, Conservation and Recycling, 129, 314-325.
Zhao, X., Xue, Y. M., Kang, W. L., Ding, L. L., & .Zhu, L. (2018). MEASURING
EFFICIENCY OF OCEAN ECONOMY IN CHINA BASED ON A NOVEL
LUENBERGER APPROACH Romanian Journal of Economic Forecasting, 21(2), 5.
⊘ This is a preview!⊘
Do you want full access?
Subscribe today to unlock all pages.
Trusted by 1+ million students worldwide
1 out of 12
Related Documents


Your All-in-One AI-Powered Toolkit for Academic Success.
+13062052269
info@desklib.com
Available 24*7 on WhatsApp / Email
![[object Object]](/_next/static/media/star-bottom.7253800d.svg)
Unlock your academic potential
Copyright © 2020–2026 A2Z Services. All Rights Reserved. Developed and managed by ZUCOL.