BUACC5931: Research Report on ISO 9000 Certification Impact in China
VerifiedAdded on 2022/10/10
|50
|5886
|51
Report
AI Summary
This report presents an empirical analysis of the impact of ISO 9000 certification on service firms in China, utilizing chi-square tests, ANOVA, and regression analysis. The study, based on secondary data from the National Bureau of Statistics of China, investigates the relationship between ISO 9000 certification and factors such as foreign direct investment (FDI), financial attributes, and business performance. The findings suggest that ISO 9000 certification is not a prerequisite for attracting overseas investment in Chinese service firms, although it does have a positive impact on profit through better quality management. The report provides descriptive and inferential statistics, including t-tests and correlation analyses, to support its conclusions, and discusses the implications of the findings for businesses. The study also acknowledges limitations and suggests areas for further research, offering valuable insights into the role and impact of ISO 9000 certification in the Chinese business context.
Running head: IMPACT OF ISO 9000 CERTIFICATION IN CHINA
Impact of ISO 9000 Certification in China
Name of the Student:
Name of the University:
Author Note:
Impact of ISO 9000 Certification in China
Name of the Student:
Name of the University:
Author Note:
Paraphrase This Document
Need a fresh take? Get an instant paraphrase of this document with our AI Paraphraser
1IMPACT OF ISO 9000 CERTIFICATION IN CHINA
Table of Contents
Executive Summary...................................................................................................................2
Back ground of the Study...........................................................................................................2
Literature Review.......................................................................................................................3
Methodology..............................................................................................................................4
Analysis and Findings................................................................................................................5
Descriptive Statistics..............................................................................................................5
Inferential Statistics................................................................................................................8
Sample Independent t-test..................................................................................................8
ANOVA...........................................................................................................................11
Chi-square test..................................................................................................................13
Correlation........................................................................................................................13
Discussion and Managerial Advices........................................................................................15
Limitation and Further Research..............................................................................................15
Reference..................................................................................................................................17
Appendices...............................................................................................................................20
Appendix 1...............................................................................................................................20
Appendix 2...............................................................................................................................41
Appendix 3...............................................................................................................................44
Appendix 4...............................................................................................................................46
2IMPACT OF ISO 9000 CERTIFICATION IN CHINA
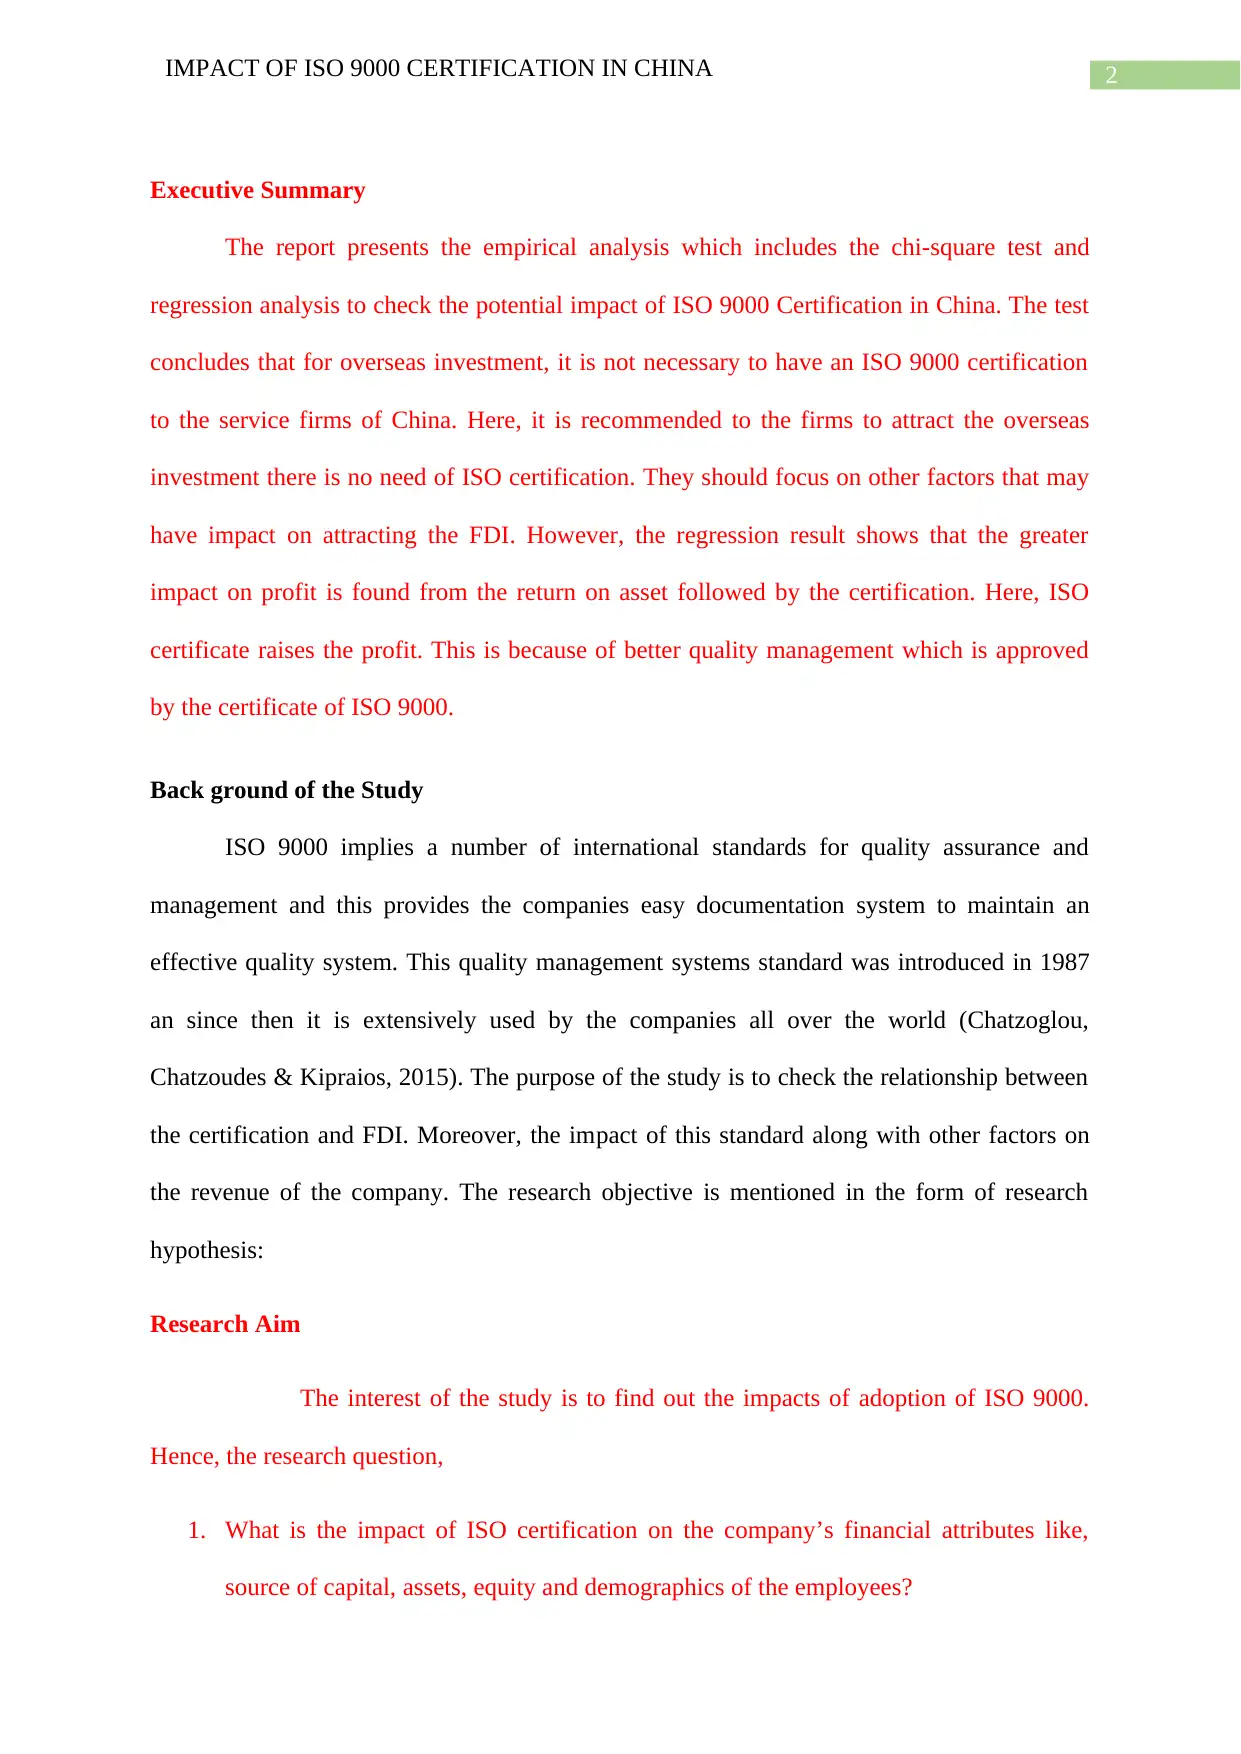
Executive Summary
The report presents the empirical analysis which includes the chi-square test and
regression analysis to check the potential impact of ISO 9000 Certification in China. The test
concludes that for overseas investment, it is not necessary to have an ISO 9000 certification
to the service firms of China. Here, it is recommended to the firms to attract the overseas
investment there is no need of ISO certification. They should focus on other factors that may
have impact on attracting the FDI. However, the regression result shows that the greater
impact on profit is found from the return on asset followed by the certification. Here, ISO
certificate raises the profit. This is because of better quality management which is approved
by the certificate of ISO 9000.
Back ground of the Study
ISO 9000 implies a number of international standards for quality assurance and
management and this provides the companies easy documentation system to maintain an
effective quality system. This quality management systems standard was introduced in 1987
an since then it is extensively used by the companies all over the world (Chatzoglou,
Chatzoudes & Kipraios, 2015). The purpose of the study is to check the relationship between
the certification and FDI. Moreover, the impact of this standard along with other factors on
the revenue of the company. The research objective is mentioned in the form of research
hypothesis:
Research Aim
The interest of the study is to find out the impacts of adoption of ISO 9000.
Hence, the research question,
1. What is the impact of ISO certification on the company’s financial attributes like,
source of capital, assets, equity and demographics of the employees?
⊘ This is a preview!⊘
Do you want full access?
Subscribe today to unlock all pages.
Trusted by 1+ million students worldwide
3IMPACT OF ISO 9000 CERTIFICATION IN CHINA
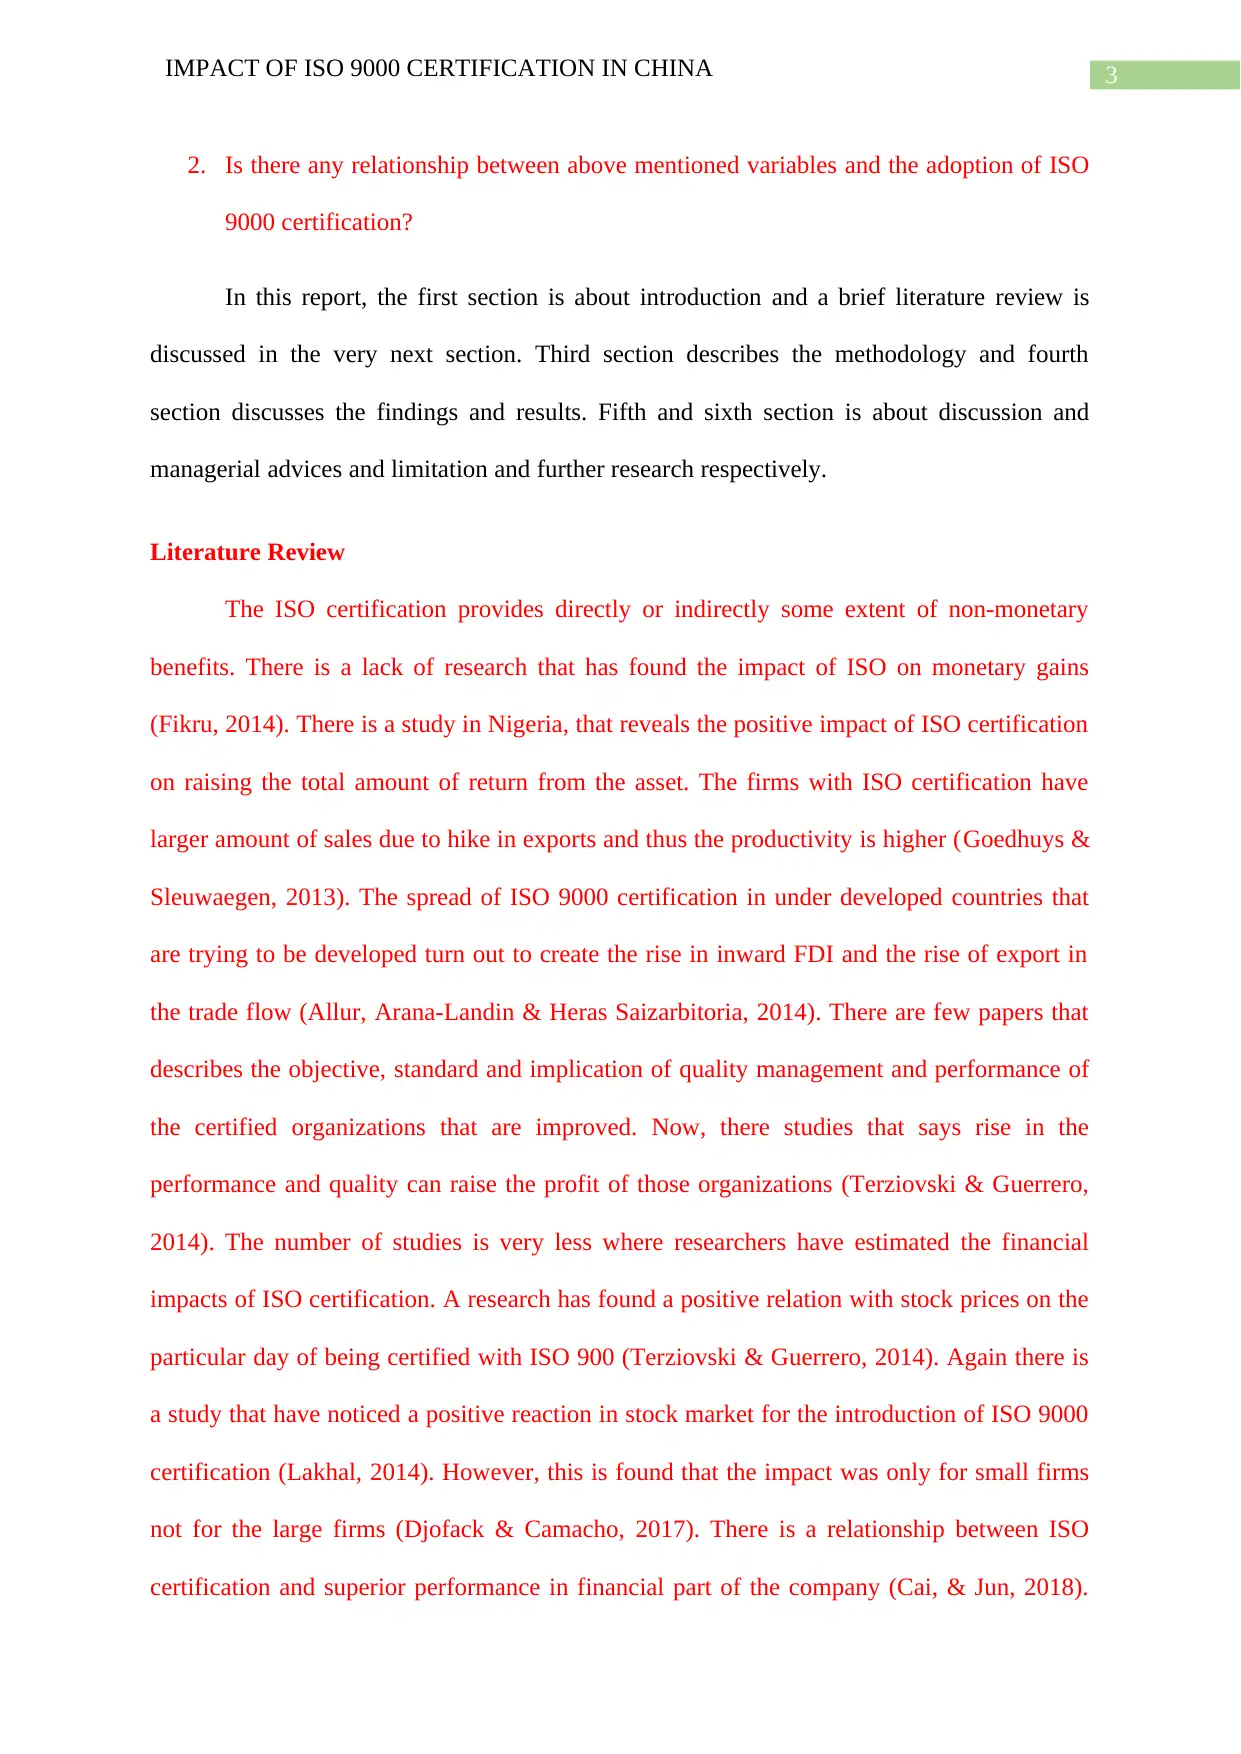
2. Is there any relationship between above mentioned variables and the adoption of ISO
9000 certification?
In this report, the first section is about introduction and a brief literature review is
discussed in the very next section. Third section describes the methodology and fourth
section discusses the findings and results. Fifth and sixth section is about discussion and
managerial advices and limitation and further research respectively.
Literature Review
The ISO certification provides directly or indirectly some extent of non-monetary
benefits. There is a lack of research that has found the impact of ISO on monetary gains
(Fikru, 2014). There is a study in Nigeria, that reveals the positive impact of ISO certification
on raising the total amount of return from the asset. The firms with ISO certification have
larger amount of sales due to hike in exports and thus the productivity is higher (Goedhuys &
Sleuwaegen, 2013). The spread of ISO 9000 certification in under developed countries that
are trying to be developed turn out to create the rise in inward FDI and the rise of export in
the trade flow (Allur, Arana-Landin & Heras Saizarbitoria, 2014). There are few papers that
describes the objective, standard and implication of quality management and performance of
the certified organizations that are improved. Now, there studies that says rise in the
performance and quality can raise the profit of those organizations (Terziovski & Guerrero,
2014). The number of studies is very less where researchers have estimated the financial
impacts of ISO certification. A research has found a positive relation with stock prices on the
particular day of being certified with ISO 900 (Terziovski & Guerrero, 2014). Again there is
a study that have noticed a positive reaction in stock market for the introduction of ISO 9000
certification (Lakhal, 2014). However, this is found that the impact was only for small firms
not for the large firms (Djofack & Camacho, 2017). There is a relationship between ISO
certification and superior performance in financial part of the company (Cai, & Jun, 2018).
Paraphrase This Document
Need a fresh take? Get an instant paraphrase of this document with our AI Paraphraser
4IMPACT OF ISO 9000 CERTIFICATION IN CHINA
This implies that the rise in stock price indicates a better position in financial sector which
has potential to raise the profit of the company. There is a study on 160 Australian
companies, it shows the positive impacts of ISO 9000 on relation with its customers, products
and services, the product quality awareness of the company, satisfaction of the customers,
management of the company and a relative growth of the company, with its competitors
(Ong, Kathawala & Sawalha, 2015). Similarly, another study conducted in UK has claimed
that the certification has contributed positively in raising the number of new contracts,
reducing the customer audits, improving the market relation and giving an international
exposure (Kunnaala, Lappalainen & Tapaninen, 2013). Moreover, there are studies that
claims that the ISO 9000 has a contribution in raising the operational and business
performance which is reflected by the attributes like collection of capital from different
sources, assets and equities which has direct linkage in raising business and the profit
(Georgiev & Georgiev, 2015). Again there are few studies which has claimed that the ISO
certification has no role in improvement of quality management, profitability and
productivity (Grela, 2015). In this case, it is necessary to check the profitability of a firm due
to ISO certification and the attributes that are linked with the financial performance of a firm.
Methodology
In order to find the significant evidence for the answers of research questions, a large
data is collected on service firms in China. The data is secondary and collected from the
National Bureau of Statistics of China from an economic census which was conducted in
2008. A chi-square test is conducted to find the association between FDI and ISO
certification. There is ANOVA test and independence test to check the mean difference in the
variables of certified and non-certified companies. The Pearson correlation is computed to
check the relationship between the variables sales, profit, asset, capital paid, capital from
others, return on sales and return on asset and ISO 9000 certification.
5IMPACT OF ISO 9000 CERTIFICATION IN CHINA
Analysis and Findings
Descriptive Statistics
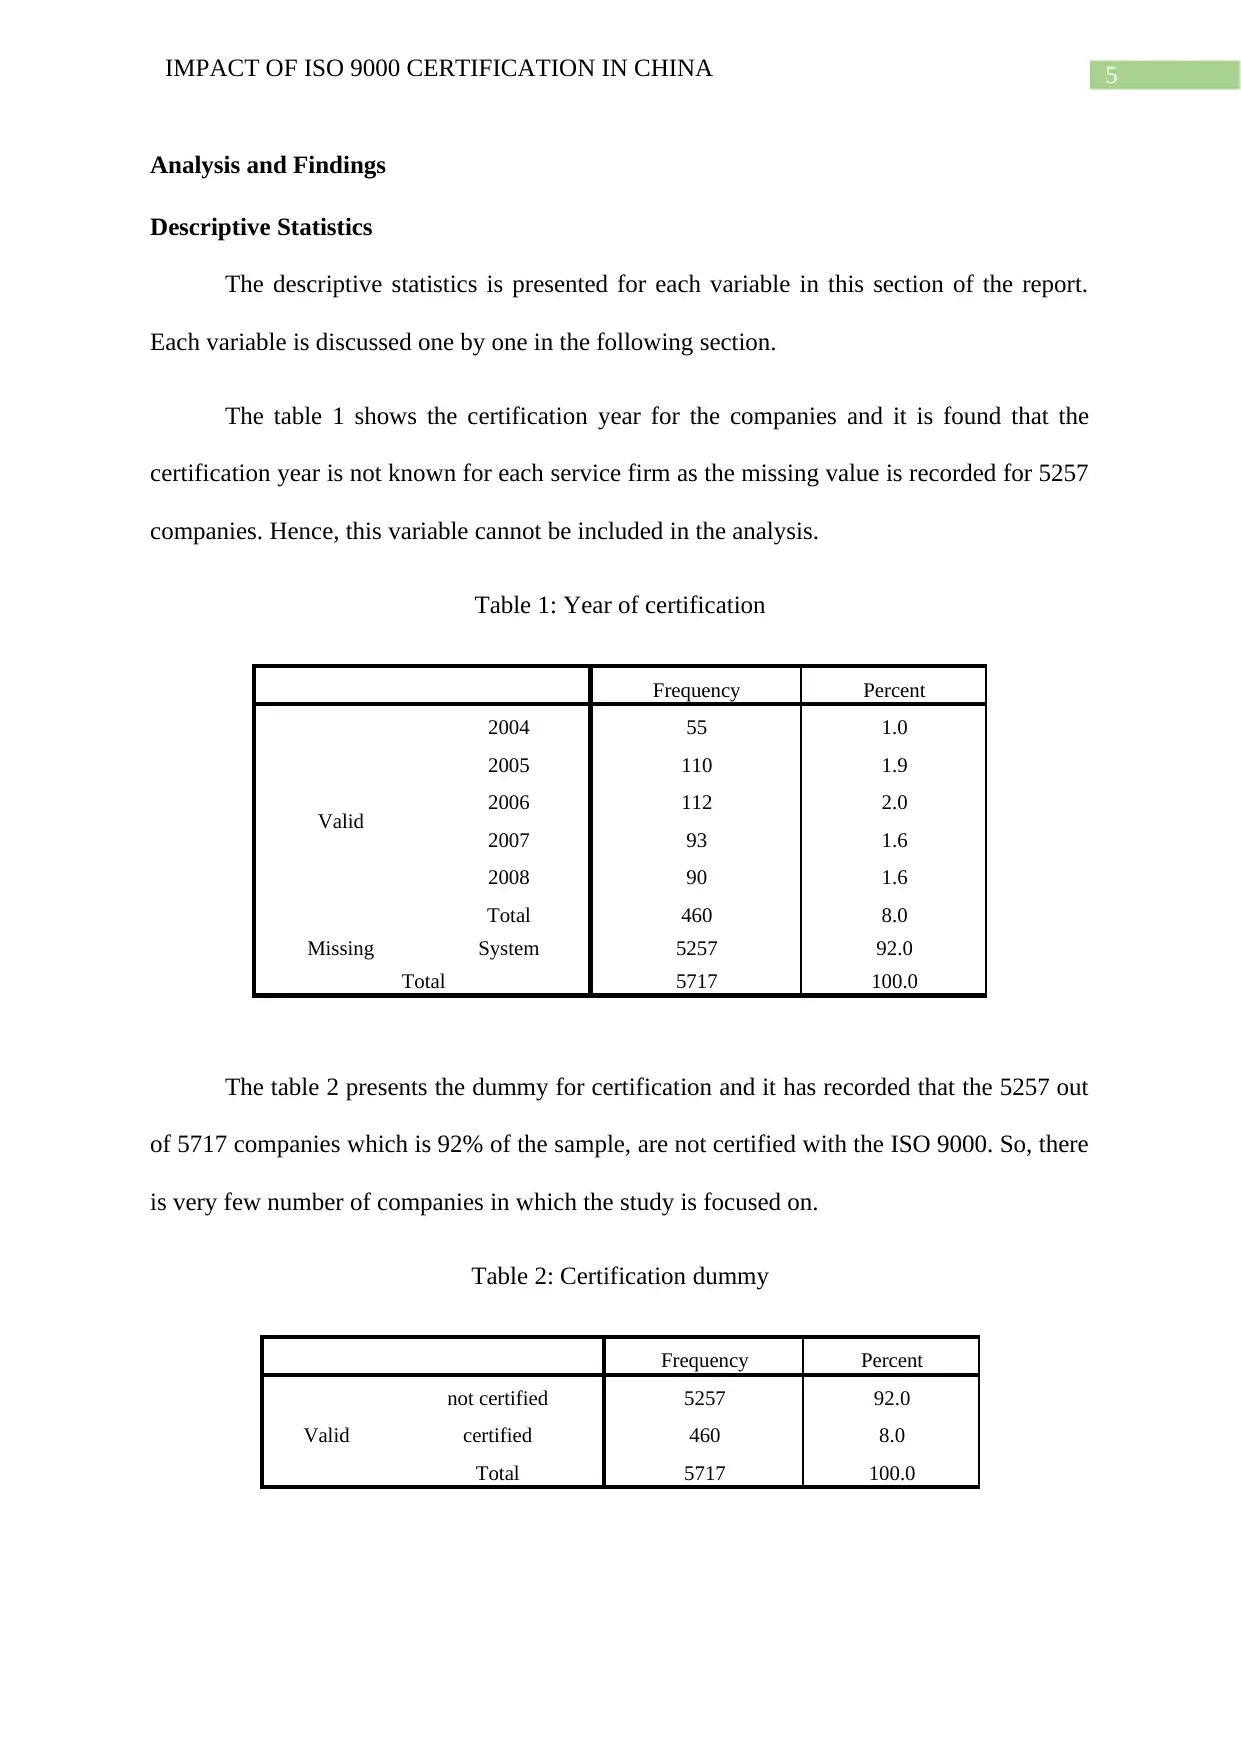
The descriptive statistics is presented for each variable in this section of the report.
Each variable is discussed one by one in the following section.
The table 1 shows the certification year for the companies and it is found that the
certification year is not known for each service firm as the missing value is recorded for 5257
companies. Hence, this variable cannot be included in the analysis.
Table 1: Year of certification
Frequency Percent
Valid
2004 55 1.0
2005 110 1.9
2006 112 2.0
2007 93 1.6
2008 90 1.6
Total 460 8.0
Missing System 5257 92.0
Total 5717 100.0
The table 2 presents the dummy for certification and it has recorded that the 5257 out
of 5717 companies which is 92% of the sample, are not certified with the ISO 9000. So, there
is very few number of companies in which the study is focused on.
Table 2: Certification dummy
Frequency Percent
Valid
not certified 5257 92.0
certified 460 8.0
Total 5717 100.0
Analysis and Findings
Descriptive Statistics
The descriptive statistics is presented for each variable in this section of the report.
Each variable is discussed one by one in the following section.
The table 1 shows the certification year for the companies and it is found that the
certification year is not known for each service firm as the missing value is recorded for 5257
companies. Hence, this variable cannot be included in the analysis.
Table 1: Year of certification
Frequency Percent
Valid
2004 55 1.0
2005 110 1.9
2006 112 2.0
2007 93 1.6
2008 90 1.6
Total 460 8.0
Missing System 5257 92.0
Total 5717 100.0
The table 2 presents the dummy for certification and it has recorded that the 5257 out
of 5717 companies which is 92% of the sample, are not certified with the ISO 9000. So, there
is very few number of companies in which the study is focused on.
Table 2: Certification dummy
Frequency Percent
Valid
not certified 5257 92.0
certified 460 8.0
Total 5717 100.0
⊘ This is a preview!⊘
Do you want full access?
Subscribe today to unlock all pages.
Trusted by 1+ million students worldwide
6IMPACT OF ISO 9000 CERTIFICATION IN CHINA
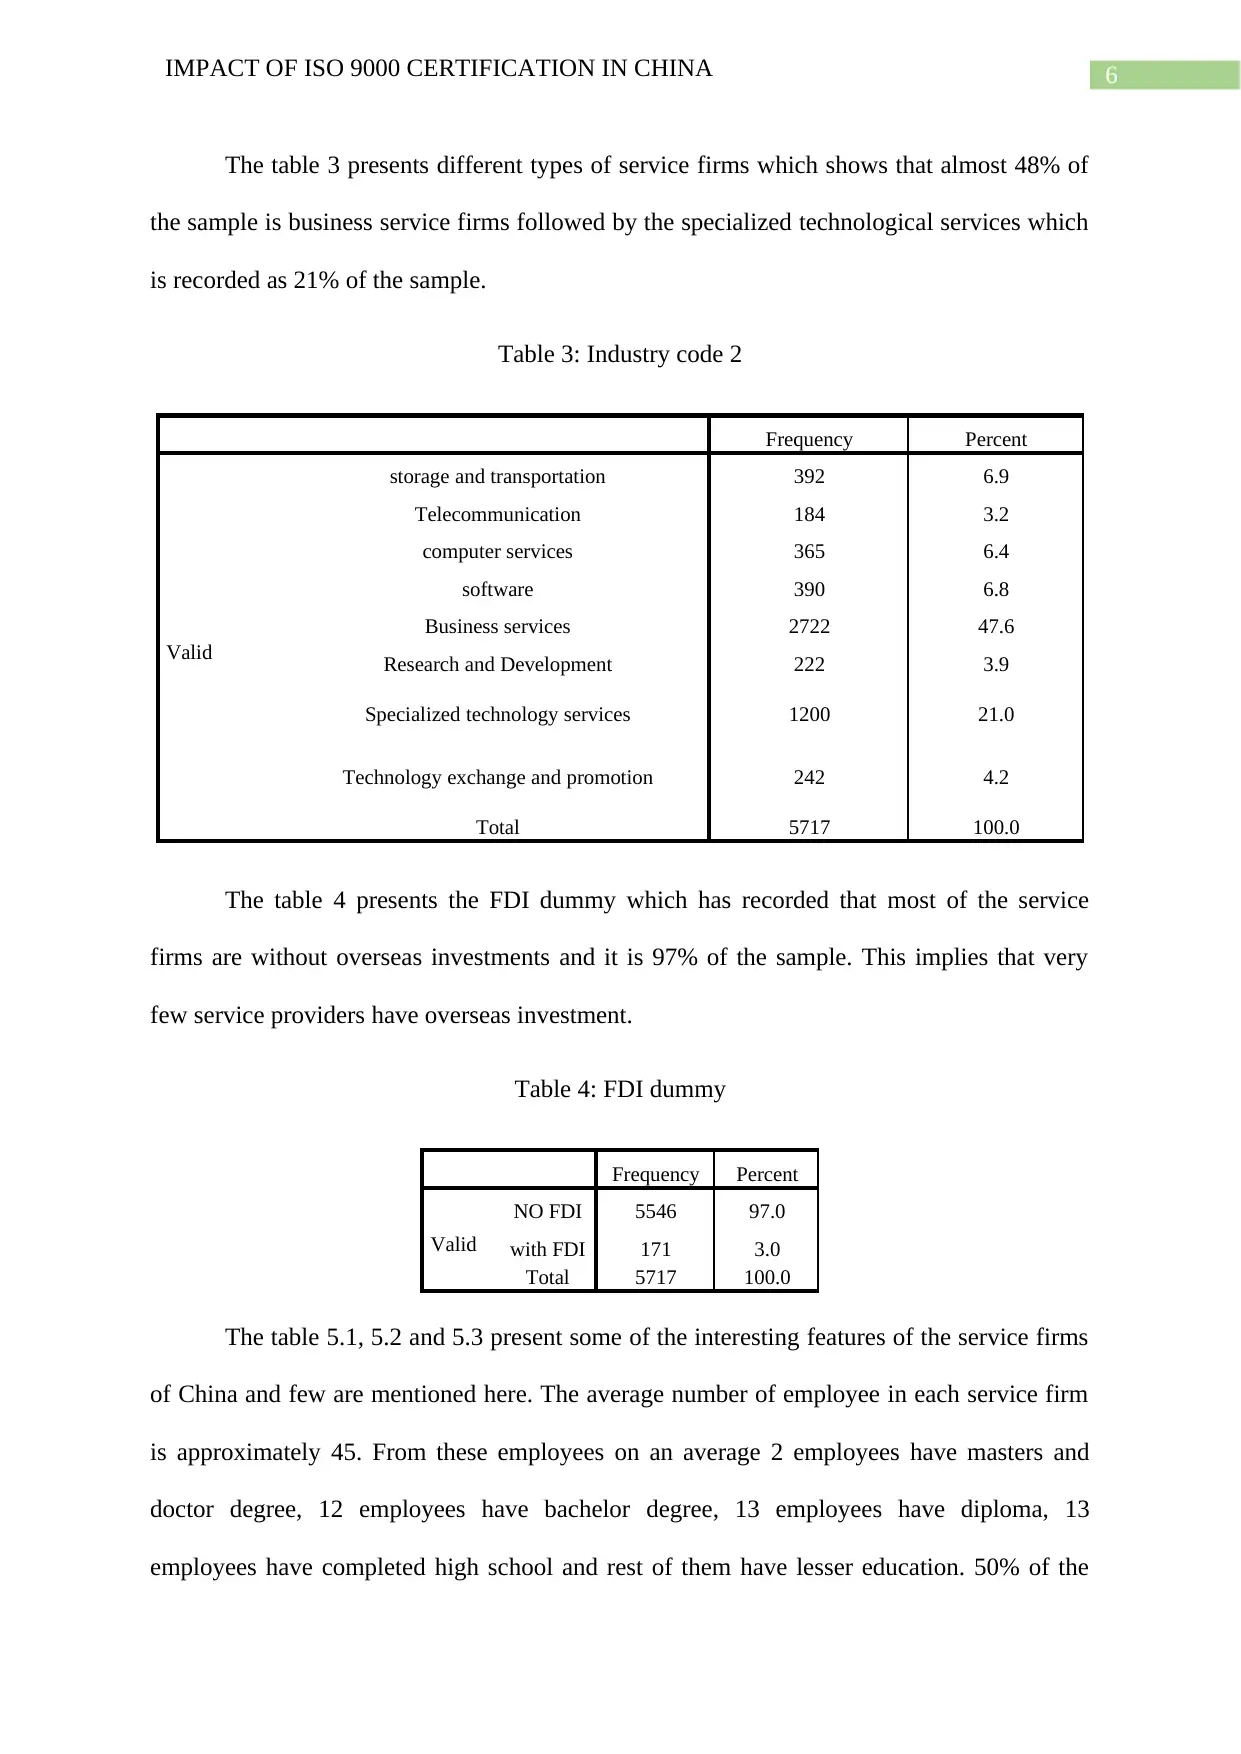
The table 3 presents different types of service firms which shows that almost 48% of
the sample is business service firms followed by the specialized technological services which
is recorded as 21% of the sample.
Table 3: Industry code 2
Frequency Percent
Valid
storage and transportation 392 6.9
Telecommunication 184 3.2
computer services 365 6.4
software 390 6.8
Business services 2722 47.6
Research and Development 222 3.9
Specialized technology services 1200 21.0
Technology exchange and promotion 242 4.2
Total 5717 100.0
The table 4 presents the FDI dummy which has recorded that most of the service
firms are without overseas investments and it is 97% of the sample. This implies that very
few service providers have overseas investment.
Table 4: FDI dummy
Frequency Percent
Valid
NO FDI 5546 97.0
with FDI 171 3.0
Total 5717 100.0
The table 5.1, 5.2 and 5.3 present some of the interesting features of the service firms
of China and few are mentioned here. The average number of employee in each service firm
is approximately 45. From these employees on an average 2 employees have masters and
doctor degree, 12 employees have bachelor degree, 13 employees have diploma, 13
employees have completed high school and rest of them have lesser education. 50% of the
Paraphrase This Document
Need a fresh take? Get an instant paraphrase of this document with our AI Paraphraser
7IMPACT OF ISO 9000 CERTIFICATION IN CHINA
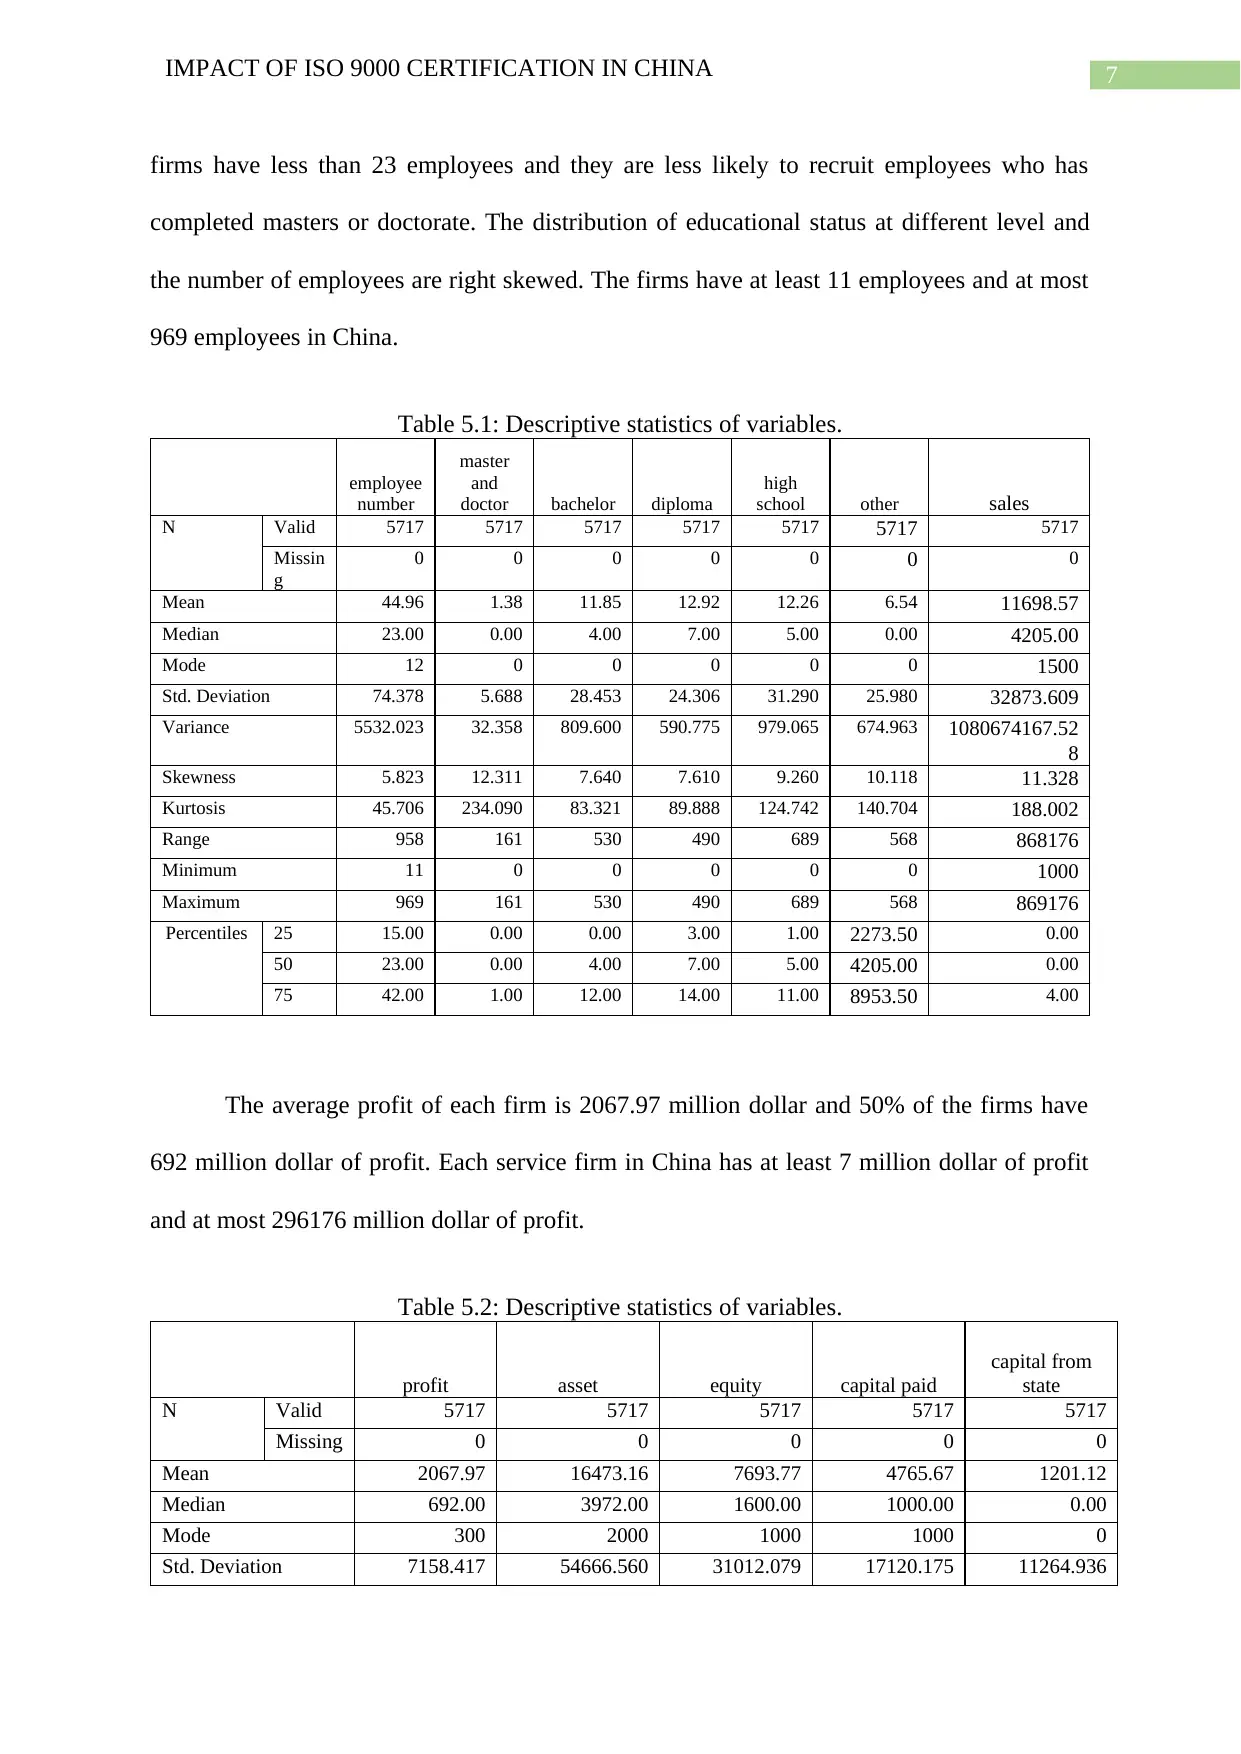
firms have less than 23 employees and they are less likely to recruit employees who has
completed masters or doctorate. The distribution of educational status at different level and
the number of employees are right skewed. The firms have at least 11 employees and at most
969 employees in China.
Table 5.1: Descriptive statistics of variables.
employee
number
master
and
doctor bachelor diploma
high
school other sales
N Valid 5717 5717 5717 5717 5717 5717 5717
Missin
g
0 0 0 0 0 0 0
Mean 44.96 1.38 11.85 12.92 12.26 6.54 11698.57
Median 23.00 0.00 4.00 7.00 5.00 0.00 4205.00
Mode 12 0 0 0 0 0 1500
Std. Deviation 74.378 5.688 28.453 24.306 31.290 25.980 32873.609
Variance 5532.023 32.358 809.600 590.775 979.065 674.963 1080674167.52
8
Skewness 5.823 12.311 7.640 7.610 9.260 10.118 11.328
Kurtosis 45.706 234.090 83.321 89.888 124.742 140.704 188.002
Range 958 161 530 490 689 568 868176
Minimum 11 0 0 0 0 0 1000
Maximum 969 161 530 490 689 568 869176
Percentiles 25 15.00 0.00 0.00 3.00 1.00 2273.50 0.00
50 23.00 0.00 4.00 7.00 5.00 4205.00 0.00
75 42.00 1.00 12.00 14.00 11.00 8953.50 4.00
The average profit of each firm is 2067.97 million dollar and 50% of the firms have
692 million dollar of profit. Each service firm in China has at least 7 million dollar of profit
and at most 296176 million dollar of profit.
Table 5.2: Descriptive statistics of variables.
profit asset equity capital paid
capital from
state
N Valid 5717 5717 5717 5717 5717
Missing 0 0 0 0 0
Mean 2067.97 16473.16 7693.77 4765.67 1201.12
Median 692.00 3972.00 1600.00 1000.00 0.00
Mode 300 2000 1000 1000 0
Std. Deviation 7158.417 54666.560 31012.079 17120.175 11264.936
8IMPACT OF ISO 9000 CERTIFICATION IN CHINA
Variance 51242940.369 2988432750.32
1
961749073.465 293100400.983 126898792.888
Skewness 19.254 9.296 12.702 11.566 20.017
Kurtosis 602.738 113.569 228.913 183.898 514.075
Range 296159 977548 879356 402100 402110
Minimum 17 1000 -1367 10 0
Maximum 296176 978548 877989 402110 402110
Percentile
s
25 313.00 2065.00 800.00 0.00 500.00
50 692.00 3972.00 1600.00 0.00 1000.00
75 1542.00 9671.00 4309.50 0.00 3000.00
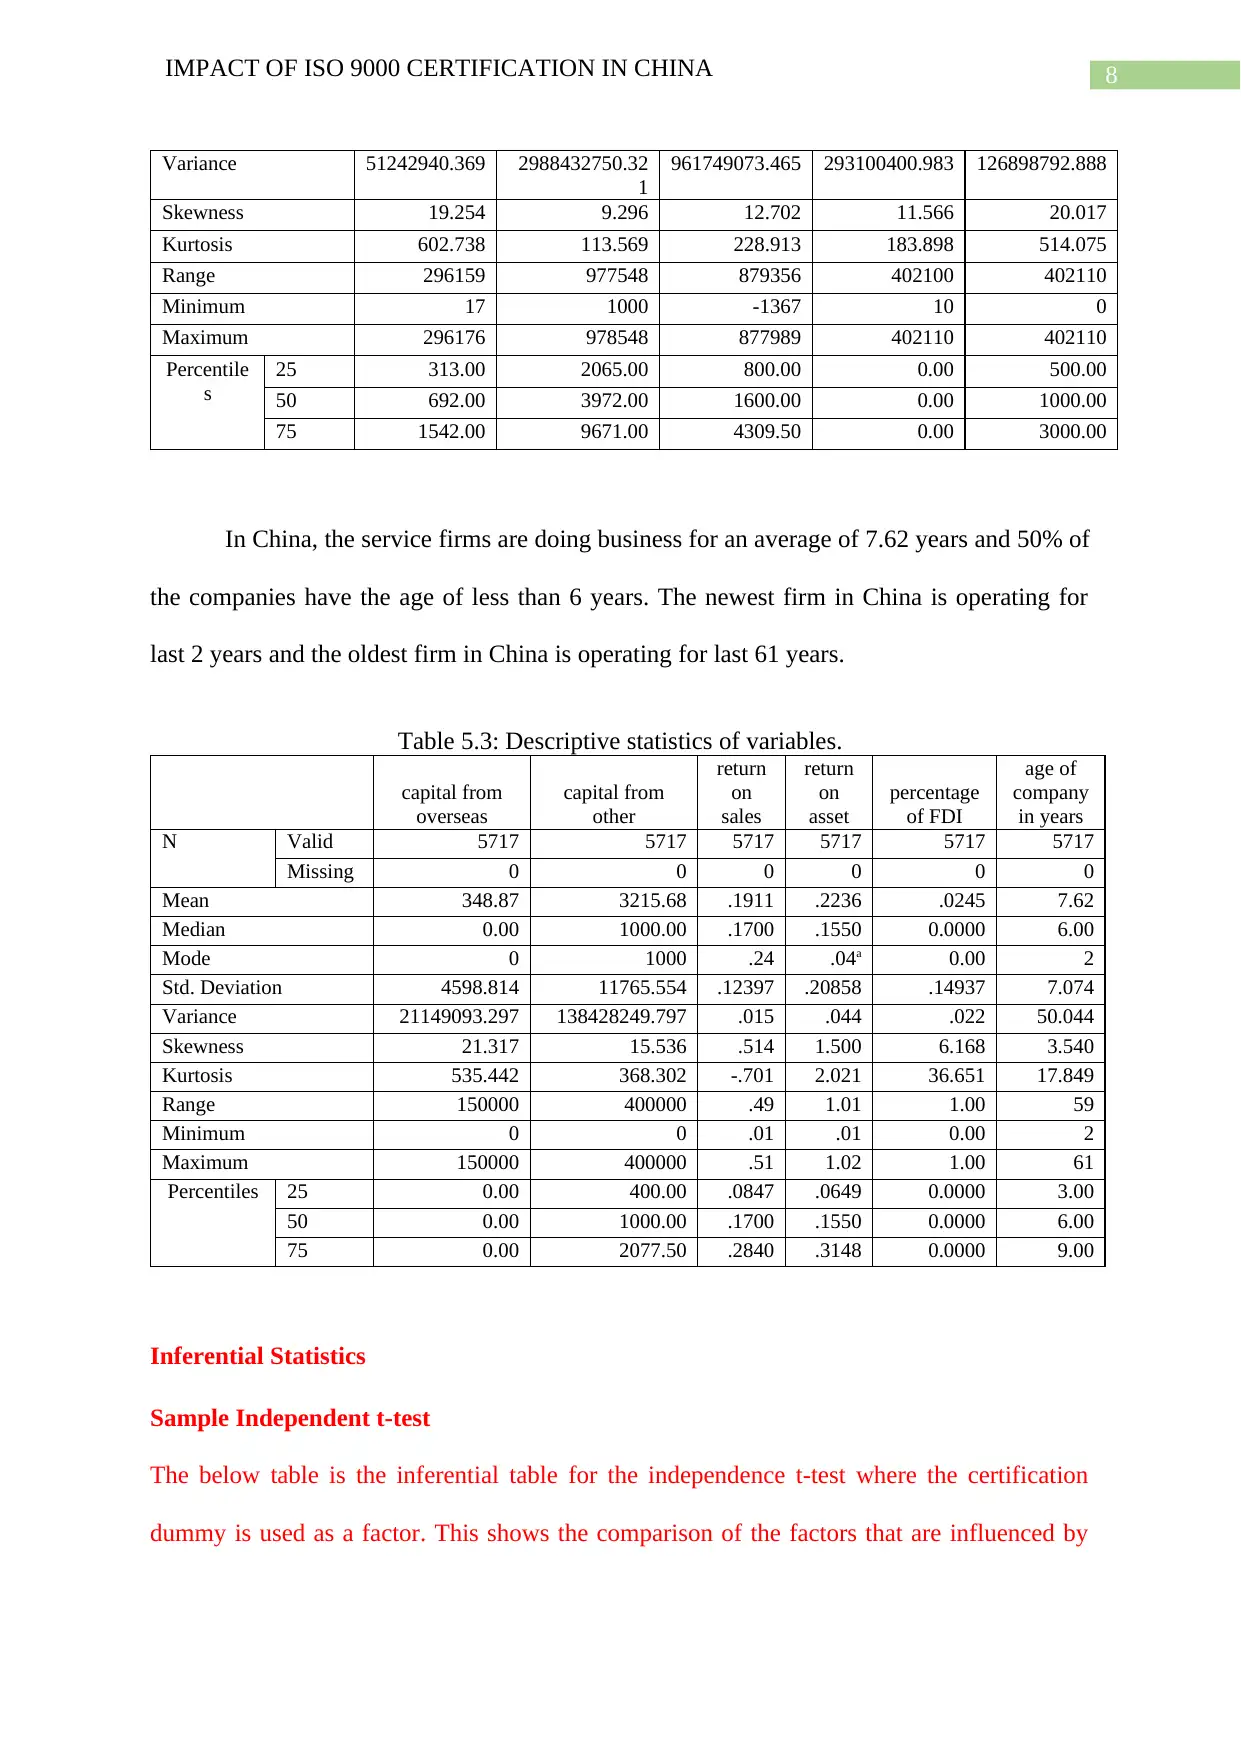
In China, the service firms are doing business for an average of 7.62 years and 50% of
the companies have the age of less than 6 years. The newest firm in China is operating for
last 2 years and the oldest firm in China is operating for last 61 years.
Table 5.3: Descriptive statistics of variables.
capital from
overseas
capital from
other
return
on
sales
return
on
asset
percentage
of FDI
age of
company
in years
N Valid 5717 5717 5717 5717 5717 5717
Missing 0 0 0 0 0 0
Mean 348.87 3215.68 .1911 .2236 .0245 7.62
Median 0.00 1000.00 .1700 .1550 0.0000 6.00
Mode 0 1000 .24 .04a 0.00 2
Std. Deviation 4598.814 11765.554 .12397 .20858 .14937 7.074
Variance 21149093.297 138428249.797 .015 .044 .022 50.044
Skewness 21.317 15.536 .514 1.500 6.168 3.540
Kurtosis 535.442 368.302 -.701 2.021 36.651 17.849
Range 150000 400000 .49 1.01 1.00 59
Minimum 0 0 .01 .01 0.00 2
Maximum 150000 400000 .51 1.02 1.00 61
Percentiles 25 0.00 400.00 .0847 .0649 0.0000 3.00
50 0.00 1000.00 .1700 .1550 0.0000 6.00
75 0.00 2077.50 .2840 .3148 0.0000 9.00
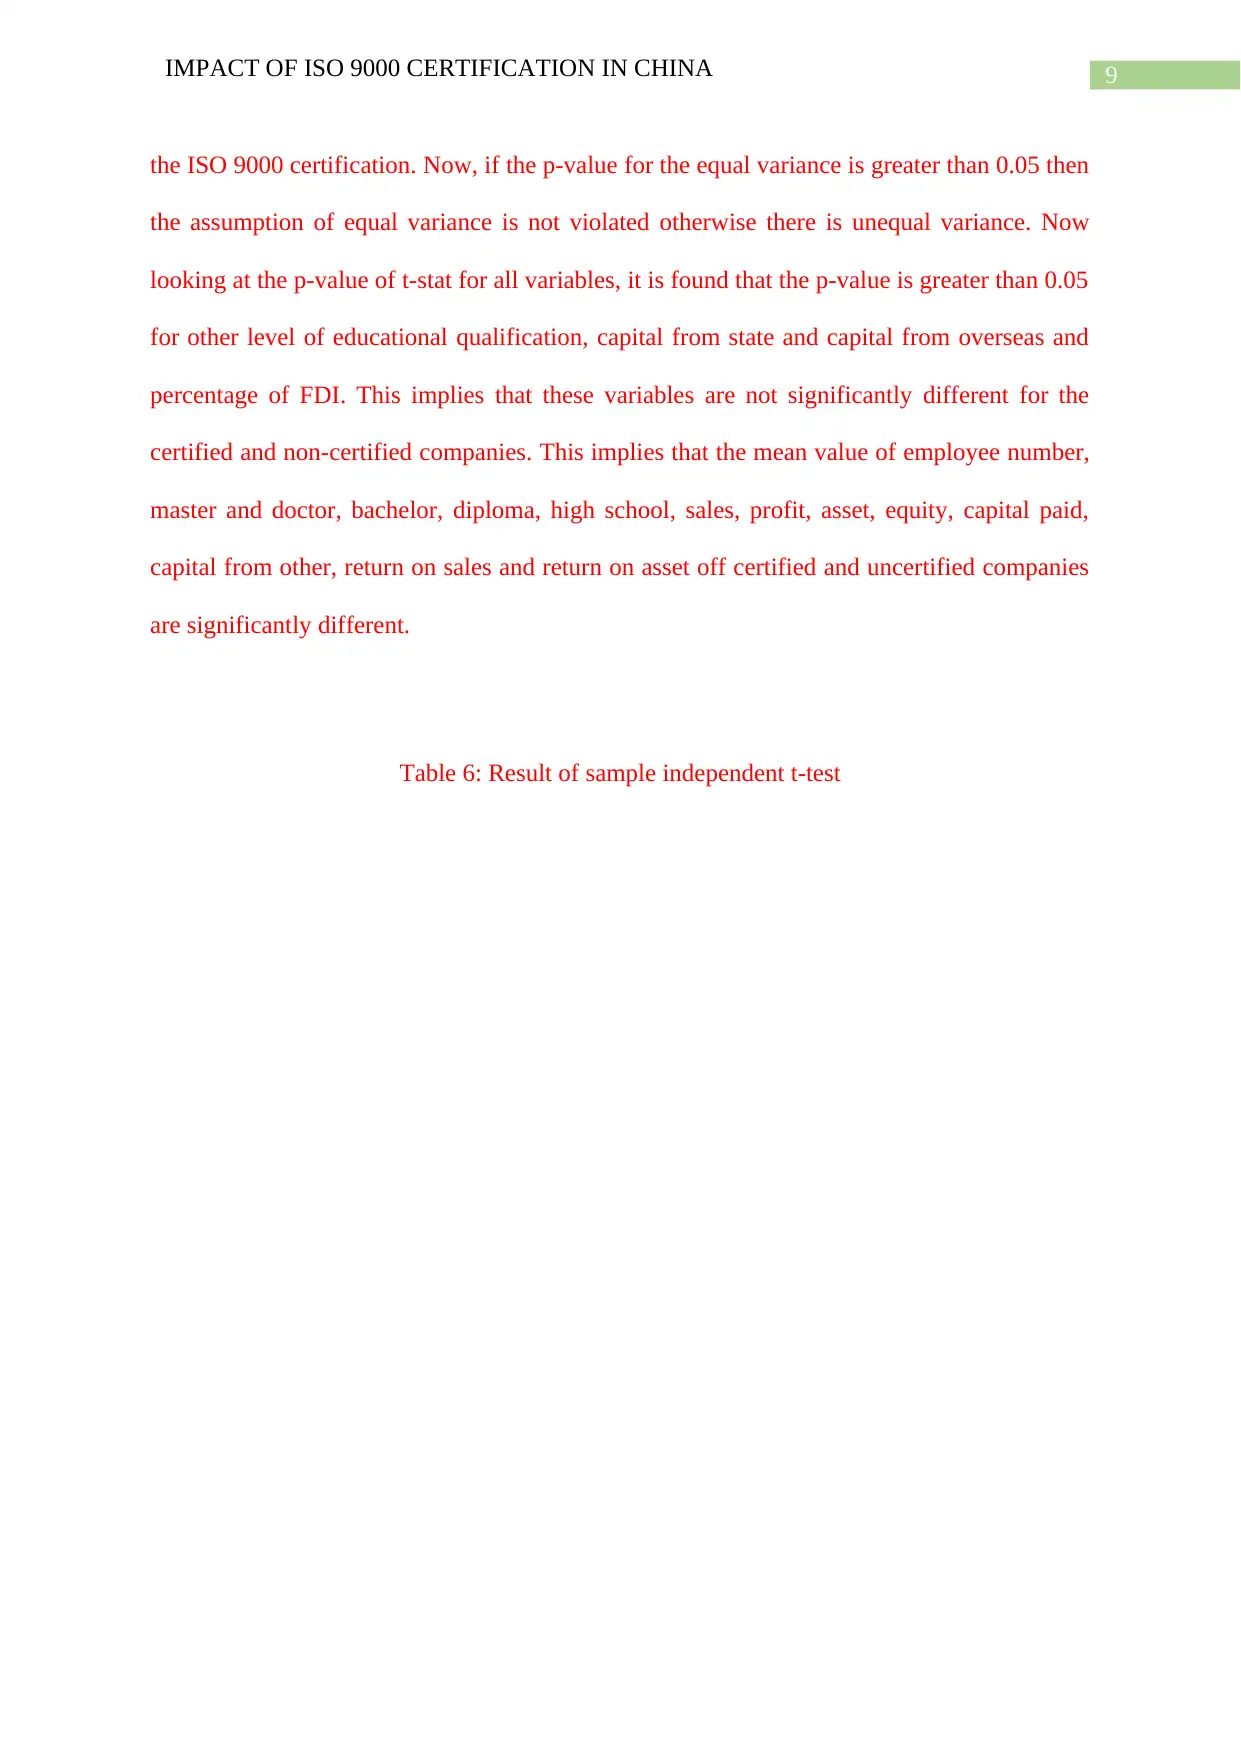
Inferential Statistics
Sample Independent t-test
The below table is the inferential table for the independence t-test where the certification
dummy is used as a factor. This shows the comparison of the factors that are influenced by
Variance 51242940.369 2988432750.32
1
961749073.465 293100400.983 126898792.888
Skewness 19.254 9.296 12.702 11.566 20.017
Kurtosis 602.738 113.569 228.913 183.898 514.075
Range 296159 977548 879356 402100 402110
Minimum 17 1000 -1367 10 0
Maximum 296176 978548 877989 402110 402110
Percentile
s
25 313.00 2065.00 800.00 0.00 500.00
50 692.00 3972.00 1600.00 0.00 1000.00
75 1542.00 9671.00 4309.50 0.00 3000.00
In China, the service firms are doing business for an average of 7.62 years and 50% of
the companies have the age of less than 6 years. The newest firm in China is operating for
last 2 years and the oldest firm in China is operating for last 61 years.
Table 5.3: Descriptive statistics of variables.
capital from
overseas
capital from
other
return
on
sales
return
on
asset
percentage
of FDI
age of
company
in years
N Valid 5717 5717 5717 5717 5717 5717
Missing 0 0 0 0 0 0
Mean 348.87 3215.68 .1911 .2236 .0245 7.62
Median 0.00 1000.00 .1700 .1550 0.0000 6.00
Mode 0 1000 .24 .04a 0.00 2
Std. Deviation 4598.814 11765.554 .12397 .20858 .14937 7.074
Variance 21149093.297 138428249.797 .015 .044 .022 50.044
Skewness 21.317 15.536 .514 1.500 6.168 3.540
Kurtosis 535.442 368.302 -.701 2.021 36.651 17.849
Range 150000 400000 .49 1.01 1.00 59
Minimum 0 0 .01 .01 0.00 2
Maximum 150000 400000 .51 1.02 1.00 61
Percentiles 25 0.00 400.00 .0847 .0649 0.0000 3.00
50 0.00 1000.00 .1700 .1550 0.0000 6.00
75 0.00 2077.50 .2840 .3148 0.0000 9.00
Inferential Statistics
Sample Independent t-test
The below table is the inferential table for the independence t-test where the certification
dummy is used as a factor. This shows the comparison of the factors that are influenced by
⊘ This is a preview!⊘
Do you want full access?
Subscribe today to unlock all pages.
Trusted by 1+ million students worldwide
9IMPACT OF ISO 9000 CERTIFICATION IN CHINA
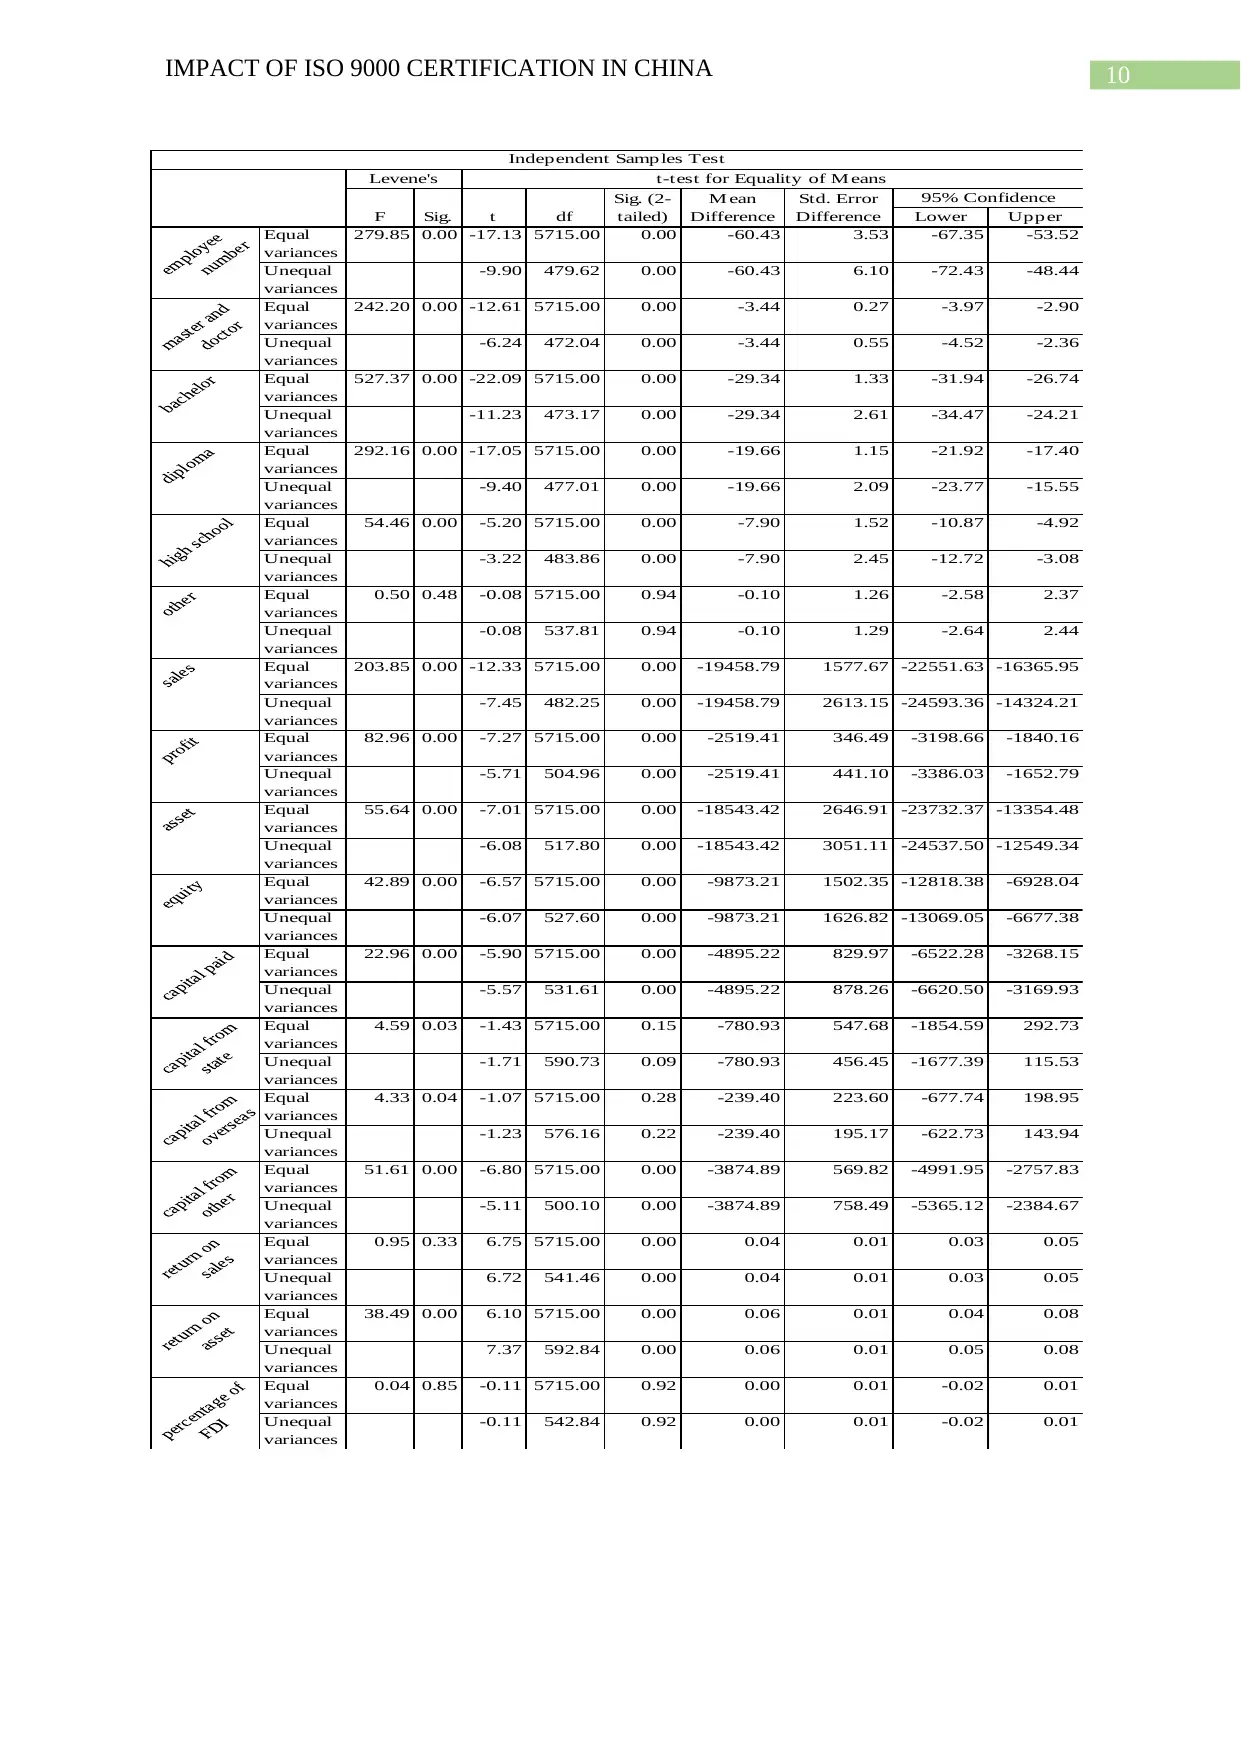
the ISO 9000 certification. Now, if the p-value for the equal variance is greater than 0.05 then
the assumption of equal variance is not violated otherwise there is unequal variance. Now
looking at the p-value of t-stat for all variables, it is found that the p-value is greater than 0.05
for other level of educational qualification, capital from state and capital from overseas and
percentage of FDI. This implies that these variables are not significantly different for the
certified and non-certified companies. This implies that the mean value of employee number,
master and doctor, bachelor, diploma, high school, sales, profit, asset, equity, capital paid,
capital from other, return on sales and return on asset off certified and uncertified companies
are significantly different.
Table 6: Result of sample independent t-test
Paraphrase This Document
Need a fresh take? Get an instant paraphrase of this document with our AI Paraphraser
10IMPACT OF ISO 9000 CERTIFICATION IN CHINA
Lower Upper
Std. Error
Difference
95% Confidence
Independent Samples Test
Levene's t-test for Equality of Means
F Sig. t df
Sig. (2-
tailed)
M ean
Difference
Equal
variances
279.85 0.00 -17.13 5715.00 0.00 -60.43 3.53 -67.35 -53.52
Unequal
variances
-9.90 479.62 0.00 -60.43 6.10 -72.43 -48.44
Equal
variances
242.20 0.00 -12.61 5715.00 0.00 -3.44 0.27 -3.97 -2.90
Unequal
variances
-6.24 472.04 0.00 -3.44 0.55 -4.52 -2.36
Equal
variances
527.37 0.00 -22.09 5715.00 0.00 -29.34 1.33 -31.94 -26.74
Unequal
variances
-11.23 473.17 0.00 -29.34 2.61 -34.47 -24.21
Equal
variances
292.16 0.00 -17.05 5715.00 0.00 -19.66 1.15 -21.92 -17.40
Unequal
variances
-9.40 477.01 0.00 -19.66 2.09 -23.77 -15.55
Equal
variances
54.46 0.00 -5.20 5715.00 0.00 -7.90 1.52 -10.87 -4.92
Unequal
variances
-3.22 483.86 0.00 -7.90 2.45 -12.72 -3.08
Equal
variances
0.50 0.48 -0.08 5715.00 0.94 -0.10 1.26 -2.58 2.37
Unequal
variances
-0.08 537.81 0.94 -0.10 1.29 -2.64 2.44
Equal
variances
203.85 0.00 -12.33 5715.00 0.00 -19458.79 1577.67 -22551.63 -16365.95
Unequal
variances
-7.45 482.25 0.00 -19458.79 2613.15 -24593.36 -14324.21
Equal
variances
82.96 0.00 -7.27 5715.00 0.00 -2519.41 346.49 -3198.66 -1840.16
Unequal
variances
-5.71 504.96 0.00 -2519.41 441.10 -3386.03 -1652.79
Equal
variances
55.64 0.00 -7.01 5715.00 0.00 -18543.42 2646.91 -23732.37 -13354.48
Unequal
variances
-6.08 517.80 0.00 -18543.42 3051.11 -24537.50 -12549.34
Equal
variances
42.89 0.00 -6.57 5715.00 0.00 -9873.21 1502.35 -12818.38 -6928.04
Unequal
variances
-6.07 527.60 0.00 -9873.21 1626.82 -13069.05 -6677.38
Equal
variances
22.96 0.00 -5.90 5715.00 0.00 -4895.22 829.97 -6522.28 -3268.15
Unequal
variances
-5.57 531.61 0.00 -4895.22 878.26 -6620.50 -3169.93
Equal
variances
4.59 0.03 -1.43 5715.00 0.15 -780.93 547.68 -1854.59 292.73
Unequal
variances
-1.71 590.73 0.09 -780.93 456.45 -1677.39 115.53
Equal
variances
4.33 0.04 -1.07 5715.00 0.28 -239.40 223.60 -677.74 198.95
Unequal
variances
-1.23 576.16 0.22 -239.40 195.17 -622.73 143.94
Equal
variances
51.61 0.00 -6.80 5715.00 0.00 -3874.89 569.82 -4991.95 -2757.83
Unequal
variances
-5.11 500.10 0.00 -3874.89 758.49 -5365.12 -2384.67
Equal
variances
0.95 0.33 6.75 5715.00 0.00 0.04 0.01 0.03 0.05
Unequal
variances
6.72 541.46 0.00 0.04 0.01 0.03 0.05
Equal
variances
38.49 0.00 6.10 5715.00 0.00 0.06 0.01 0.04 0.08
Unequal
variances
7.37 592.84 0.00 0.06 0.01 0.05 0.08
Equal
variances
0.04 0.85 -0.11 5715.00 0.92 0.00 0.01 -0.02 0.01
Unequal
variances
-0.11 542.84 0.92 0.00 0.01 -0.02 0.01
11IMPACT OF ISO 9000 CERTIFICATION IN CHINA
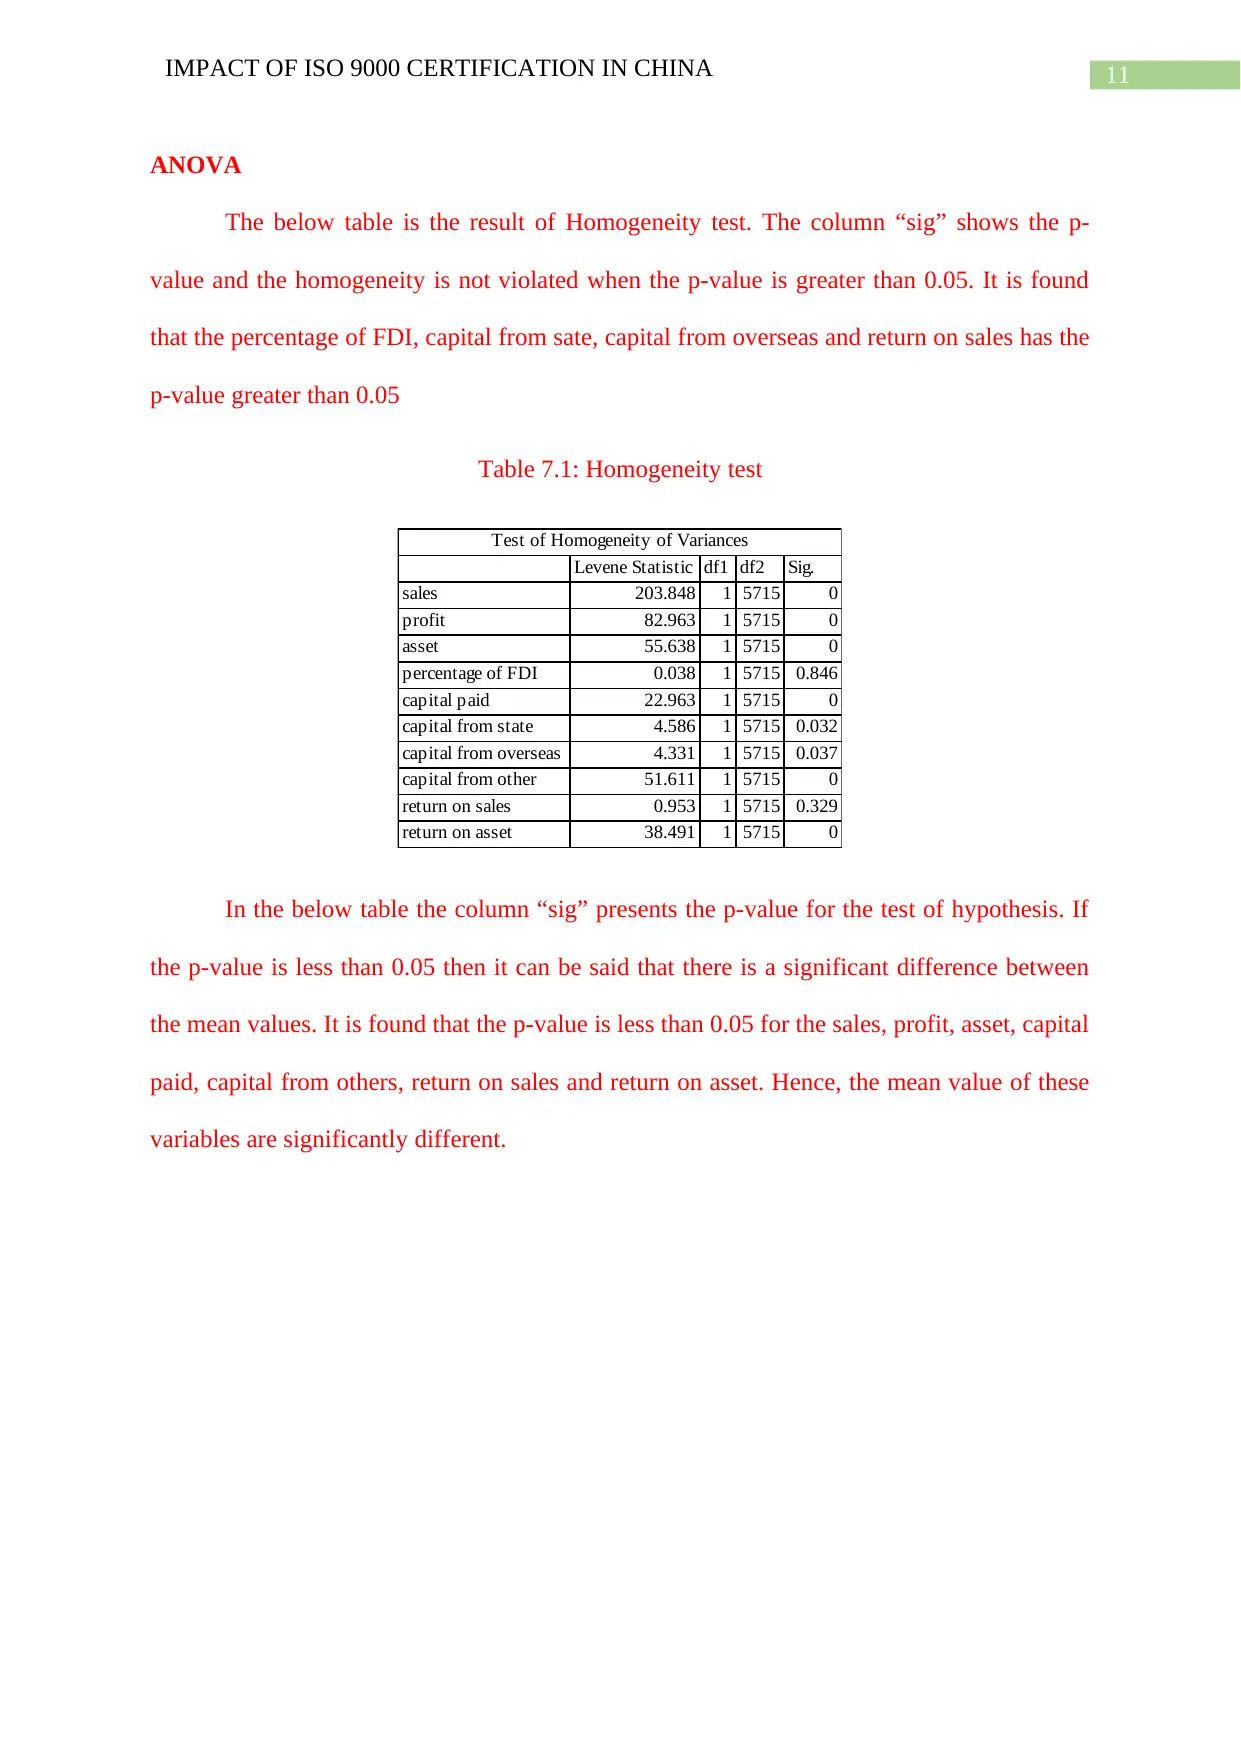
ANOVA
The below table is the result of Homogeneity test. The column “sig” shows the p-
value and the homogeneity is not violated when the p-value is greater than 0.05. It is found
that the percentage of FDI, capital from sate, capital from overseas and return on sales has the
p-value greater than 0.05
Table 7.1: Homogeneity test
Levene Statistic df1 df2 Sig.
sales 203.848 1 5715 0
profit 82.963 1 5715 0
asset 55.638 1 5715 0
percentage of FDI 0.038 1 5715 0.846
capital paid 22.963 1 5715 0
capital from state 4.586 1 5715 0.032
capital from overseas 4.331 1 5715 0.037
capital from other 51.611 1 5715 0
return on sales 0.953 1 5715 0.329
return on asset 38.491 1 5715 0
Test of Homogeneity of Variances
In the below table the column “sig” presents the p-value for the test of hypothesis. If
the p-value is less than 0.05 then it can be said that there is a significant difference between
the mean values. It is found that the p-value is less than 0.05 for the sales, profit, asset, capital
paid, capital from others, return on sales and return on asset. Hence, the mean value of these
variables are significantly different.
⊘ This is a preview!⊘
Do you want full access?
Subscribe today to unlock all pages.
Trusted by 1+ million students worldwide
1 out of 50
Related Documents


Your All-in-One AI-Powered Toolkit for Academic Success.
+13062052269
info@desklib.com
Available 24*7 on WhatsApp / Email
![[object Object]](/_next/static/media/star-bottom.7253800d.svg)
Unlock your academic potential
Copyright © 2020–2026 A2Z Services. All Rights Reserved. Developed and managed by ZUCOL.