Chlamydia Knowledge Assessment: A Demographic Study Report
VerifiedAdded on 2023/06/11
|17
|4309
|171
Report
AI Summary
This report presents a descriptive statistical analysis of data collected from 100 respondents to assess their knowledge of chlamydia. The analysis includes frequency distributions and cross-tabulations with chi-square tests to examine the influence of demographic variables such as age, gender, marital status, and education level on chlamydia knowledge. The findings indicate that while respondents generally possess a fair understanding of chlamydia, certain misconceptions persist, particularly regarding specific symptoms. The study reveals that age, marital status, and education level do not significantly influence the level of knowledge within the respondent population, whereas gender shows that females have a slightly higher knowledge. The report provides detailed tables and figures illustrating the distribution of responses and the statistical significance of the observed differences, offering valuable insights into public health awareness and potential areas for targeted educational interventions. The study is useful for students and researchers, and similar solved assignments are available on Desklib.
Please start the assignment from here:
Data Analysis
Descriptive statistics were performed: Frewquency analysis, Cross tabulation
with chi square tests
4.0 Results
To fulfil the aim and objectives of present research the data collected from 100 respondents
was subjected to descriptive analysis. This was done in order to analyse the level of
knowledge of regarding chlamydia, and the effect of demographic variables of gender, age,
marital status, and level of education. The demographic information of the respondent
population is as shown in Table 1. The maximum proportion of respondent population
belonged to the age group 23-23 years (28%), with 70 % females. A large proportion of
student reported their level of study as bachelors (51%), followed by postgraduate
coursework (40%). The majority of respondent population was married (53%), followed by
those who were single (41%). Therefore, the respondent population allows for a balanced
observation of knowledge between married and single individuals. However, the population
is biased in terms of gender, as females compose major percentage of population.
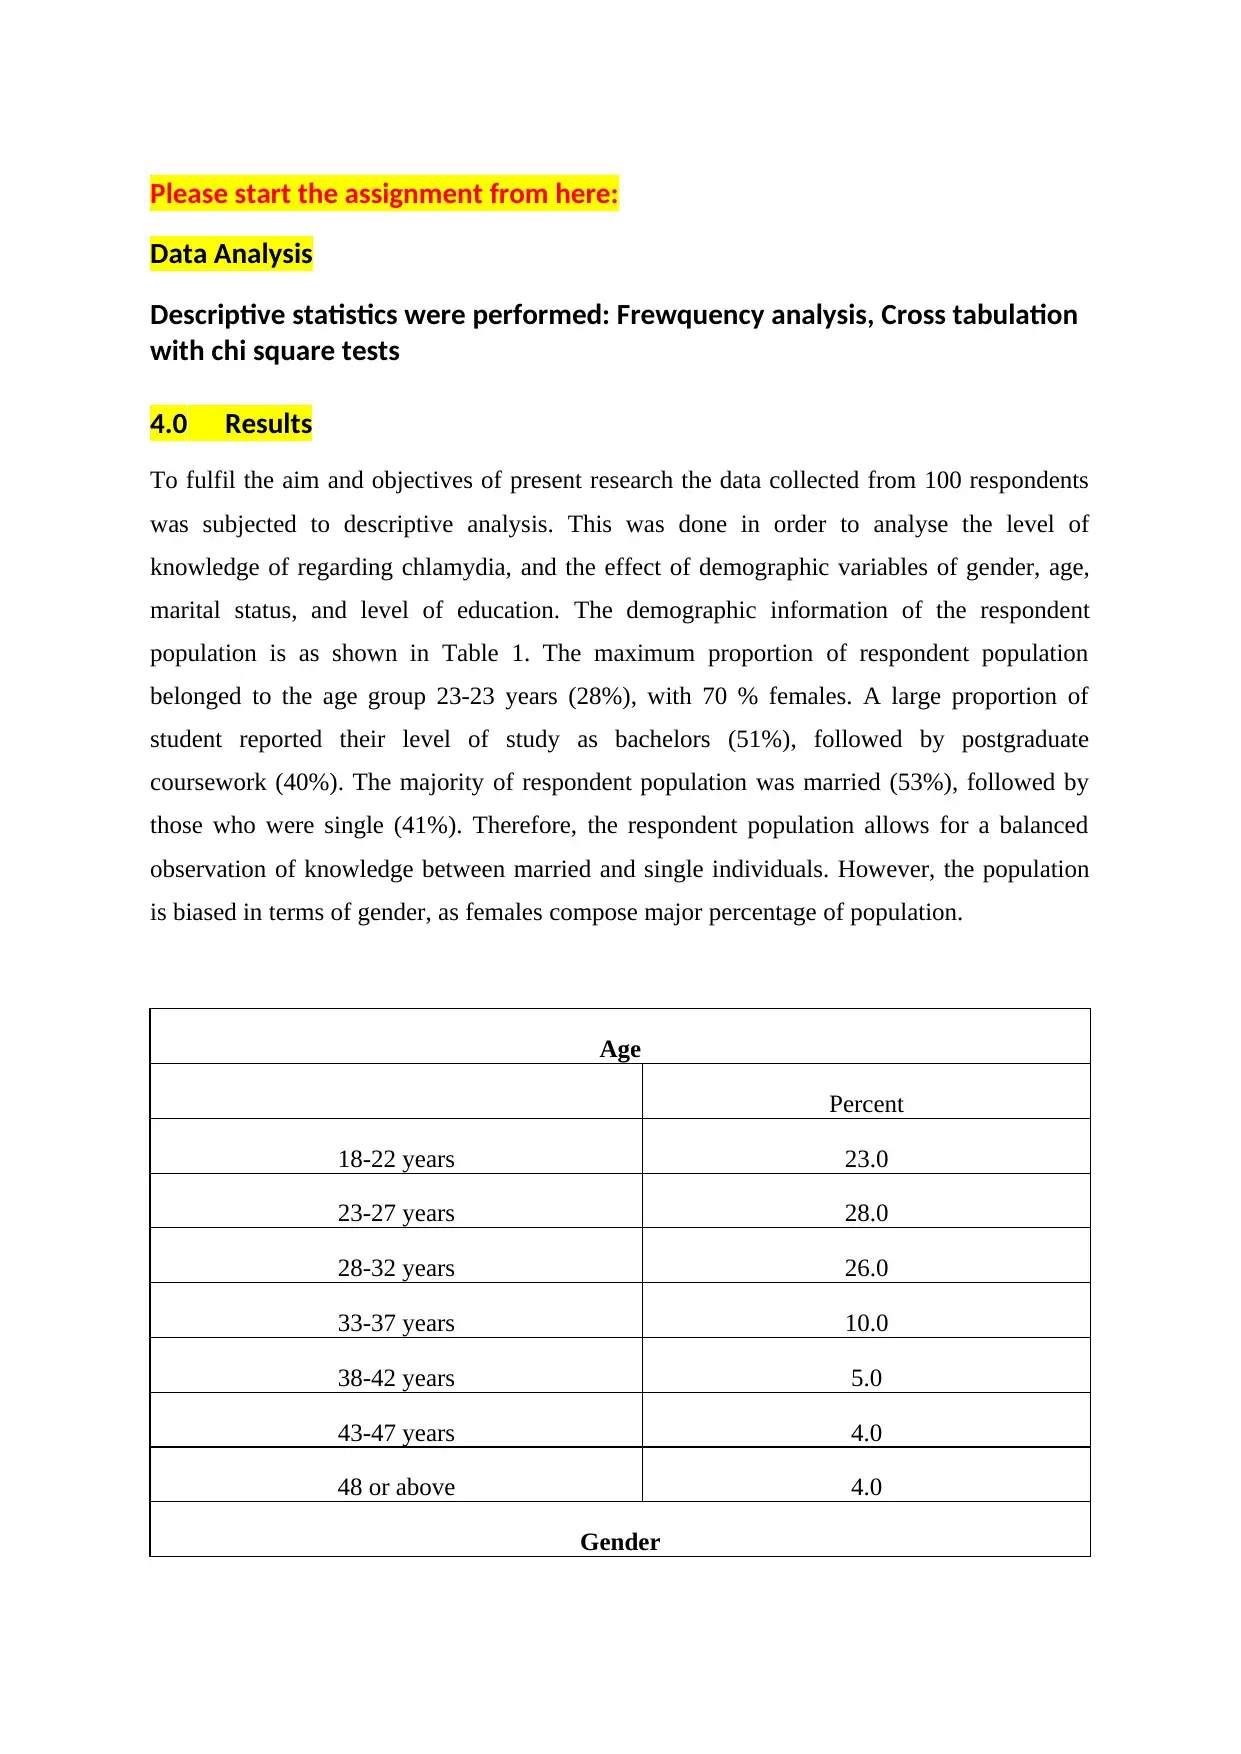
Age
Percent
18-22 years 23.0
23-27 years 28.0
28-32 years 26.0
33-37 years 10.0
38-42 years 5.0
43-47 years 4.0
48 or above 4.0
Gender
Data Analysis
Descriptive statistics were performed: Frewquency analysis, Cross tabulation
with chi square tests
4.0 Results
To fulfil the aim and objectives of present research the data collected from 100 respondents
was subjected to descriptive analysis. This was done in order to analyse the level of
knowledge of regarding chlamydia, and the effect of demographic variables of gender, age,
marital status, and level of education. The demographic information of the respondent
population is as shown in Table 1. The maximum proportion of respondent population
belonged to the age group 23-23 years (28%), with 70 % females. A large proportion of
student reported their level of study as bachelors (51%), followed by postgraduate
coursework (40%). The majority of respondent population was married (53%), followed by
those who were single (41%). Therefore, the respondent population allows for a balanced
observation of knowledge between married and single individuals. However, the population
is biased in terms of gender, as females compose major percentage of population.
Age
Percent
18-22 years 23.0
23-27 years 28.0
28-32 years 26.0
33-37 years 10.0
38-42 years 5.0
43-47 years 4.0
48 or above 4.0
Gender
Paraphrase This Document
Need a fresh take? Get an instant paraphrase of this document with our AI Paraphraser
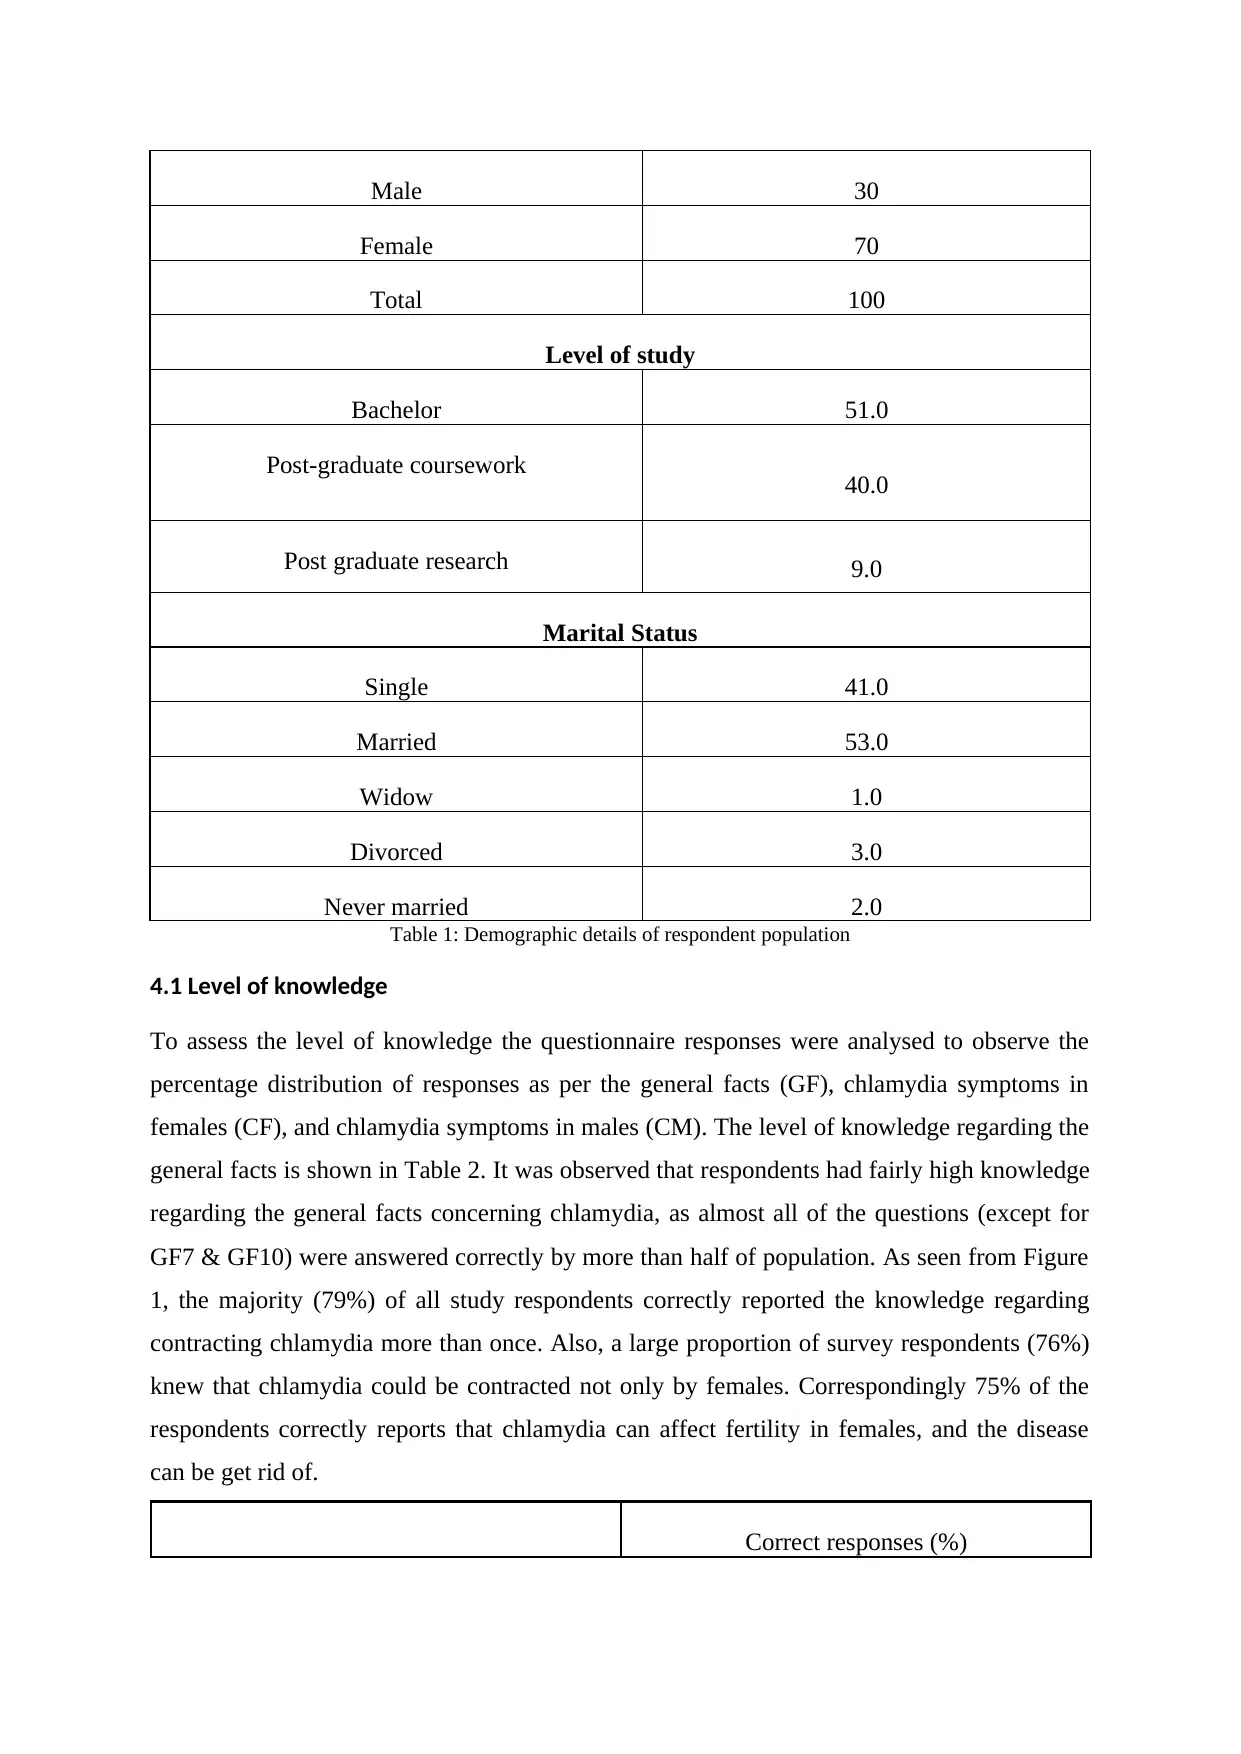
Male 30
Female 70
Total 100
Level of study
Bachelor 51.0
Post-graduate coursework 40.0
Post graduate research 9.0
Marital Status
Single 41.0
Married 53.0
Widow 1.0
Divorced 3.0
Never married 2.0
Table 1: Demographic details of respondent population
4.1 Level of knowledge
To assess the level of knowledge the questionnaire responses were analysed to observe the
percentage distribution of responses as per the general facts (GF), chlamydia symptoms in
females (CF), and chlamydia symptoms in males (CM). The level of knowledge regarding the
general facts is shown in Table 2. It was observed that respondents had fairly high knowledge
regarding the general facts concerning chlamydia, as almost all of the questions (except for
GF7 & GF10) were answered correctly by more than half of population. As seen from Figure
1, the majority (79%) of all study respondents correctly reported the knowledge regarding
contracting chlamydia more than once. Also, a large proportion of survey respondents (76%)
knew that chlamydia could be contracted not only by females. Correspondingly 75% of the
respondents correctly reports that chlamydia can affect fertility in females, and the disease
can be get rid of.
Correct responses (%)
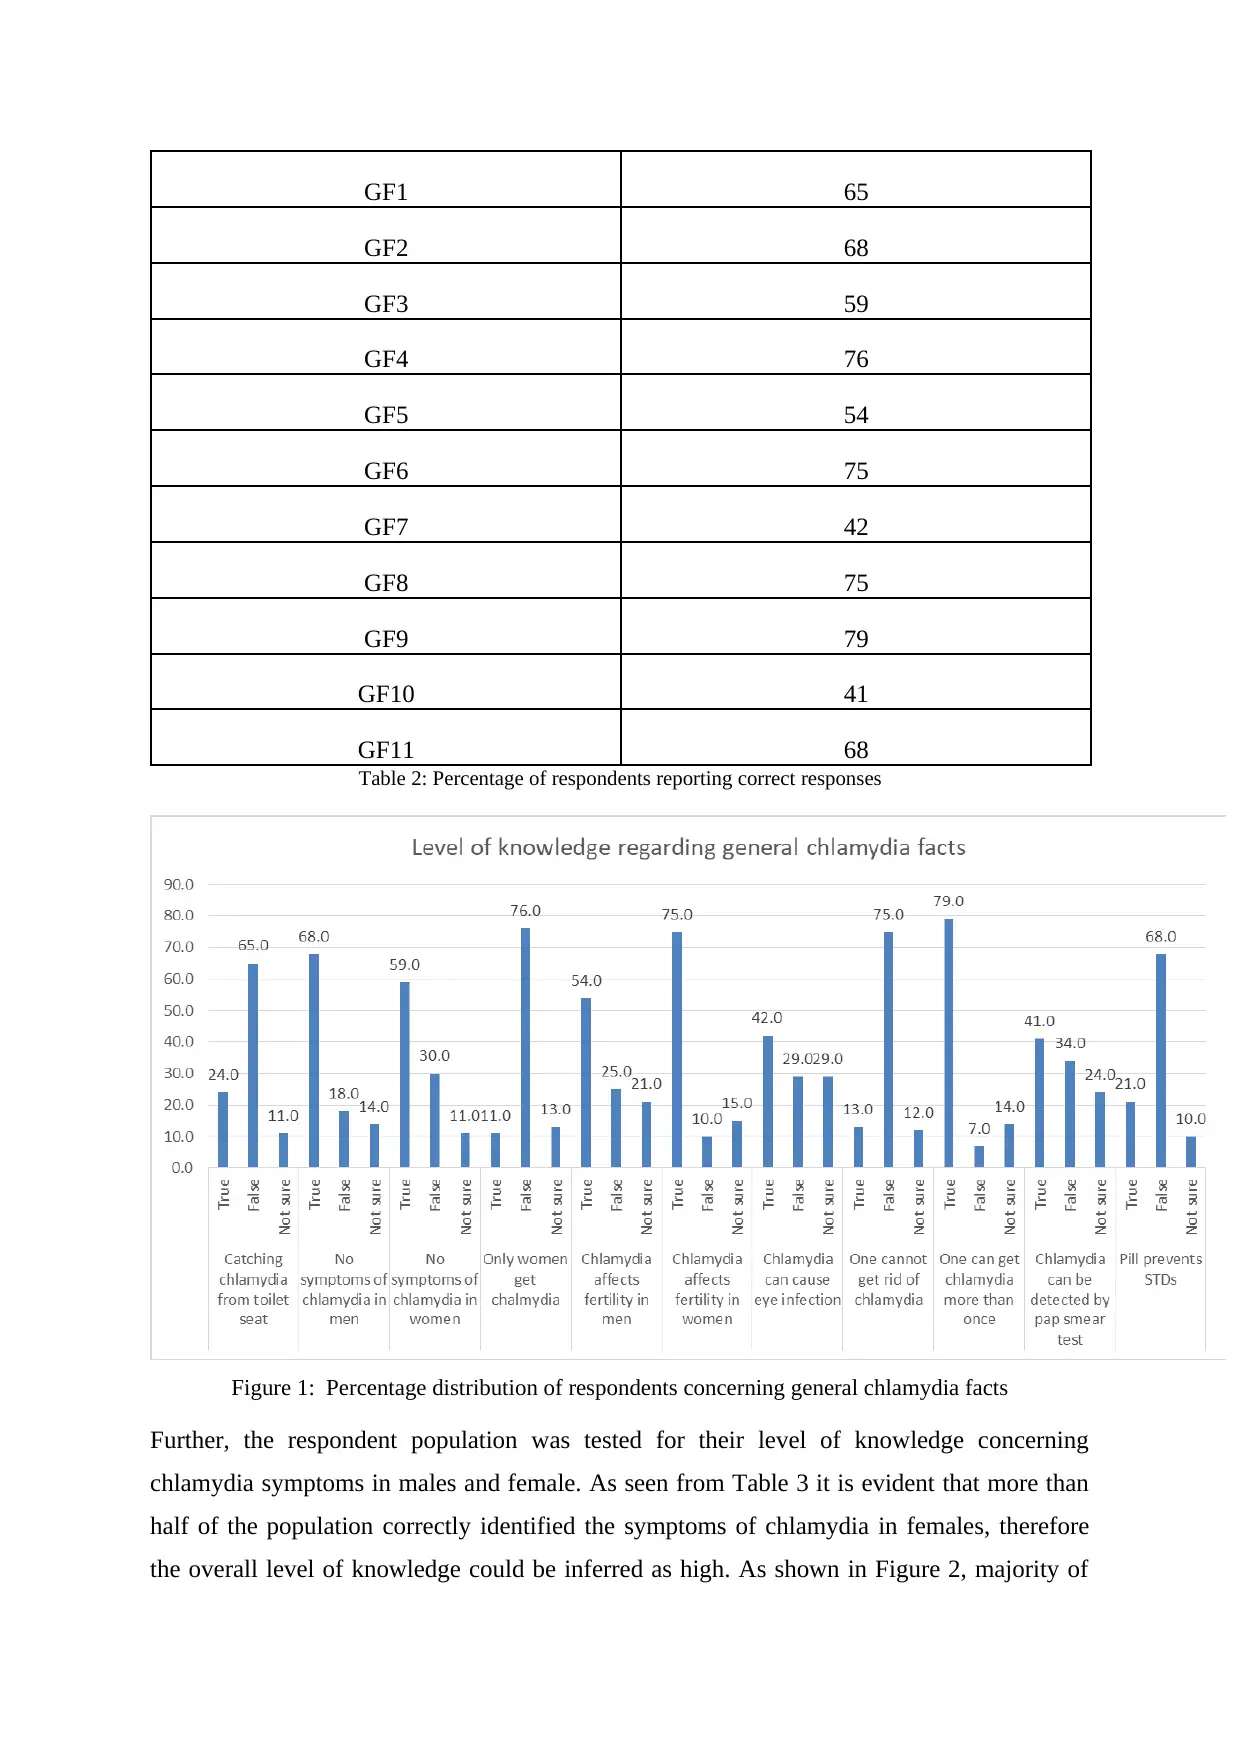
GF1 65
GF2 68
GF3 59
GF4 76
GF5 54
GF6 75
GF7 42
GF8 75
GF9 79
GF10 41
GF11 68
Table 2: Percentage of respondents reporting correct responses
Figure 1: Percentage distribution of respondents concerning general chlamydia facts
Further, the respondent population was tested for their level of knowledge concerning
chlamydia symptoms in males and female. As seen from Table 3 it is evident that more than
half of the population correctly identified the symptoms of chlamydia in females, therefore
the overall level of knowledge could be inferred as high. As shown in Figure 2, majority of
⊘ This is a preview!⊘
Do you want full access?
Subscribe today to unlock all pages.
Trusted by 1+ million students worldwide
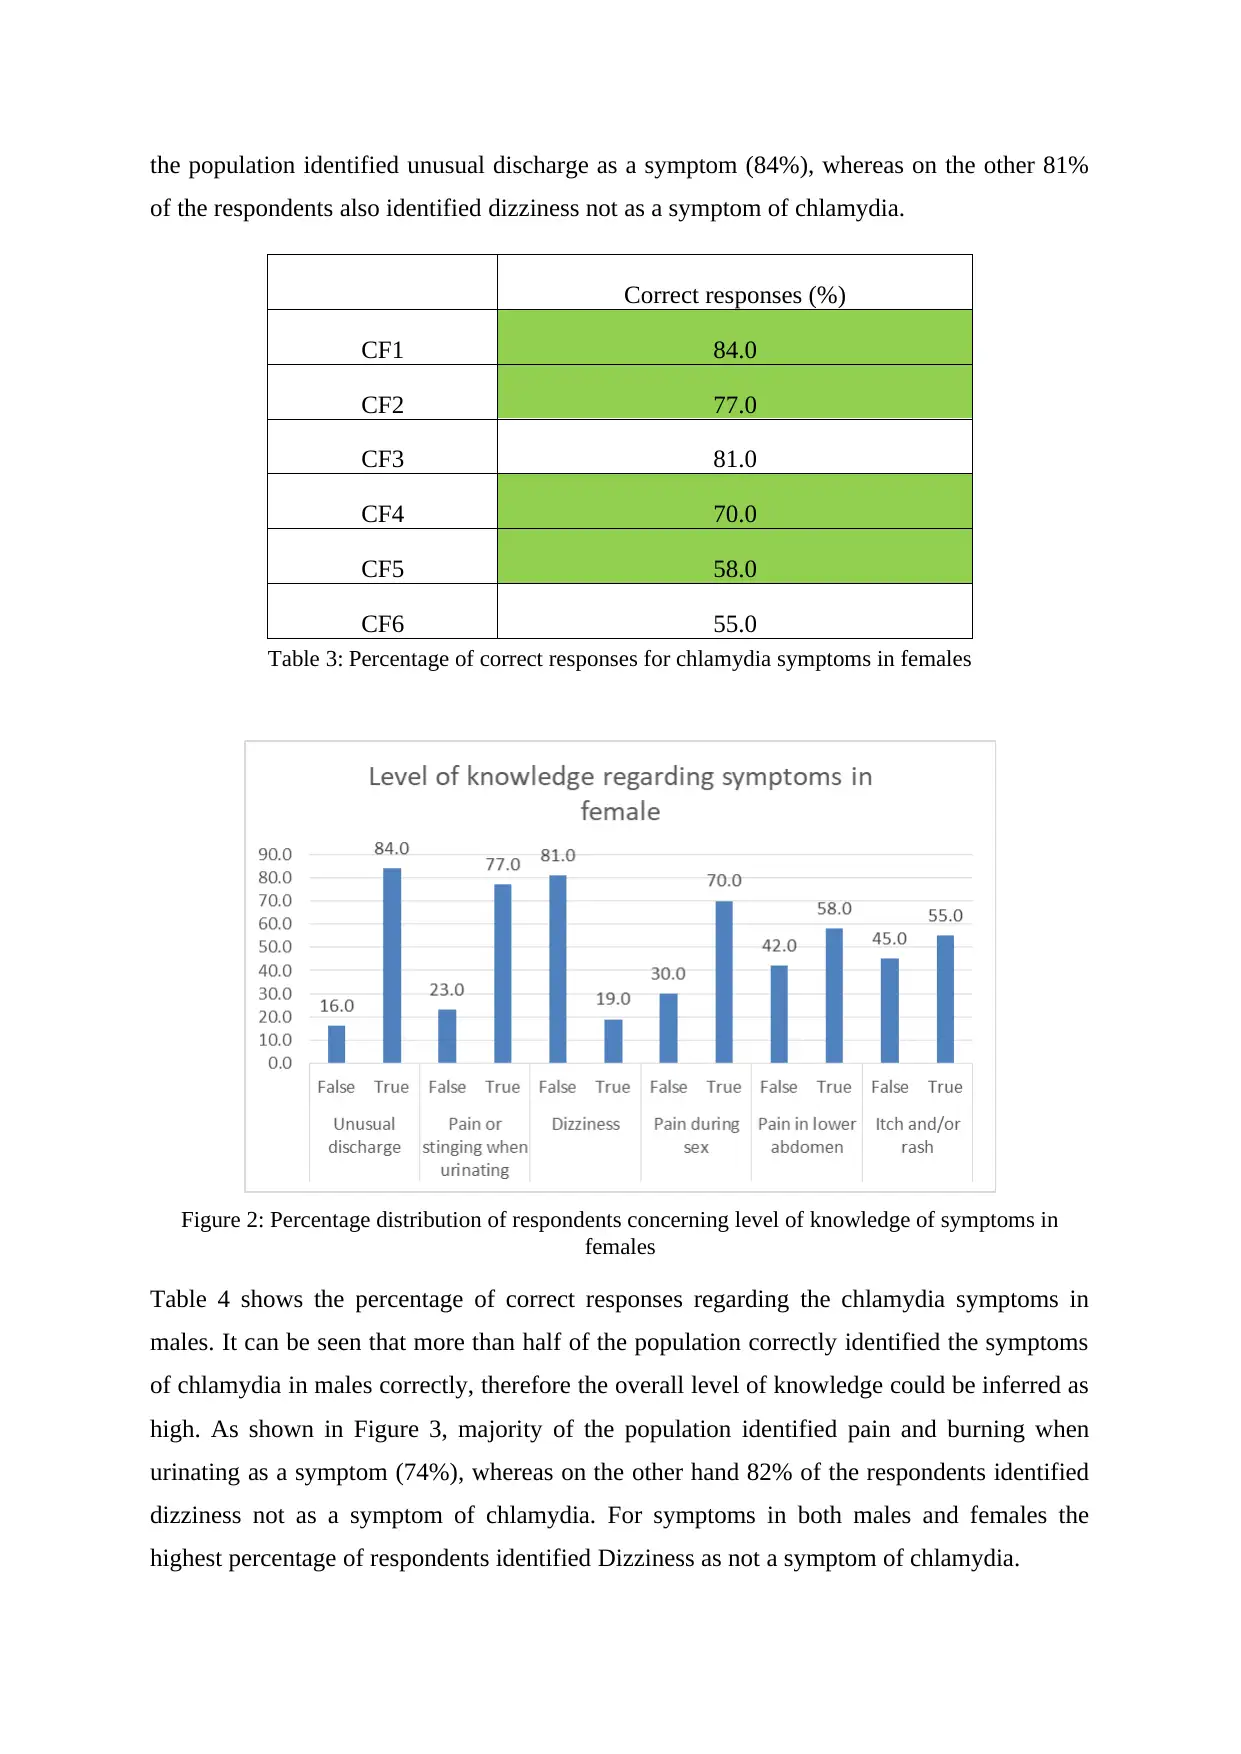
the population identified unusual discharge as a symptom (84%), whereas on the other 81%
of the respondents also identified dizziness not as a symptom of chlamydia.
Table 3: Percentage of correct responses for chlamydia symptoms in females
Figure 2: Percentage distribution of respondents concerning level of knowledge of symptoms in
females
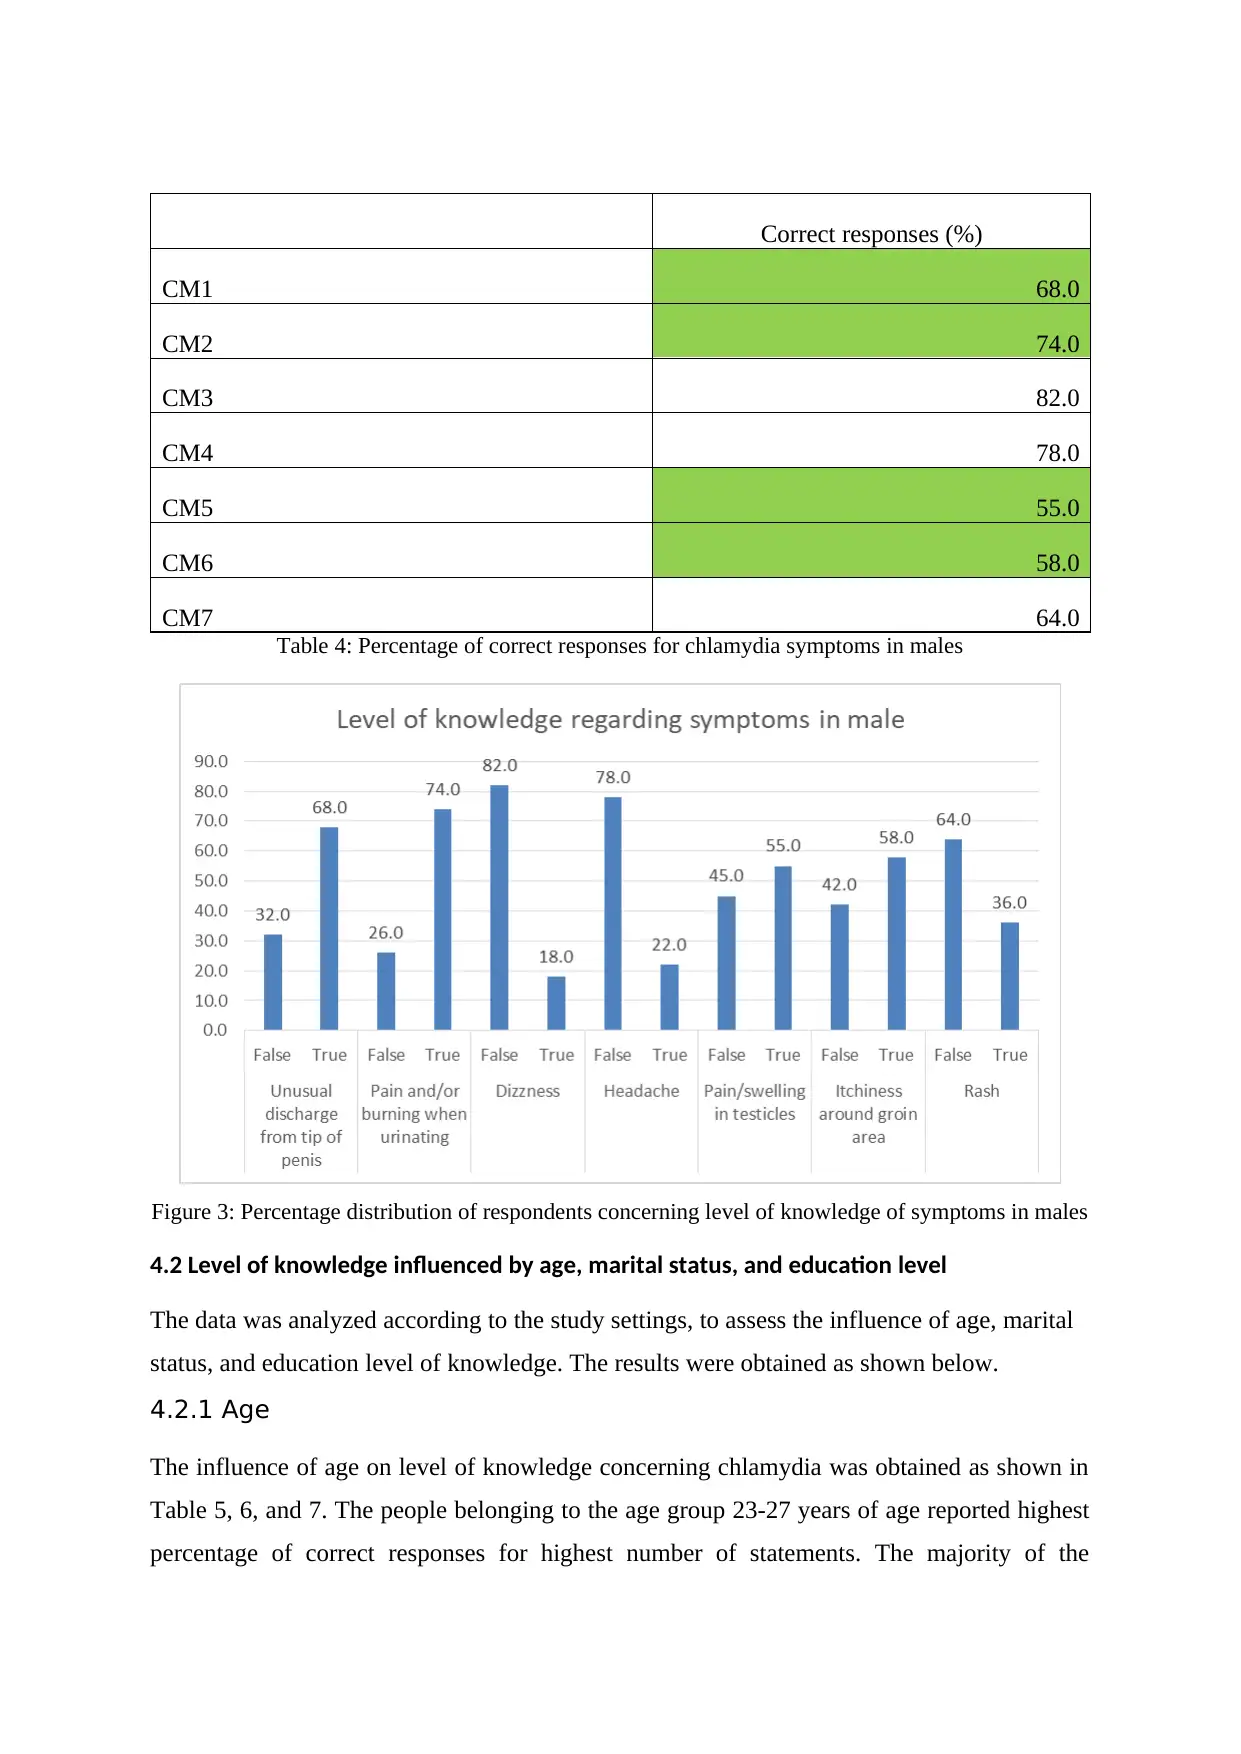
Table 4 shows the percentage of correct responses regarding the chlamydia symptoms in
males. It can be seen that more than half of the population correctly identified the symptoms
of chlamydia in males correctly, therefore the overall level of knowledge could be inferred as
high. As shown in Figure 3, majority of the population identified pain and burning when
urinating as a symptom (74%), whereas on the other hand 82% of the respondents identified
dizziness not as a symptom of chlamydia. For symptoms in both males and females the
highest percentage of respondents identified Dizziness as not a symptom of chlamydia.
Correct responses (%)
CF1 84.0
CF2 77.0
CF3 81.0
CF4 70.0
CF5 58.0
CF6 55.0
of the respondents also identified dizziness not as a symptom of chlamydia.
Table 3: Percentage of correct responses for chlamydia symptoms in females
Figure 2: Percentage distribution of respondents concerning level of knowledge of symptoms in
females
Table 4 shows the percentage of correct responses regarding the chlamydia symptoms in
males. It can be seen that more than half of the population correctly identified the symptoms
of chlamydia in males correctly, therefore the overall level of knowledge could be inferred as
high. As shown in Figure 3, majority of the population identified pain and burning when
urinating as a symptom (74%), whereas on the other hand 82% of the respondents identified
dizziness not as a symptom of chlamydia. For symptoms in both males and females the
highest percentage of respondents identified Dizziness as not a symptom of chlamydia.
Correct responses (%)
CF1 84.0
CF2 77.0
CF3 81.0
CF4 70.0
CF5 58.0
CF6 55.0
Paraphrase This Document
Need a fresh take? Get an instant paraphrase of this document with our AI Paraphraser
Correct responses (%)
CM1 68.0
CM2 74.0
CM3 82.0
CM4 78.0
CM5 55.0
CM6 58.0
CM7 64.0
Table 4: Percentage of correct responses for chlamydia symptoms in males
Figure 3: Percentage distribution of respondents concerning level of knowledge of symptoms in males
4.2 Level of knowledge influenced by age, marital status, and education level
The data was analyzed according to the study settings, to assess the influence of age, marital
status, and education level of knowledge. The results were obtained as shown below.
4.2.1 Age
The influence of age on level of knowledge concerning chlamydia was obtained as shown in
Table 5, 6, and 7. The people belonging to the age group 23-27 years of age reported highest
percentage of correct responses for highest number of statements. The majority of the
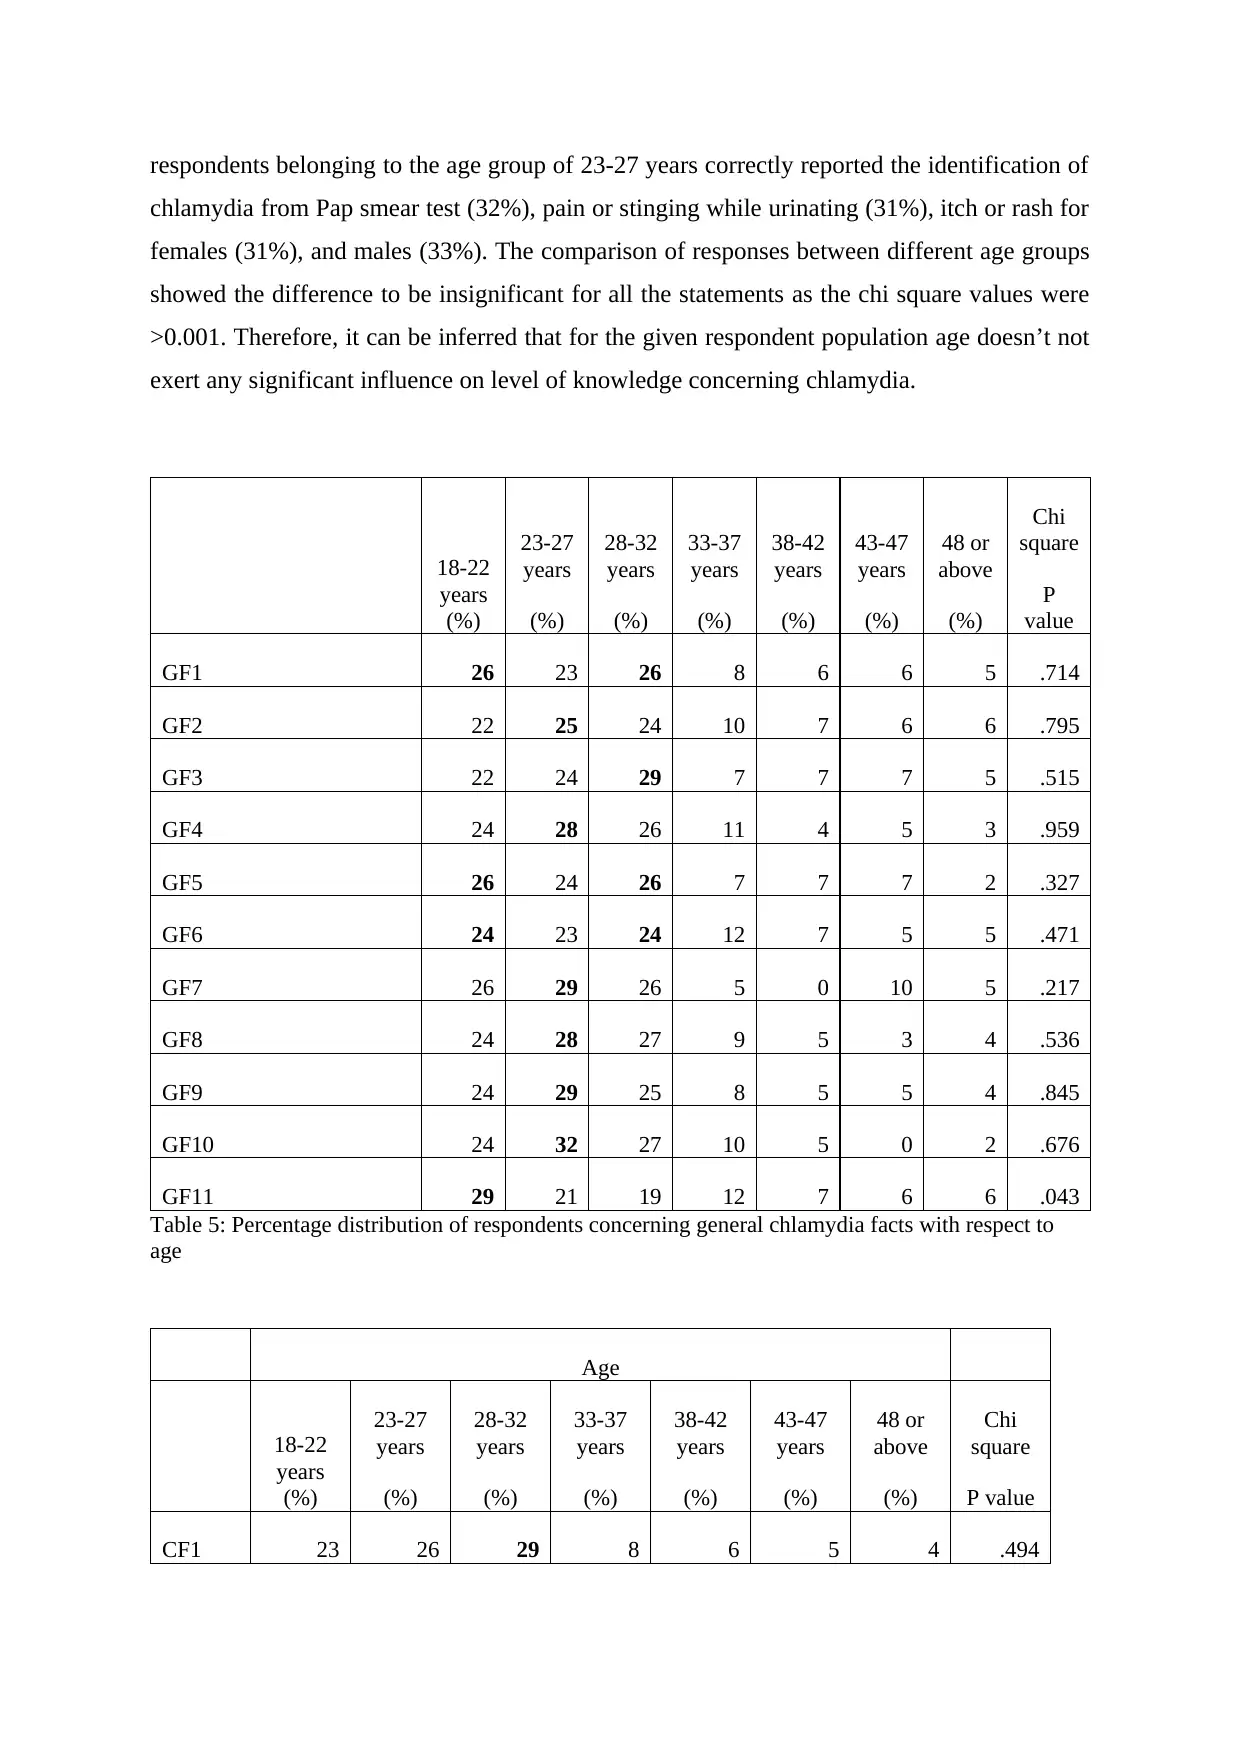
respondents belonging to the age group of 23-27 years correctly reported the identification of
chlamydia from Pap smear test (32%), pain or stinging while urinating (31%), itch or rash for
females (31%), and males (33%). The comparison of responses between different age groups
showed the difference to be insignificant for all the statements as the chi square values were
>0.001. Therefore, it can be inferred that for the given respondent population age doesn’t not
exert any significant influence on level of knowledge concerning chlamydia.
18-22
years
(%)
23-27
years
(%)
28-32
years
(%)
33-37
years
(%)
38-42
years
(%)
43-47
years
(%)
48 or
above
(%)
Chi
square
P
value
GF1 26 23 26 8 6 6 5 .714
GF2 22 25 24 10 7 6 6 .795
GF3 22 24 29 7 7 7 5 .515
GF4 24 28 26 11 4 5 3 .959
GF5 26 24 26 7 7 7 2 .327
GF6 24 23 24 12 7 5 5 .471
GF7 26 29 26 5 0 10 5 .217
GF8 24 28 27 9 5 3 4 .536
GF9 24 29 25 8 5 5 4 .845
GF10 24 32 27 10 5 0 2 .676
GF11 29 21 19 12 7 6 6 .043
Table 5: Percentage distribution of respondents concerning general chlamydia facts with respect to
age
Age
18-22
years
(%)
23-27
years
(%)
28-32
years
(%)
33-37
years
(%)
38-42
years
(%)
43-47
years
(%)
48 or
above
(%)
Chi
square
P value
CF1 23 26 29 8 6 5 4 .494
⊘ This is a preview!⊘
Do you want full access?
Subscribe today to unlock all pages.
Trusted by 1+ million students worldwide
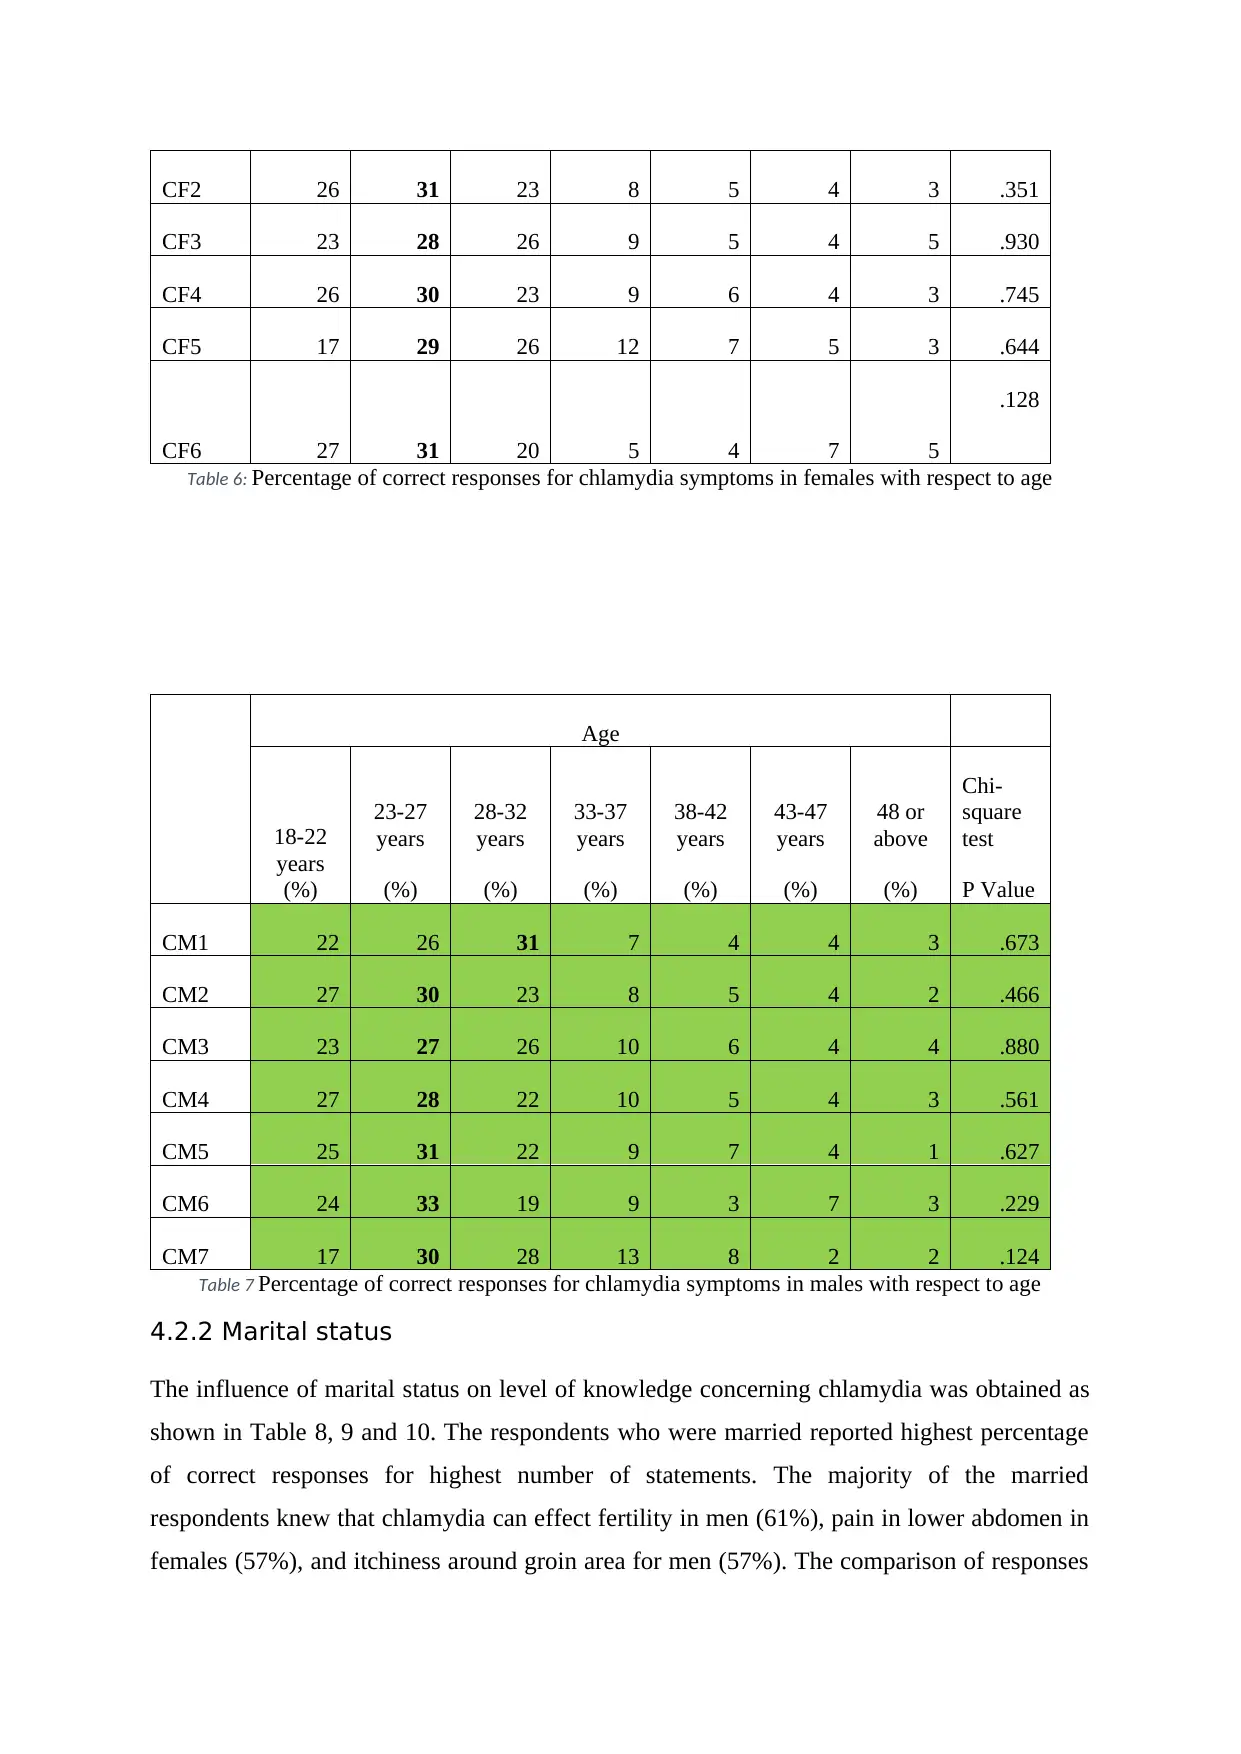
CF2 26 31 23 8 5 4 3 .351
CF3 23 28 26 9 5 4 5 .930
CF4 26 30 23 9 6 4 3 .745
CF5 17 29 26 12 7 5 3 .644
CF6 27 31 20 5 4 7 5
.128
Table 6: Percentage of correct responses for chlamydia symptoms in females with respect to age
Age
18-22
years
(%)
23-27
years
(%)
28-32
years
(%)
33-37
years
(%)
38-42
years
(%)
43-47
years
(%)
48 or
above
(%)
Chi-
square
test
P Value
CM1 22 26 31 7 4 4 3 .673
CM2 27 30 23 8 5 4 2 .466
CM3 23 27 26 10 6 4 4 .880
CM4 27 28 22 10 5 4 3 .561
CM5 25 31 22 9 7 4 1 .627
CM6 24 33 19 9 3 7 3 .229
CM7 17 30 28 13 8 2 2 .124
Table 7 Percentage of correct responses for chlamydia symptoms in males with respect to age
4.2.2 Marital status
The influence of marital status on level of knowledge concerning chlamydia was obtained as
shown in Table 8, 9 and 10. The respondents who were married reported highest percentage
of correct responses for highest number of statements. The majority of the married
respondents knew that chlamydia can effect fertility in men (61%), pain in lower abdomen in
females (57%), and itchiness around groin area for men (57%). The comparison of responses
Paraphrase This Document
Need a fresh take? Get an instant paraphrase of this document with our AI Paraphraser
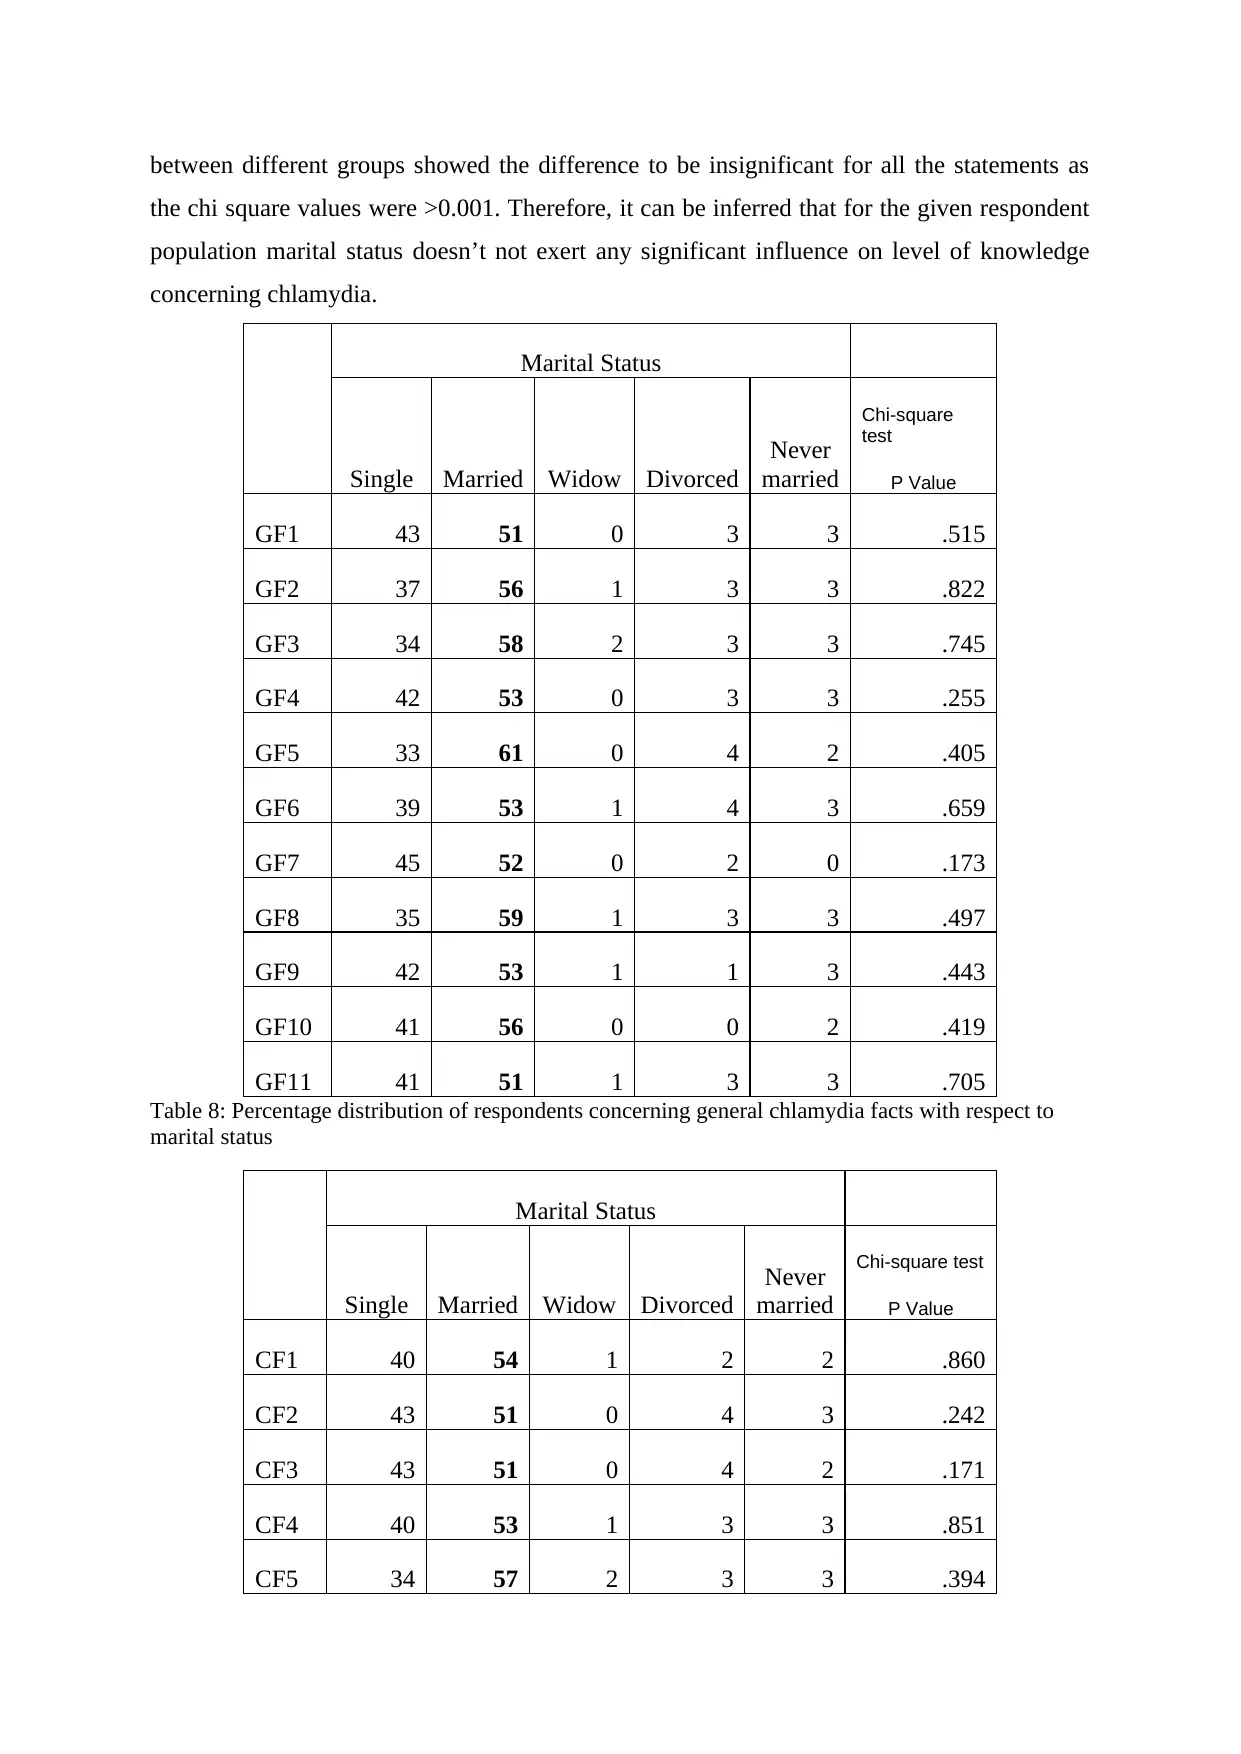
between different groups showed the difference to be insignificant for all the statements as
the chi square values were >0.001. Therefore, it can be inferred that for the given respondent
population marital status doesn’t not exert any significant influence on level of knowledge
concerning chlamydia.
Marital Status
Single Married Widow Divorced
Never
married
Chi-square
test
P Value
GF1 43 51 0 3 3 .515
GF2 37 56 1 3 3 .822
GF3 34 58 2 3 3 .745
GF4 42 53 0 3 3 .255
GF5 33 61 0 4 2 .405
GF6 39 53 1 4 3 .659
GF7 45 52 0 2 0 .173
GF8 35 59 1 3 3 .497
GF9 42 53 1 1 3 .443
GF10 41 56 0 0 2 .419
GF11 41 51 1 3 3 .705
Table 8: Percentage distribution of respondents concerning general chlamydia facts with respect to
marital status
Marital Status
Single Married Widow Divorced
Never
married
Chi-square test
P Value
CF1 40 54 1 2 2 .860
CF2 43 51 0 4 3 .242
CF3 43 51 0 4 2 .171
CF4 40 53 1 3 3 .851
CF5 34 57 2 3 3 .394
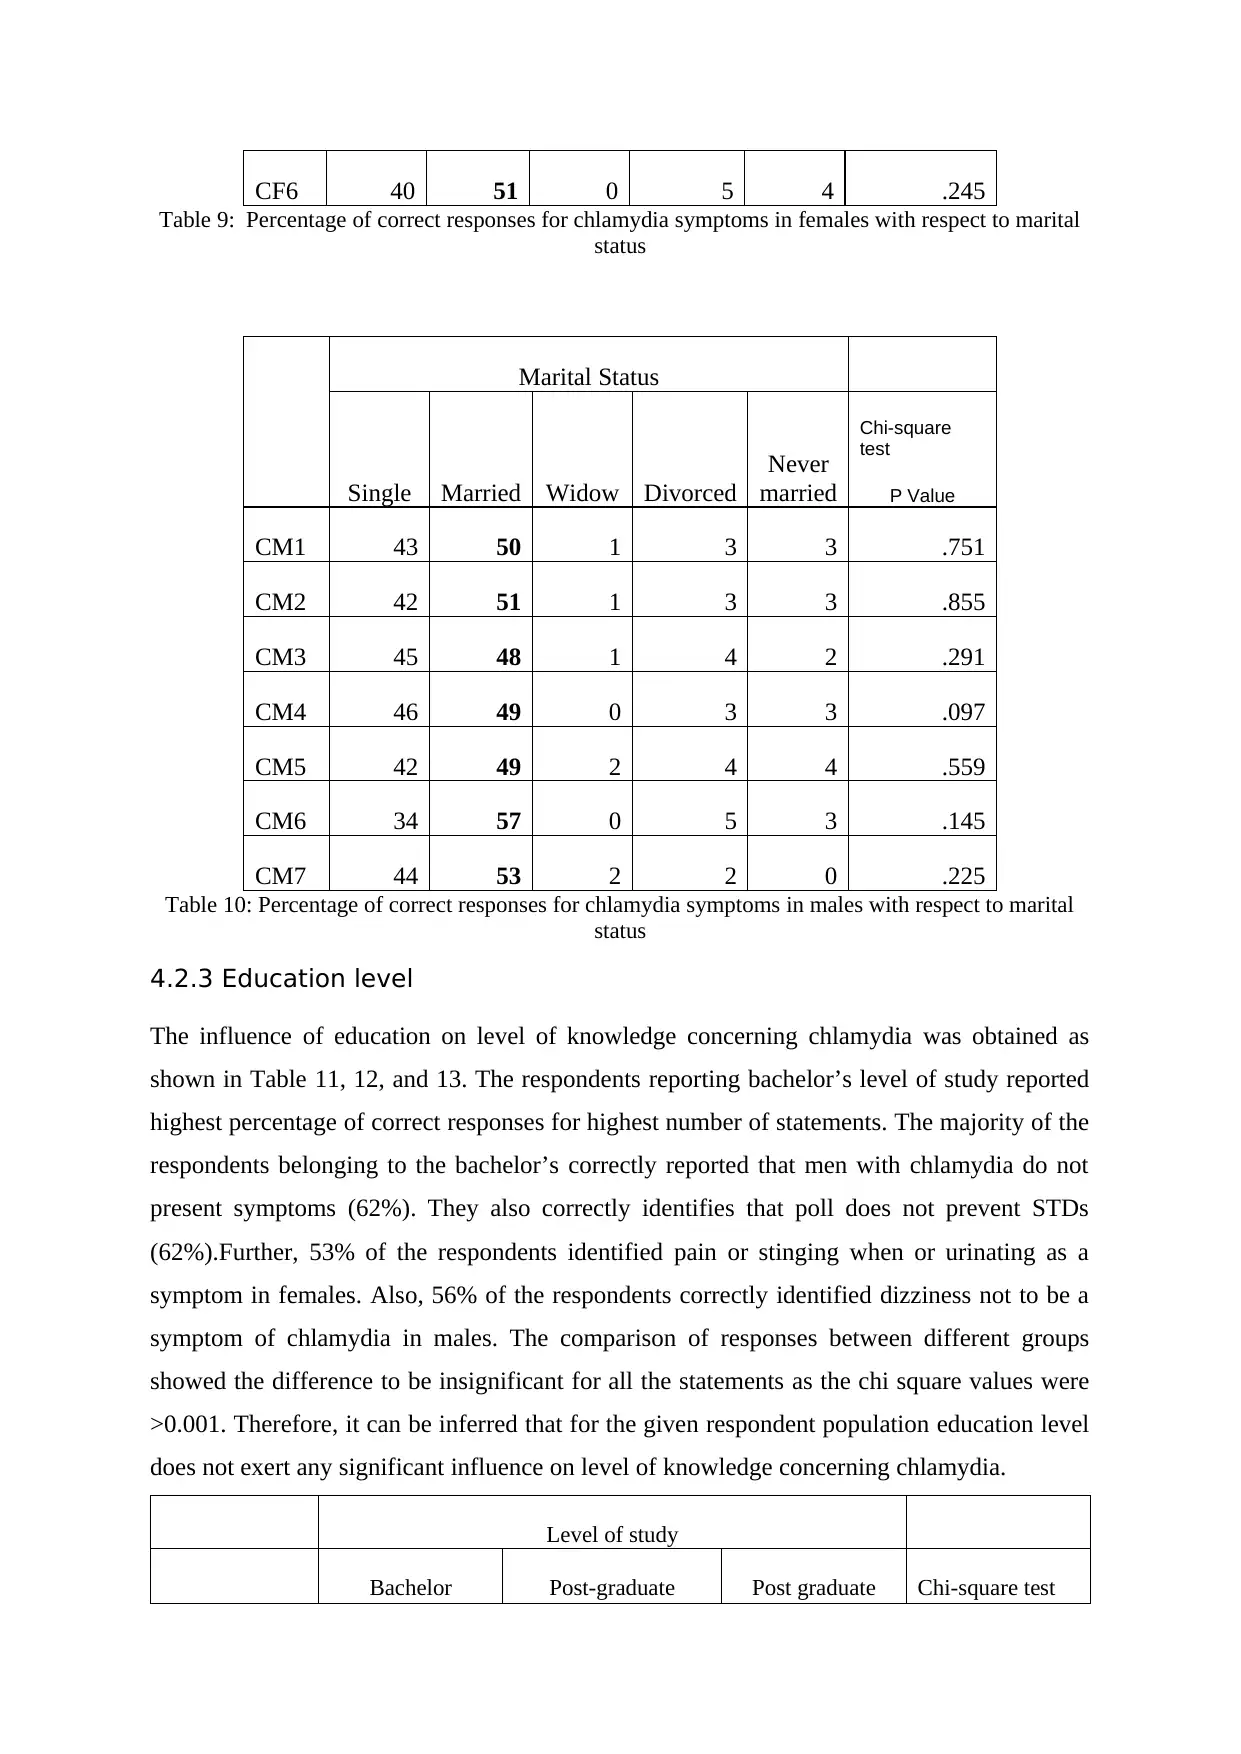
CF6 40 51 0 5 4 .245
Table 9: Percentage of correct responses for chlamydia symptoms in females with respect to marital
status
Marital Status
Single Married Widow Divorced
Never
married
Chi-square
test
P Value
CM1 43 50 1 3 3 .751
CM2 42 51 1 3 3 .855
CM3 45 48 1 4 2 .291
CM4 46 49 0 3 3 .097
CM5 42 49 2 4 4 .559
CM6 34 57 0 5 3 .145
CM7 44 53 2 2 0 .225
Table 10: Percentage of correct responses for chlamydia symptoms in males with respect to marital
status
4.2.3 Education level
The influence of education on level of knowledge concerning chlamydia was obtained as
shown in Table 11, 12, and 13. The respondents reporting bachelor’s level of study reported
highest percentage of correct responses for highest number of statements. The majority of the
respondents belonging to the bachelor’s correctly reported that men with chlamydia do not
present symptoms (62%). They also correctly identifies that poll does not prevent STDs
(62%).Further, 53% of the respondents identified pain or stinging when or urinating as a
symptom in females. Also, 56% of the respondents correctly identified dizziness not to be a
symptom of chlamydia in males. The comparison of responses between different groups
showed the difference to be insignificant for all the statements as the chi square values were
>0.001. Therefore, it can be inferred that for the given respondent population education level
does not exert any significant influence on level of knowledge concerning chlamydia.
Level of study
Bachelor Post-graduate Post graduate Chi-square test
⊘ This is a preview!⊘
Do you want full access?
Subscribe today to unlock all pages.
Trusted by 1+ million students worldwide
coursework research P Value
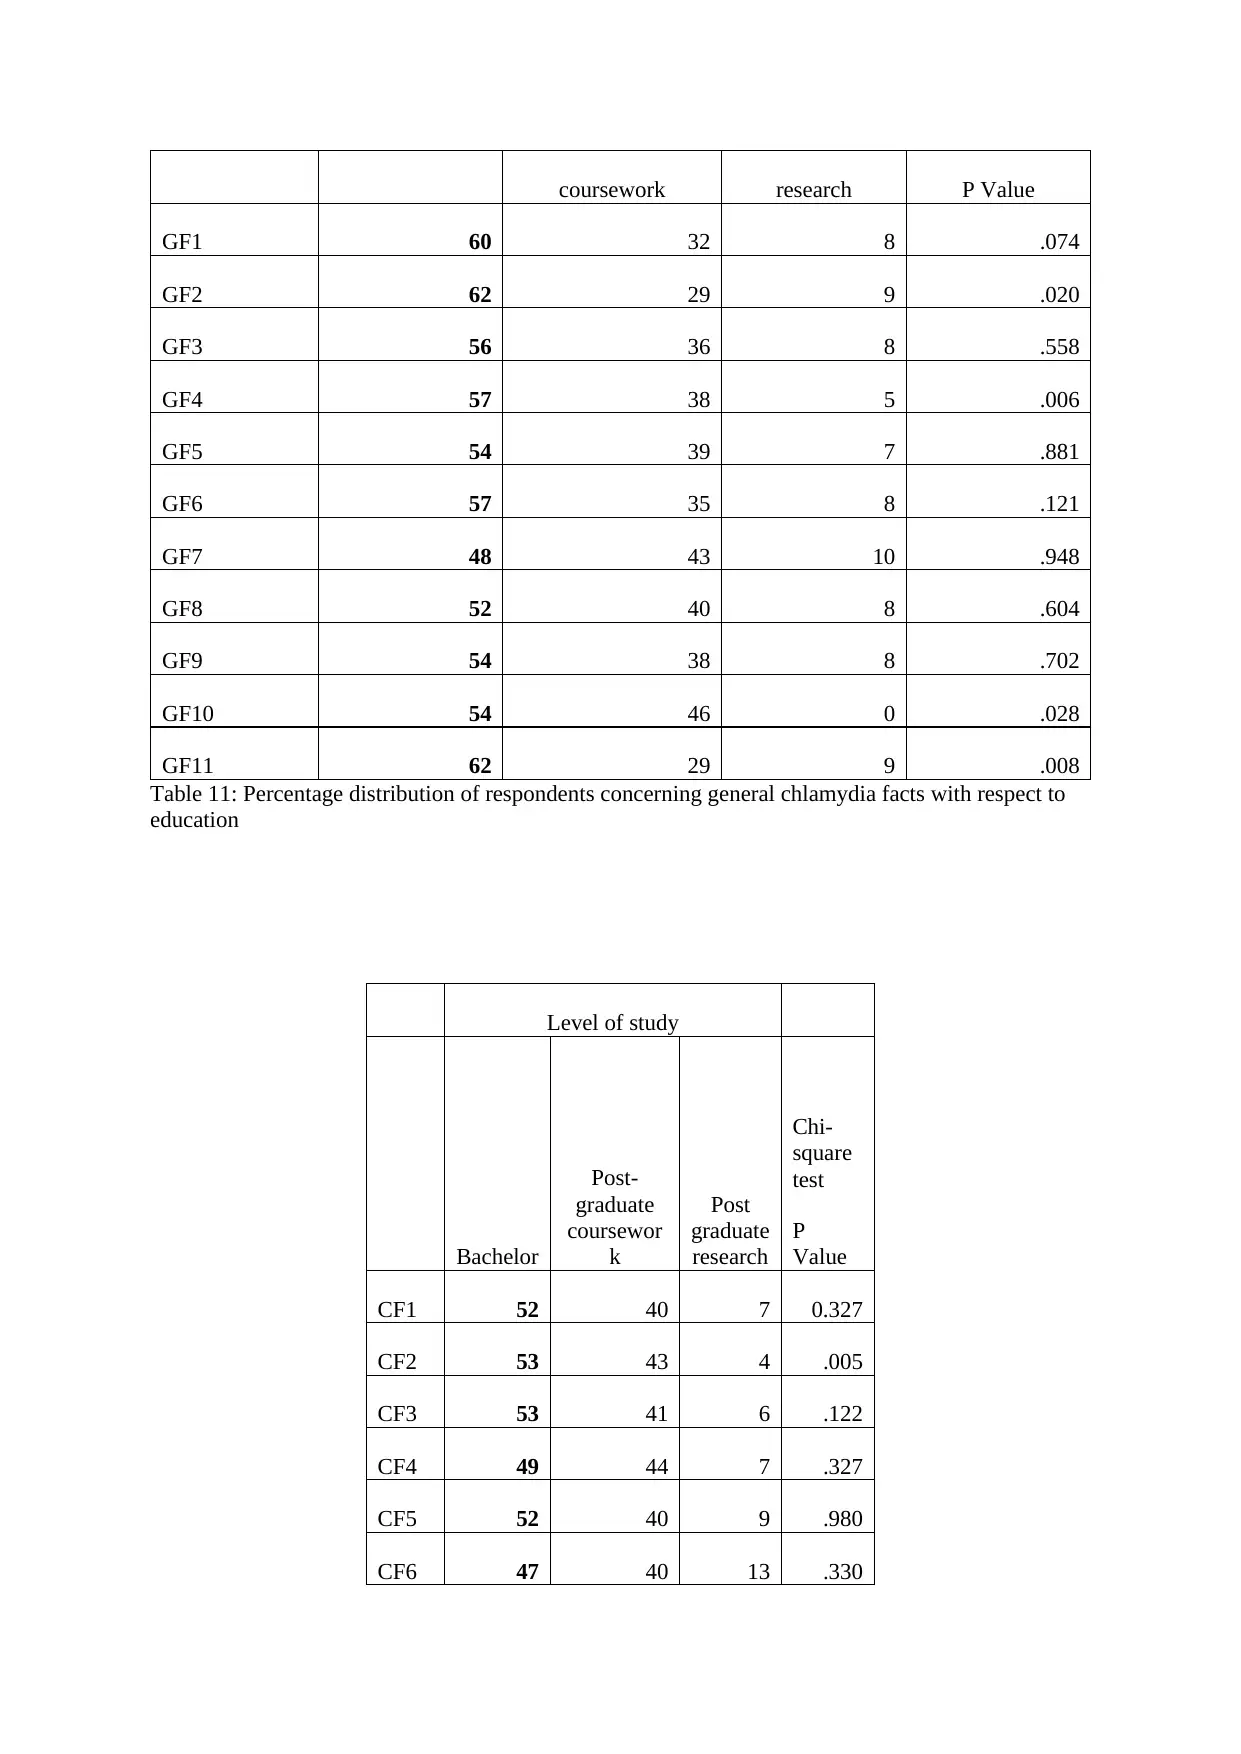
GF1 60 32 8 .074
GF2 62 29 9 .020
GF3 56 36 8 .558
GF4 57 38 5 .006
GF5 54 39 7 .881
GF6 57 35 8 .121
GF7 48 43 10 .948
GF8 52 40 8 .604
GF9 54 38 8 .702
GF10 54 46 0 .028
GF11 62 29 9 .008
Table 11: Percentage distribution of respondents concerning general chlamydia facts with respect to
education
Level of study
Bachelor
Post-
graduate
coursewor
k
Post
graduate
research
Chi-
square
test
P
Value
CF1 52 40 7 0.327
CF2 53 43 4 .005
CF3 53 41 6 .122
CF4 49 44 7 .327
CF5 52 40 9 .980
CF6 47 40 13 .330
Paraphrase This Document
Need a fresh take? Get an instant paraphrase of this document with our AI Paraphraser
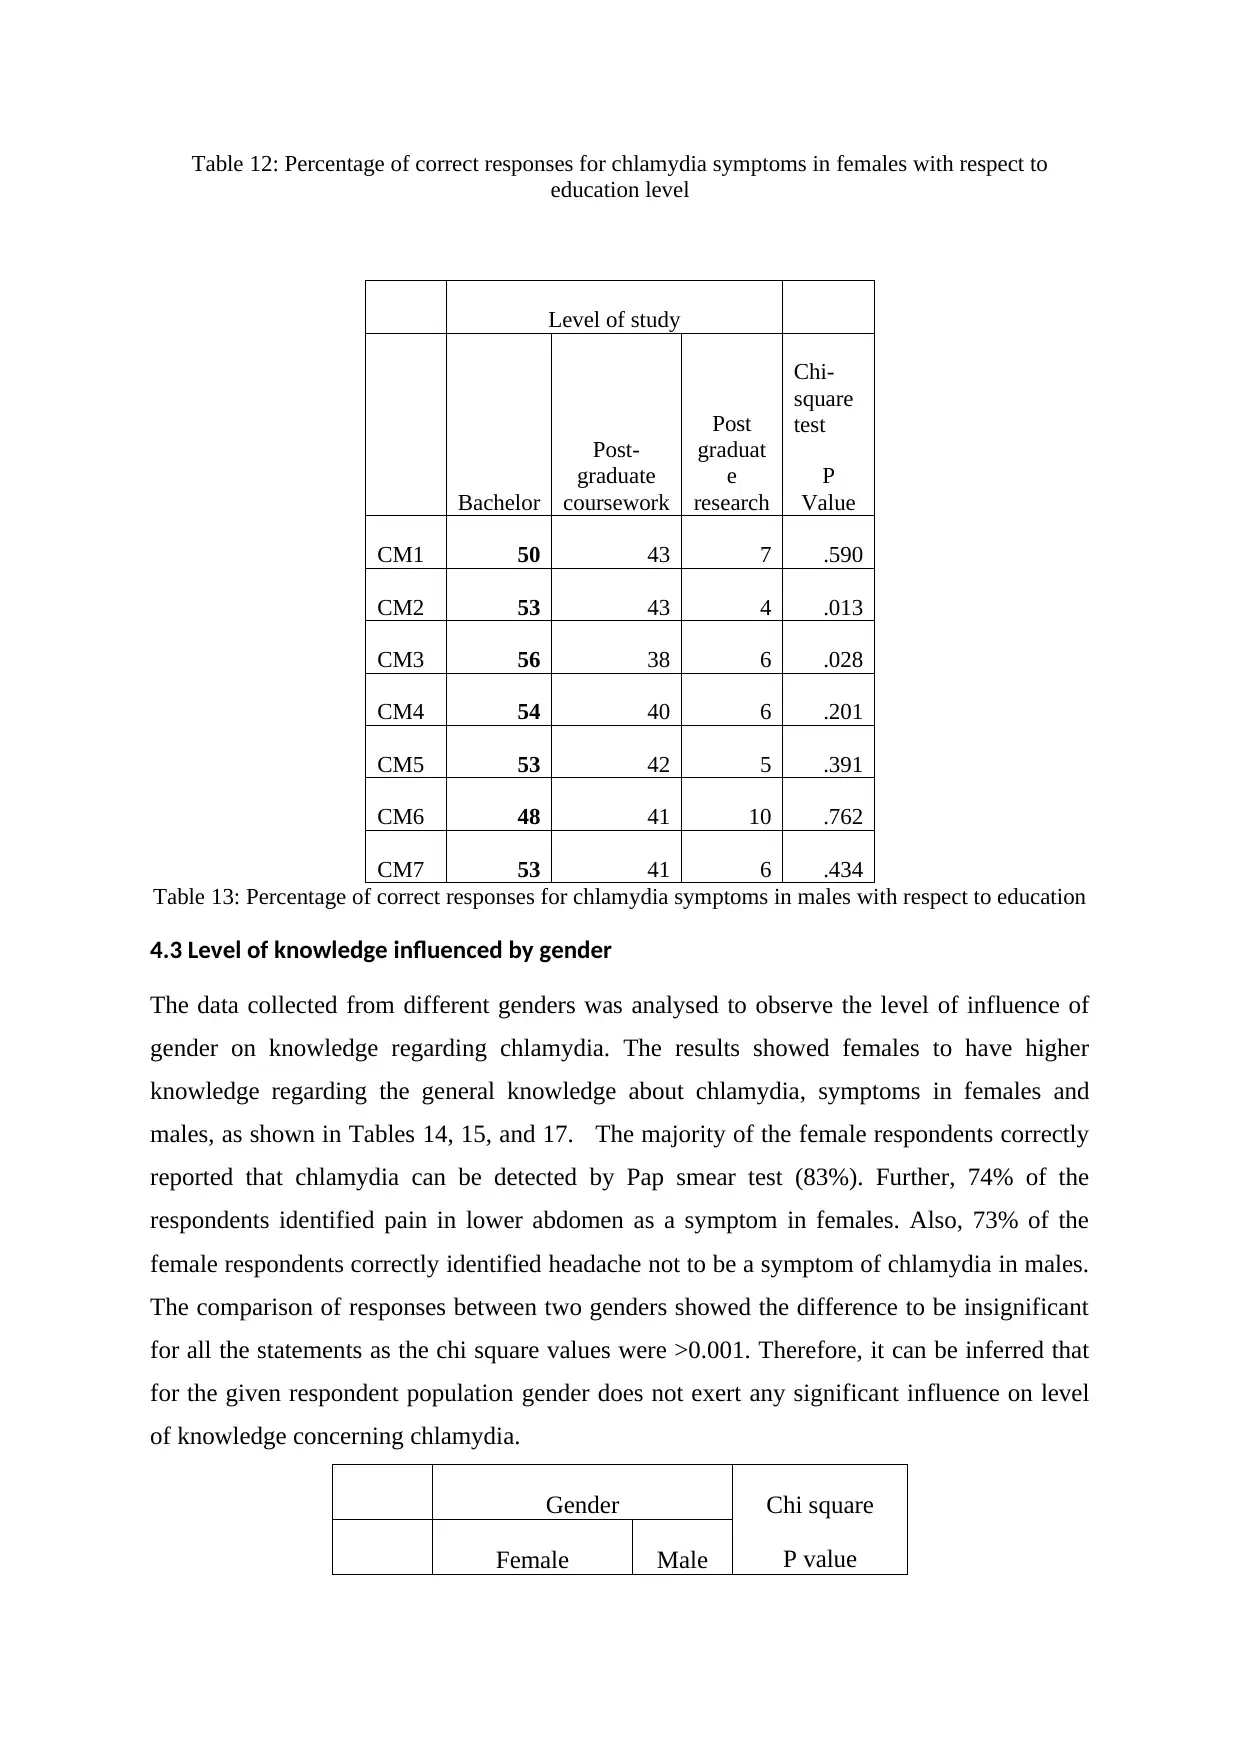
Table 12: Percentage of correct responses for chlamydia symptoms in females with respect to
education level
Level of study
Bachelor
Post-
graduate
coursework
Post
graduat
e
research
Chi-
square
test
P
Value
CM1 50 43 7 .590
CM2 53 43 4 .013
CM3 56 38 6 .028
CM4 54 40 6 .201
CM5 53 42 5 .391
CM6 48 41 10 .762
CM7 53 41 6 .434
Table 13: Percentage of correct responses for chlamydia symptoms in males with respect to education
4.3 Level of knowledge influenced by gender
The data collected from different genders was analysed to observe the level of influence of
gender on knowledge regarding chlamydia. The results showed females to have higher
knowledge regarding the general knowledge about chlamydia, symptoms in females and
males, as shown in Tables 14, 15, and 17. The majority of the female respondents correctly
reported that chlamydia can be detected by Pap smear test (83%). Further, 74% of the
respondents identified pain in lower abdomen as a symptom in females. Also, 73% of the
female respondents correctly identified headache not to be a symptom of chlamydia in males.
The comparison of responses between two genders showed the difference to be insignificant
for all the statements as the chi square values were >0.001. Therefore, it can be inferred that
for the given respondent population gender does not exert any significant influence on level
of knowledge concerning chlamydia.
Gender Chi square
P valueFemale Male
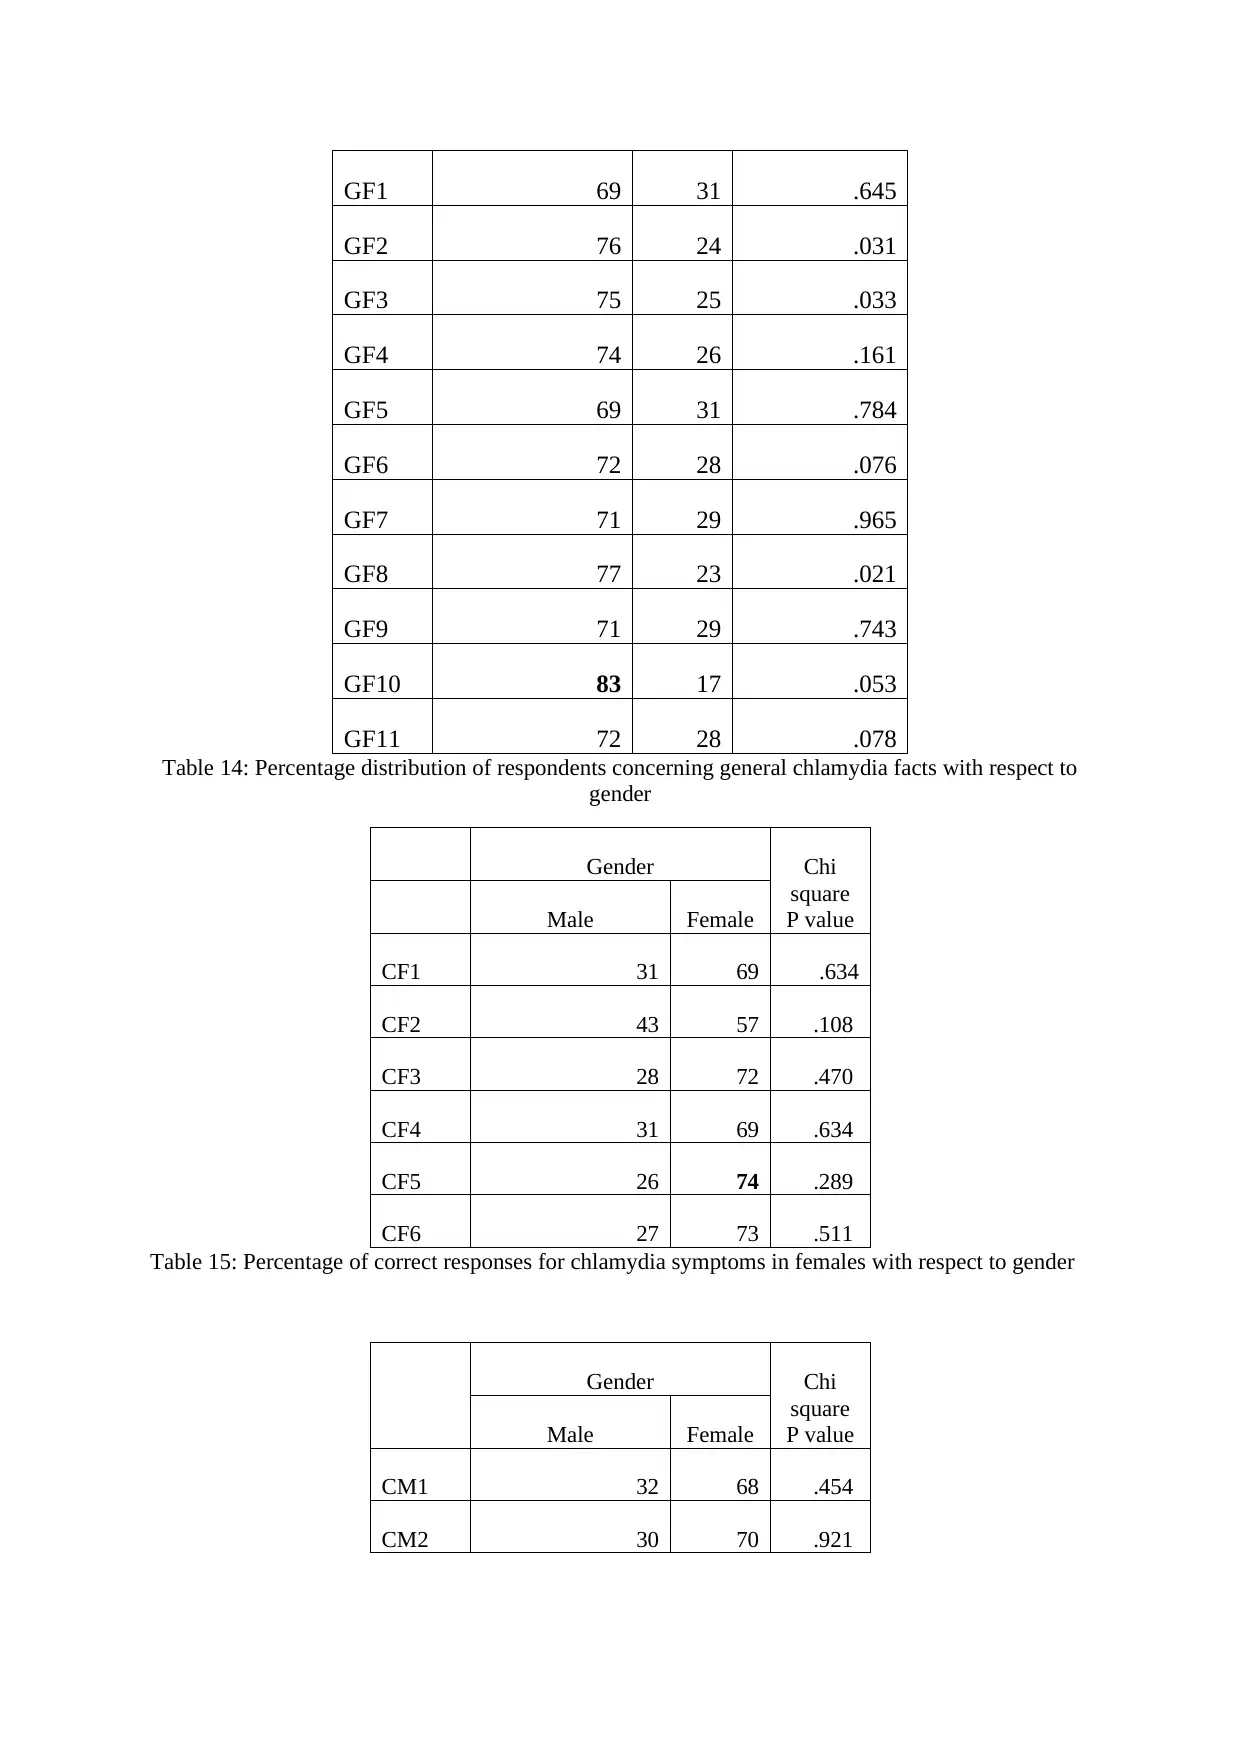
GF1 69 31 .645
GF2 76 24 .031
GF3 75 25 .033
GF4 74 26 .161
GF5 69 31 .784
GF6 72 28 .076
GF7 71 29 .965
GF8 77 23 .021
GF9 71 29 .743
GF10 83 17 .053
GF11 72 28 .078
Table 14: Percentage distribution of respondents concerning general chlamydia facts with respect to
gender
Gender Chi
square
P valueMale Female
CF1 31 69 .634
CF2 43 57 .108
CF3 28 72 .470
CF4 31 69 .634
CF5 26 74 .289
CF6 27 73 .511
Table 15: Percentage of correct responses for chlamydia symptoms in females with respect to gender
Gender Chi
square
P valueMale Female
CM1 32 68 .454
CM2 30 70 .921
⊘ This is a preview!⊘
Do you want full access?
Subscribe today to unlock all pages.
Trusted by 1+ million students worldwide
1 out of 17

Your All-in-One AI-Powered Toolkit for Academic Success.
+13062052269
info@desklib.com
Available 24*7 on WhatsApp / Email
![[object Object]](/_next/static/media/star-bottom.7253800d.svg)
Unlock your academic potential
Copyright © 2020–2026 A2Z Services. All Rights Reserved. Developed and managed by ZUCOL.