Chocco Plc's Financial Performance: Ratio Analysis and Review

Verified

Added on  2023/06/18

|7
|634
|193
Report
AI Summary
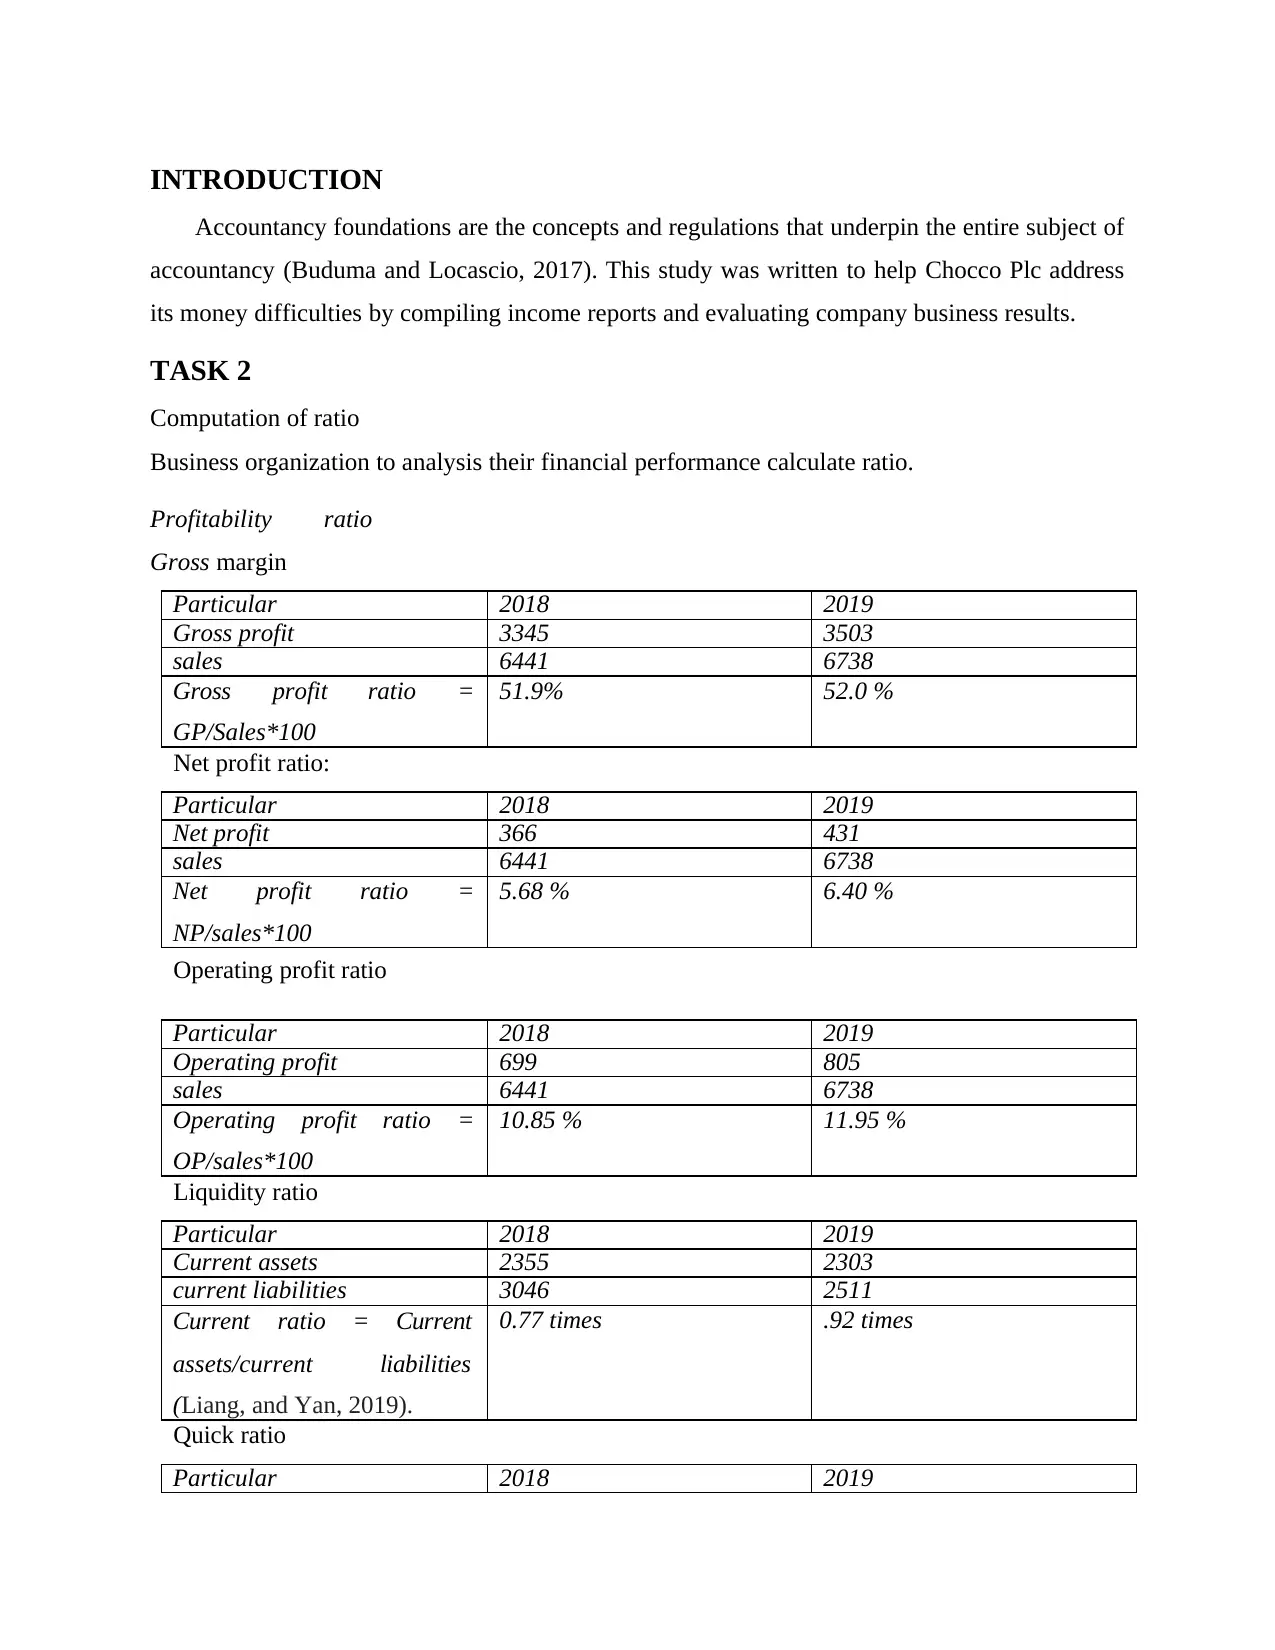
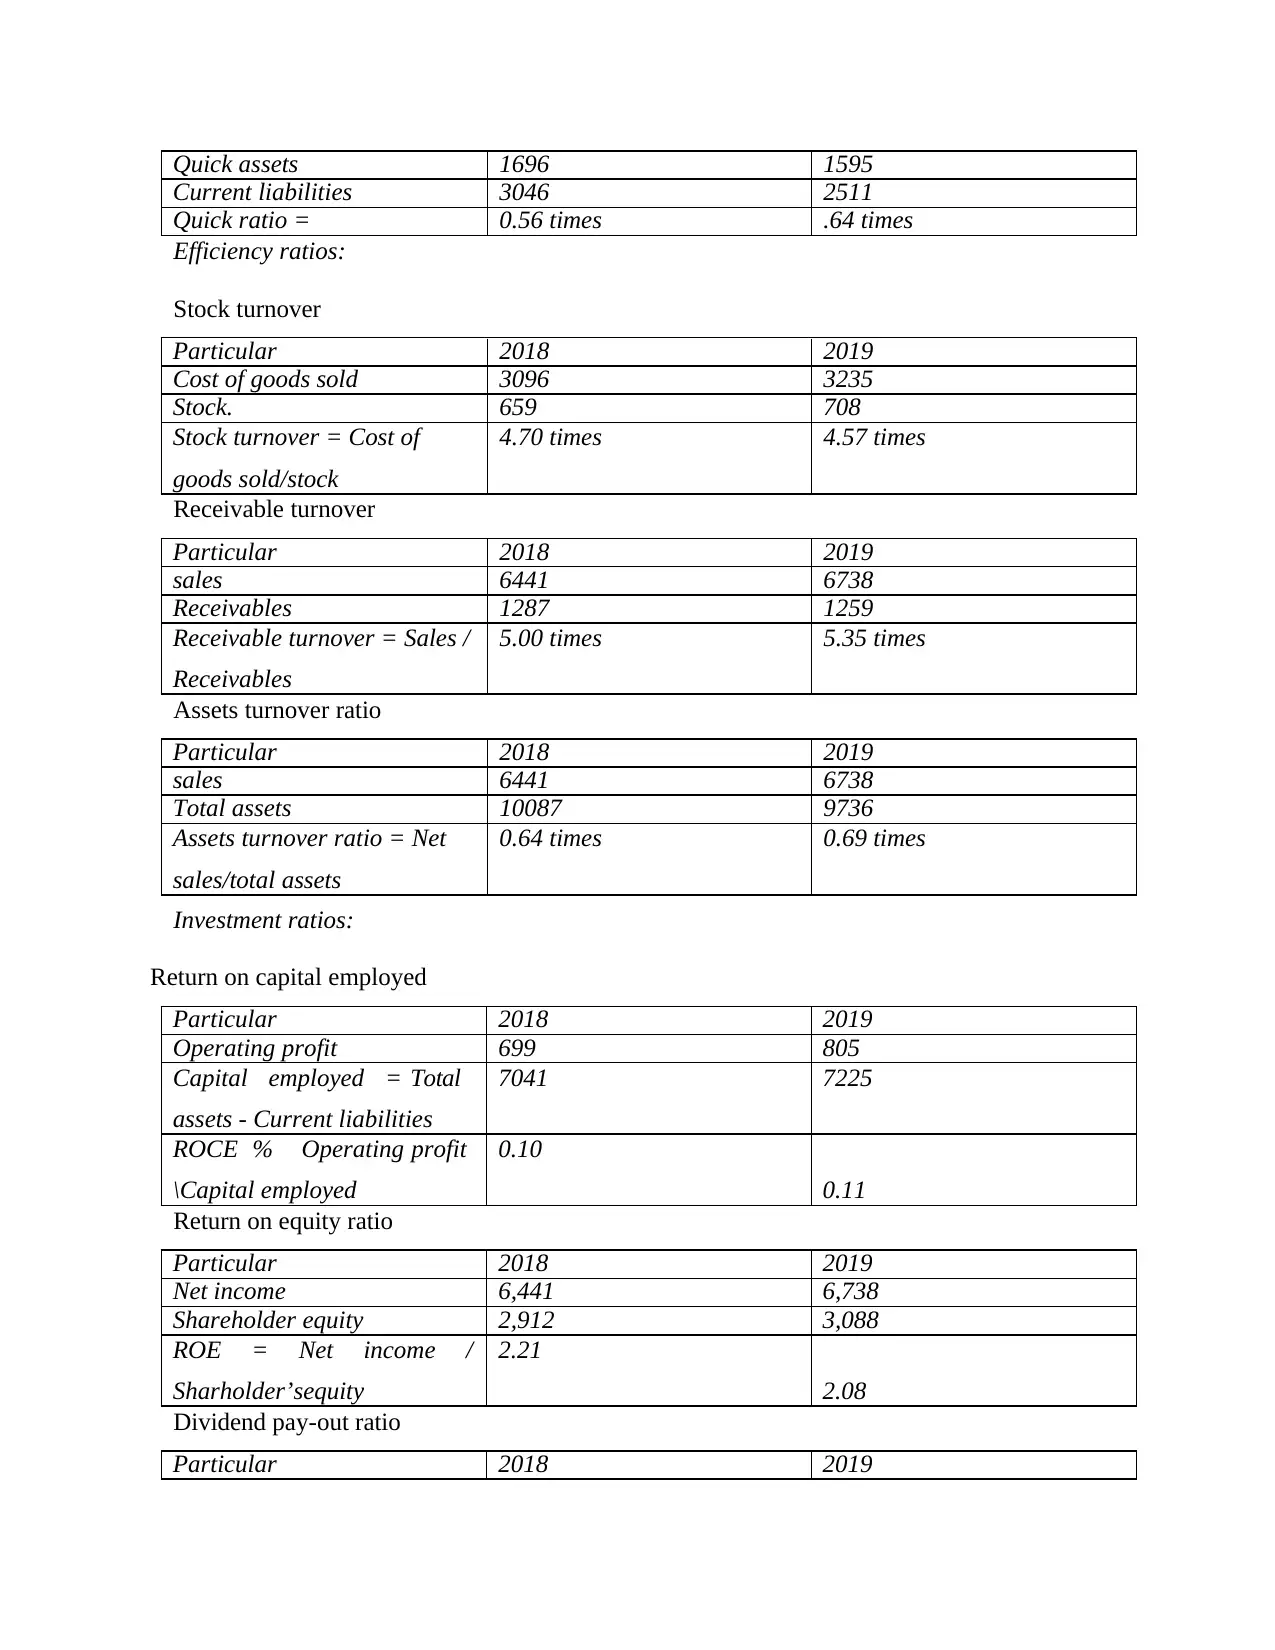
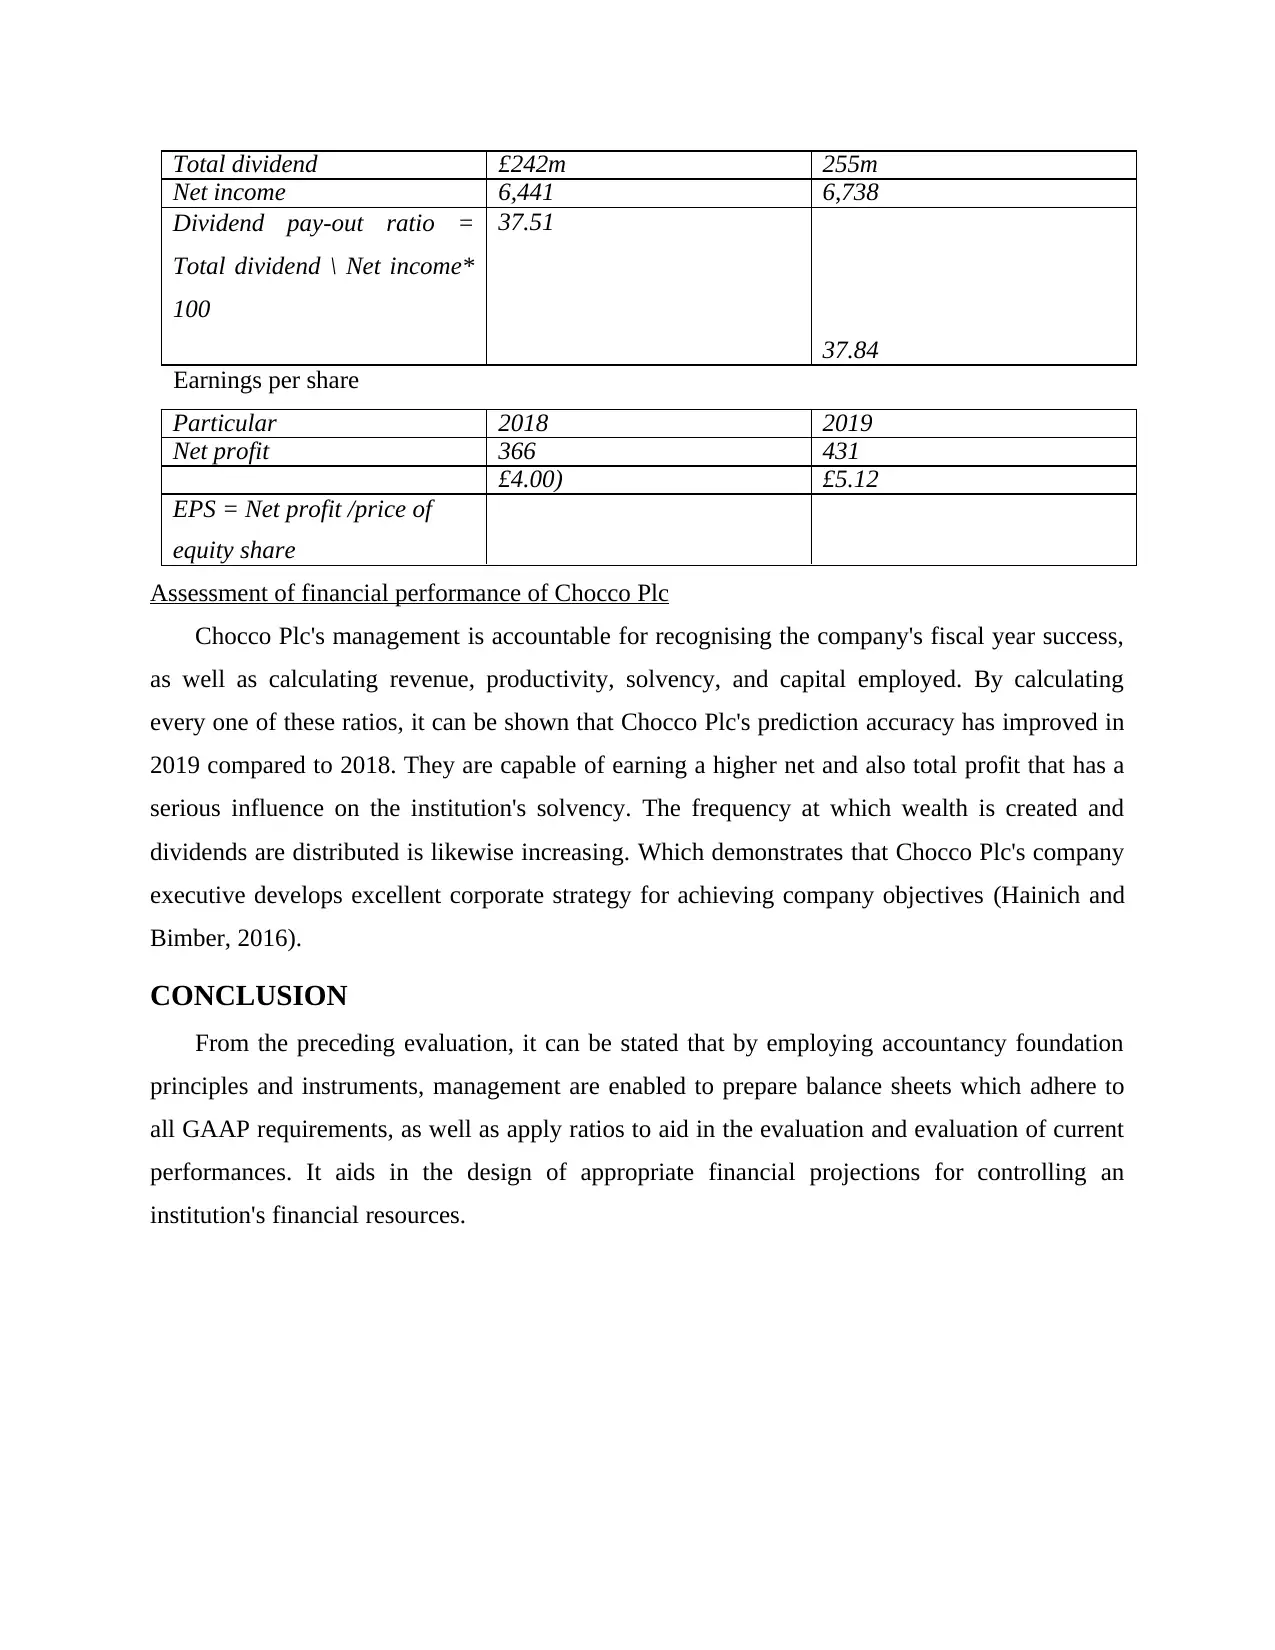
This report provides a financial performance assessment of Chocco Plc, utilizing key accountancy principles and tools. It includes a computation of various financial ratios such as profitability, liquidity, efficiency, and investment ratios to evaluate the company's financial health. The analysis compares the company's performance between 2018 and 2019, highlighting improvements in net profit, total profit, and dividend distribution. The report concludes that Chocco Plc's management has demonstrated effective corporate strategies in achieving company objectives and preparing balance sheets that adhere to GAAP requirements. This evaluation aids in designing appropriate financial projections for managing the institution's financial resources effectively. The report is available on Desklib, a platform providing study tools and resources for students.
Document Page
Fundamentals
tabler-icon-diamond-filled.svg

Paraphrase This Document

Need a fresh take? Get an instant paraphrase of this document with our AI Paraphraser
Document Page
Contents
Contents...........................................................................................................................................2
INTRODUCTION...........................................................................................................................1
TASK 2............................................................................................................................................1
Assessment of financial performance of Chocco Plc..................................................................3
CONCLUSION................................................................................................................................3
REFERENCES................................................................................................................................4
Document Page
Document Page
INTRODUCTION
Accountancy foundations are the concepts and regulations that underpin the entire subject of
accountancy (Buduma and Locascio, 2017). This study was written to help Chocco Plc address
its money difficulties by compiling income reports and evaluating company business results.
TASK 2
Computation of ratio
Business organization to analysis their financial performance calculate ratio.
Profitability ratio
Gross margin
Particular 2018 2019
Gross profit 3345 3503
sales 6441 6738
Gross profit ratio =
GP/Sales*100
51.9% 52.0 %
Net profit ratio:
Particular 2018 2019
Net profit 366 431
sales 6441 6738
Net profit ratio =
NP/sales*100
5.68 % 6.40 %
Operating profit ratio
Particular 2018 2019
Operating profit 699 805
sales 6441 6738
Operating profit ratio =
OP/sales*100
10.85 % 11.95 %
Liquidity ratio
Particular 2018 2019
Current assets 2355 2303
current liabilities 3046 2511
Current ratio = Current
assets/current liabilities
(Liang, and Yan, 2019).
0.77 times .92 times
Quick ratio
Particular 2018 2019
tabler-icon-diamond-filled.svg

Paraphrase This Document

Need a fresh take? Get an instant paraphrase of this document with our AI Paraphraser
Document Page
Quick assets 1696 1595
Current liabilities 3046 2511
Quick ratio = 0.56 times .64 times
Efficiency ratios:
Stock turnover
Particular 2018 2019
Cost of goods sold 3096 3235
Stock. 659 708
Stock turnover = Cost of
goods sold/stock
4.70 times 4.57 times
Receivable turnover
Particular 2018 2019
sales 6441 6738
Receivables 1287 1259
Receivable turnover = Sales /
Receivables
5.00 times 5.35 times
Assets turnover ratio
Particular 2018 2019
sales 6441 6738
Total assets 10087 9736
Assets turnover ratio = Net
sales/total assets
0.64 times 0.69 times
Investment ratios:
Return on capital employed
Particular 2018 2019
Operating profit 699 805
Capital employed = Total
assets - Current liabilities
7041 7225
ROCE % Operating profit
\Capital employed
0.10
0.11
Return on equity ratio
Particular 2018 2019
Net income 6,441 6,738
Shareholder equity 2,912 3,088
ROE = Net income /
Sharholder’sequity
2.21
2.08
Dividend pay-out ratio
Particular 2018 2019
Document Page
Total dividend £242m 255m
Net income 6,441 6,738
Dividend pay-out ratio =
Total dividend \ Net income*
100
37.51
37.84
Earnings per share
Particular 2018 2019
Net profit 366 431
£4.00) £5.12
EPS = Net profit /price of
equity share
Assessment of financial performance of Chocco Plc
Chocco Plc's management is accountable for recognising the company's fiscal year success,
as well as calculating revenue, productivity, solvency, and capital employed. By calculating
every one of these ratios, it can be shown that Chocco Plc's prediction accuracy has improved in
2019 compared to 2018. They are capable of earning a higher net and also total profit that has a
serious influence on the institution's solvency. The frequency at which wealth is created and
dividends are distributed is likewise increasing. Which demonstrates that Chocco Plc's company
executive develops excellent corporate strategy for achieving company objectives (Hainich and
Bimber, 2016).
CONCLUSION
From the preceding evaluation, it can be stated that by employing accountancy foundation
principles and instruments, management are enabled to prepare balance sheets which adhere to
all GAAP requirements, as well as apply ratios to aid in the evaluation and evaluation of current
performances. It aids in the design of appropriate financial projections for controlling an
institution's financial resources.
Document Page
REFERENCES
Books and journals
Buduma, N. and Locascio, N., 2017. Fundamentals of deep learning: Designing next-generation
machine intelligence algorithms. " O'Reilly Media, Inc.".
Hainich, R.R. and Bimber, O., 2016. Displays: fundamentals & applications. AK Peters/CRC
Press.
chevron_up_icon
1 out of 7
circle_padding
hide_on_mobile
zoom_out_icon
[object Object]