PSY-380 Statistics Project: Analysis of Chocolate Consumption Data

Verified

Added on  2022/08/16

|6
|290
|17
Project
AI Summary
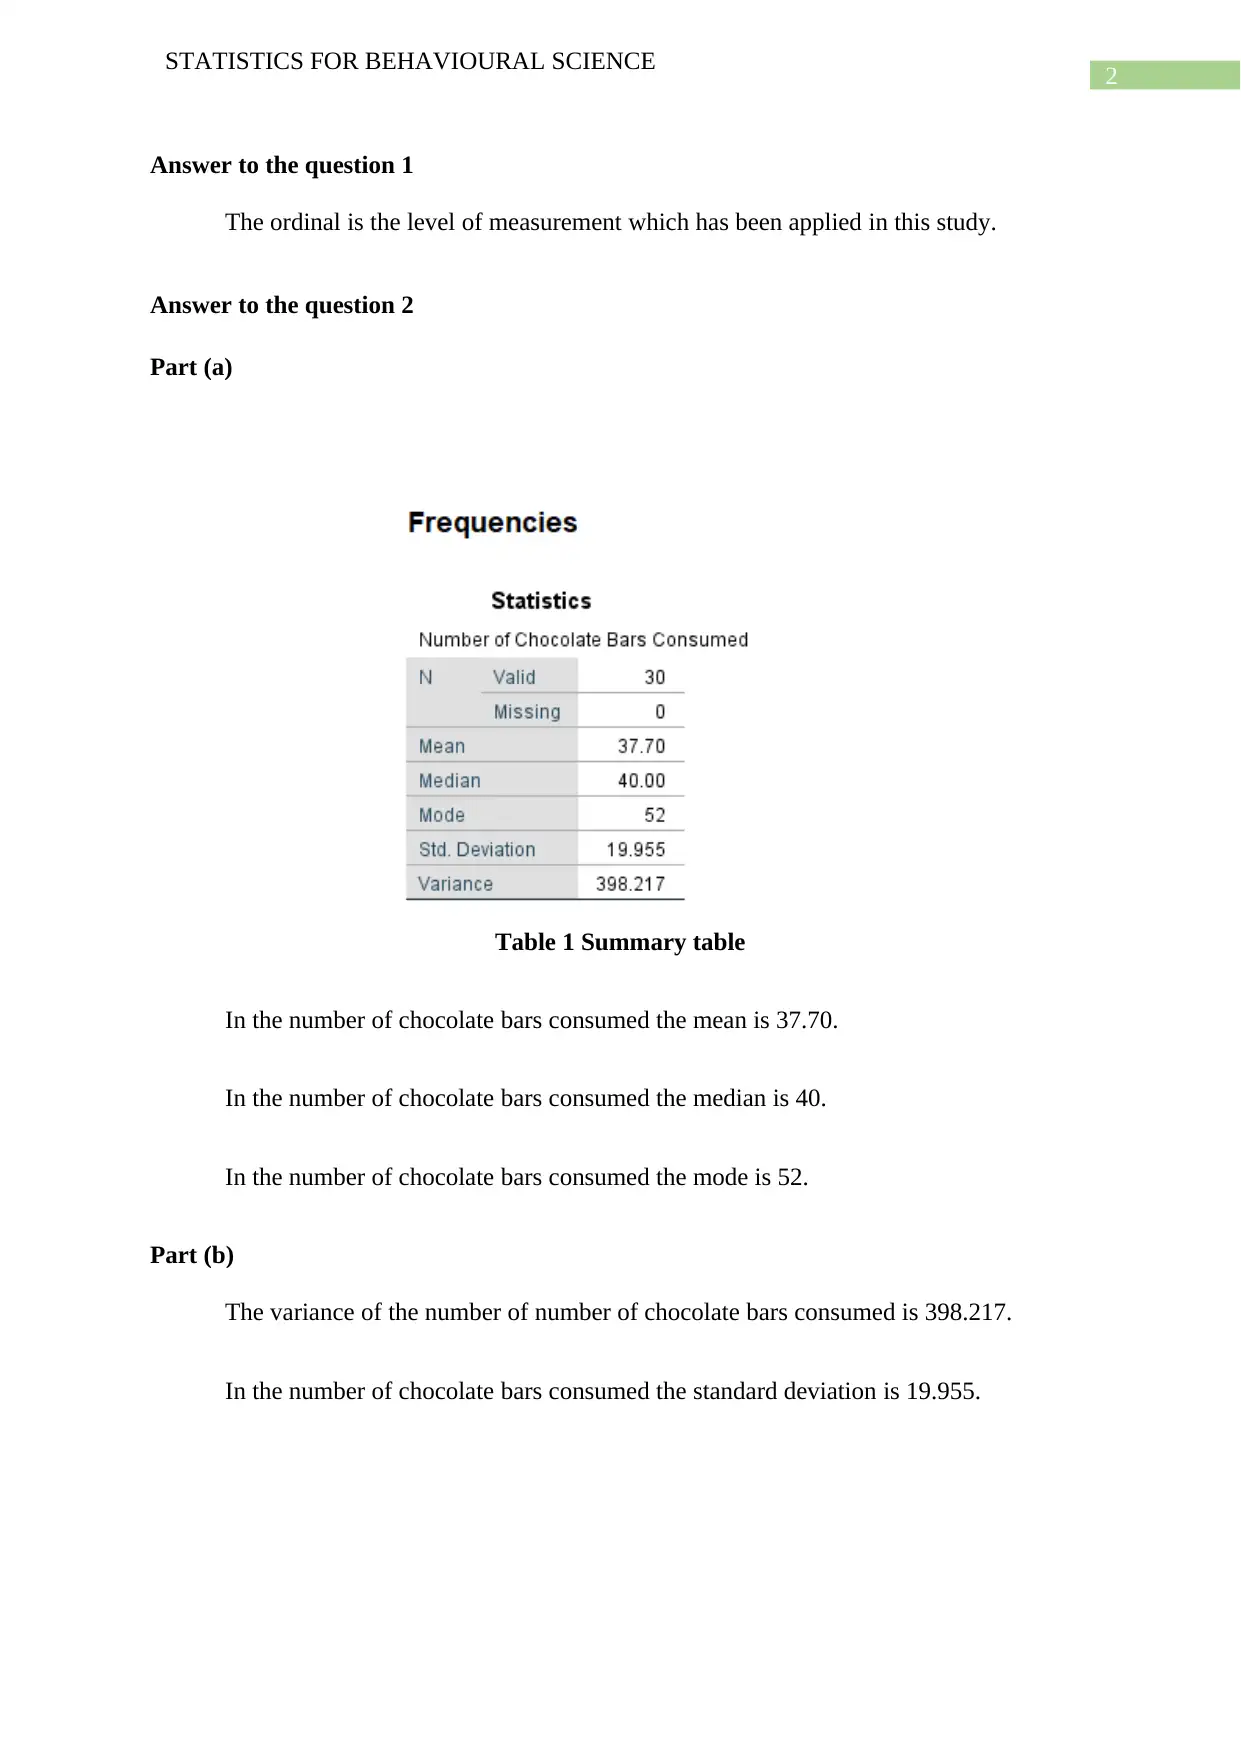
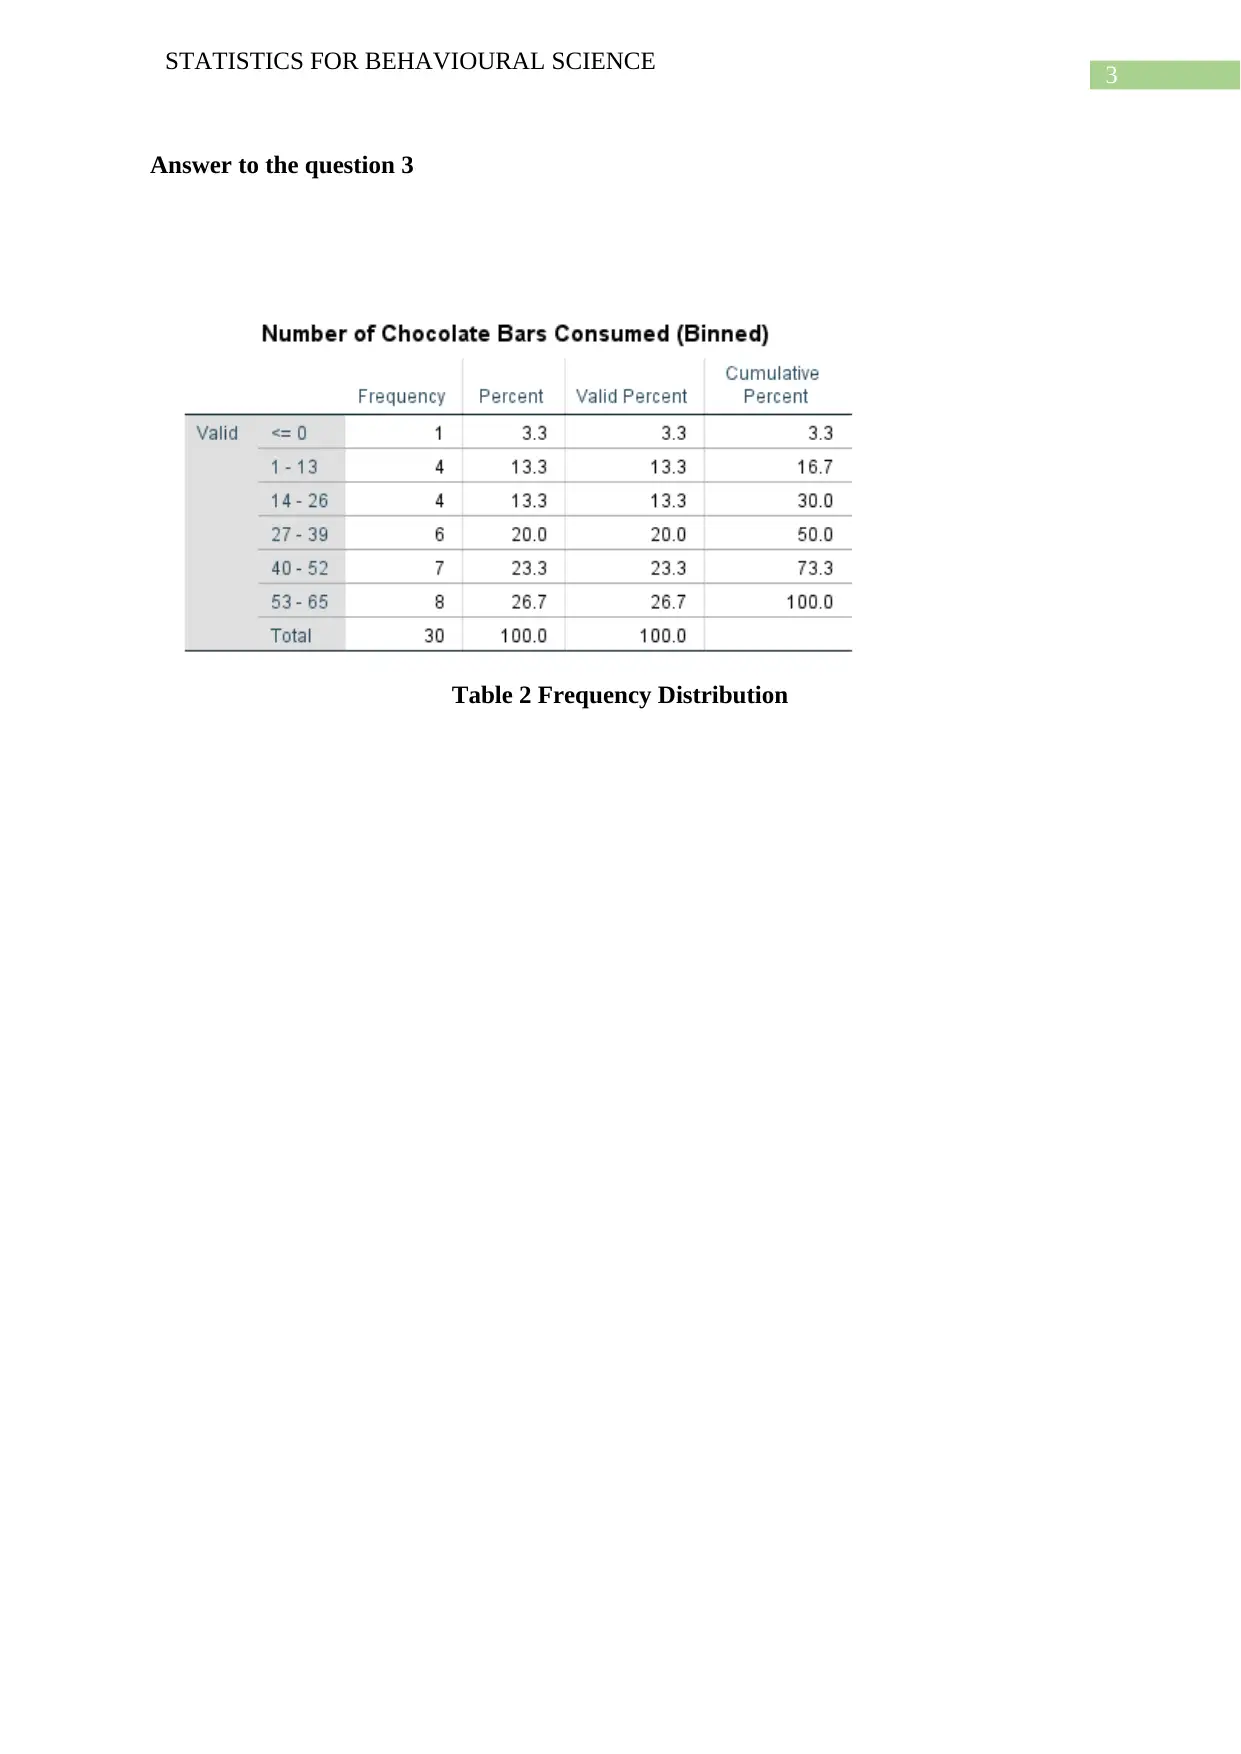
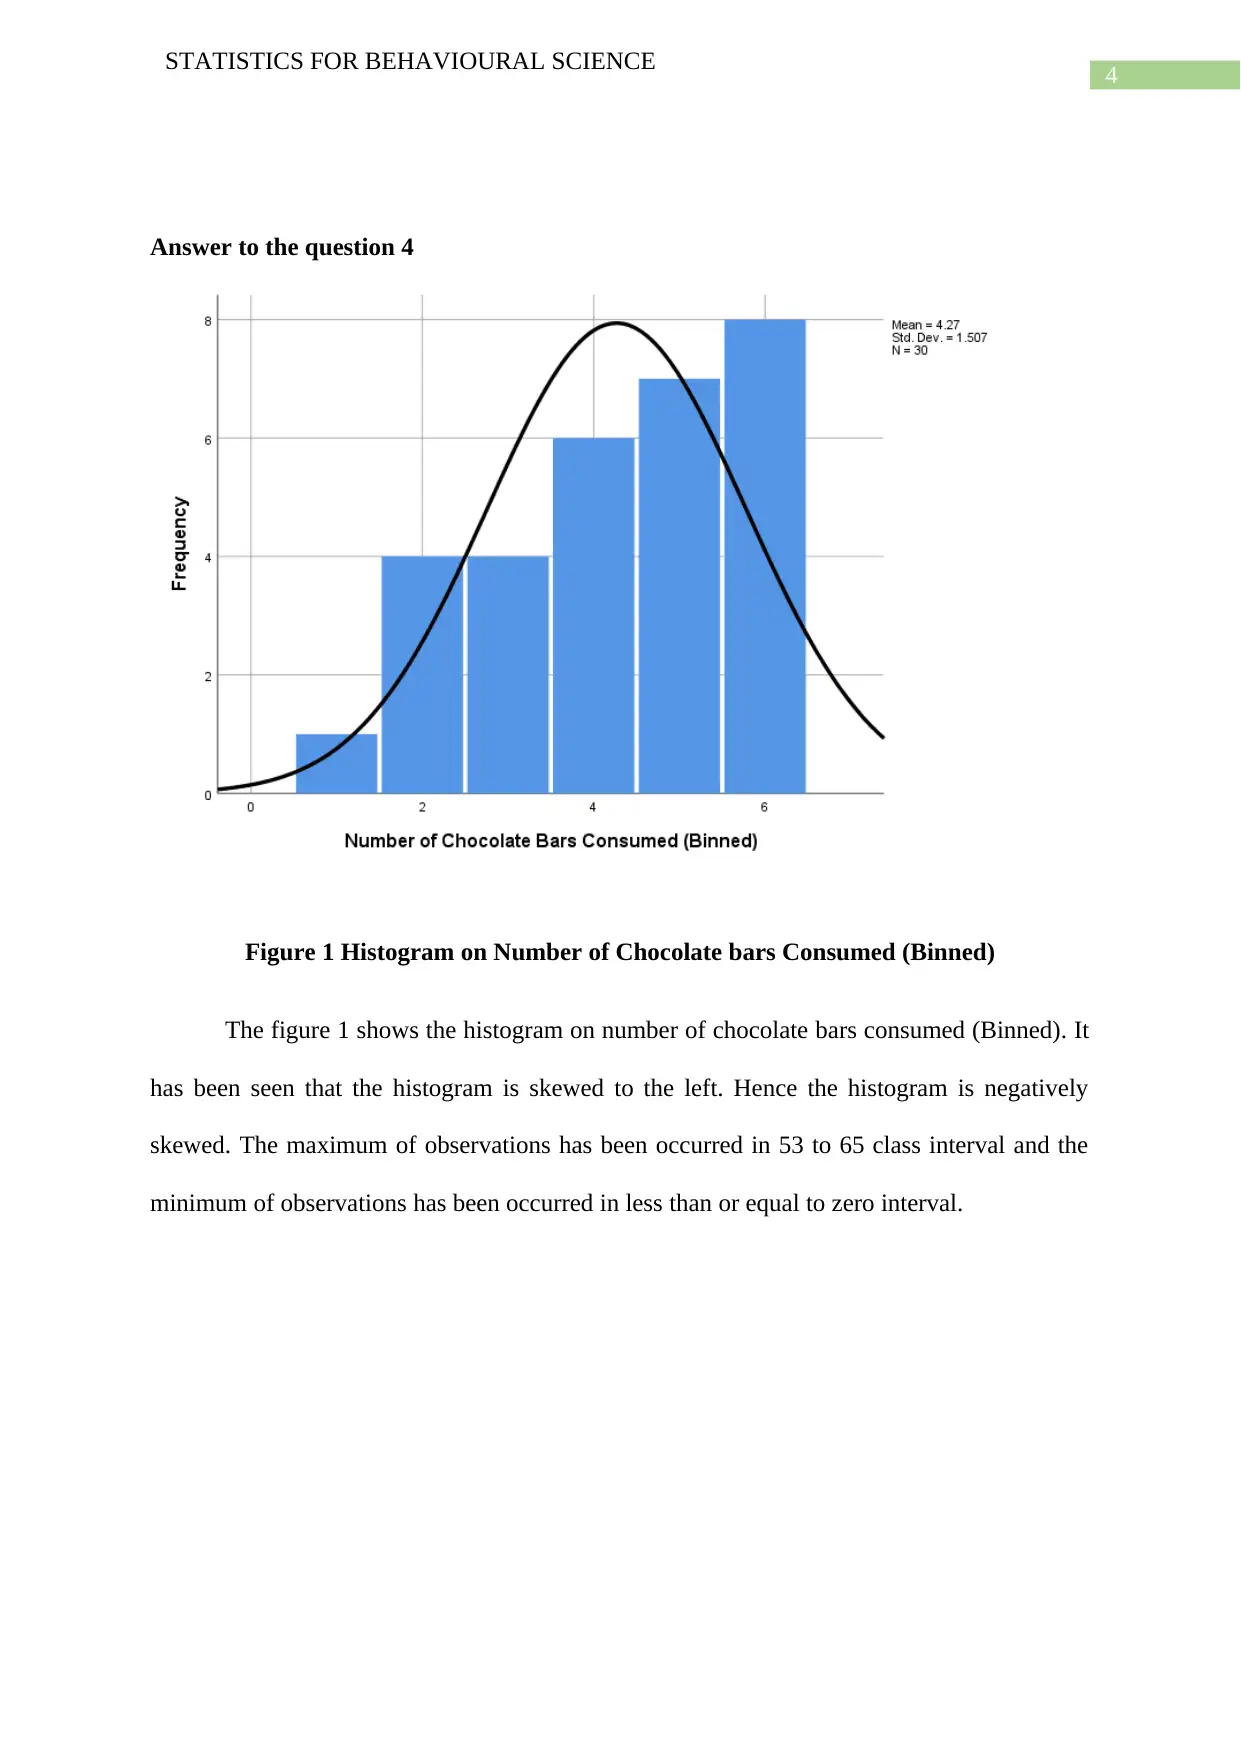
This project analyzes a dataset on chocolate consumption among 16-year-old girls. It begins by identifying the level of measurement used in the study, which is ordinal. The project then uses SPSS to calculate descriptive statistics, including the mean (37.70), median (40), and mode (52) of chocolate bars consumed. It also determines the variance (398.217) and standard deviation (19.955) of the data. A frequency distribution table with six intervals is created to organize the data, followed by the creation of a histogram. The histogram reveals a negative skew, indicating that the majority of observations fall on the higher end of the consumption range, with the maximum observations occurring in the 53-65 class interval. The project's results are summarized in tables and figures.
Document Page
Running head: STATISTICS FOR BEHAVIOURAL SCIENCE
Statistics for Behavioural Science
Name of the Student:
Name of the University:
Author note:
tabler-icon-diamond-filled.svg

Paraphrase This Document

Need a fresh take? Get an instant paraphrase of this document with our AI Paraphraser
Document Page
1
STATISTICS FOR BEHAVIOURAL SCIENCE
Table of Contents
Answer to the question 1............................................................................................................2
Answer to the question 2............................................................................................................2
Part (a)....................................................................................................................................2
Part (b)....................................................................................................................................2
Answer to the question 3............................................................................................................3
Answer to the question 4............................................................................................................4
Bibliography...............................................................................................................................5
Document Page
2
STATISTICS FOR BEHAVIOURAL SCIENCE
Answer to the question 1
The ordinal is the level of measurement which has been applied in this study.
Answer to the question 2
Part (a)
Table 1 Summary table
In the number of chocolate bars consumed the mean is 37.70.
In the number of chocolate bars consumed the median is 40.
In the number of chocolate bars consumed the mode is 52.
Part (b)
The variance of the number of number of chocolate bars consumed is 398.217.
In the number of chocolate bars consumed the standard deviation is 19.955.
Document Page
3
STATISTICS FOR BEHAVIOURAL SCIENCE
Answer to the question 3
Table 2 Frequency Distribution
tabler-icon-diamond-filled.svg

Paraphrase This Document

Need a fresh take? Get an instant paraphrase of this document with our AI Paraphraser
Document Page
4
STATISTICS FOR BEHAVIOURAL SCIENCE
Answer to the question 4
Figure 1 Histogram on Number of Chocolate bars Consumed (Binned)
The figure 1 shows the histogram on number of chocolate bars consumed (Binned). It
has been seen that the histogram is skewed to the left. Hence the histogram is negatively
skewed. The maximum of observations has been occurred in 53 to 65 class interval and the
minimum of observations has been occurred in less than or equal to zero interval.
Document Page
5
STATISTICS FOR BEHAVIOURAL SCIENCE
Bibliography
Hinton, P.R., 2014. Statistics explained. Routledge.
Holcomb, Z.C., 2016. Fundamentals of descriptive statistics. Routledge.
chevron_up_icon
1 out of 6
circle_padding
hide_on_mobile
zoom_out_icon
[object Object]