Data Analysis and Machine Learning with Pyspark: Chocolate Ratings
VerifiedAdded on 2022/10/13
|12
|1485
|13
Report
AI Summary
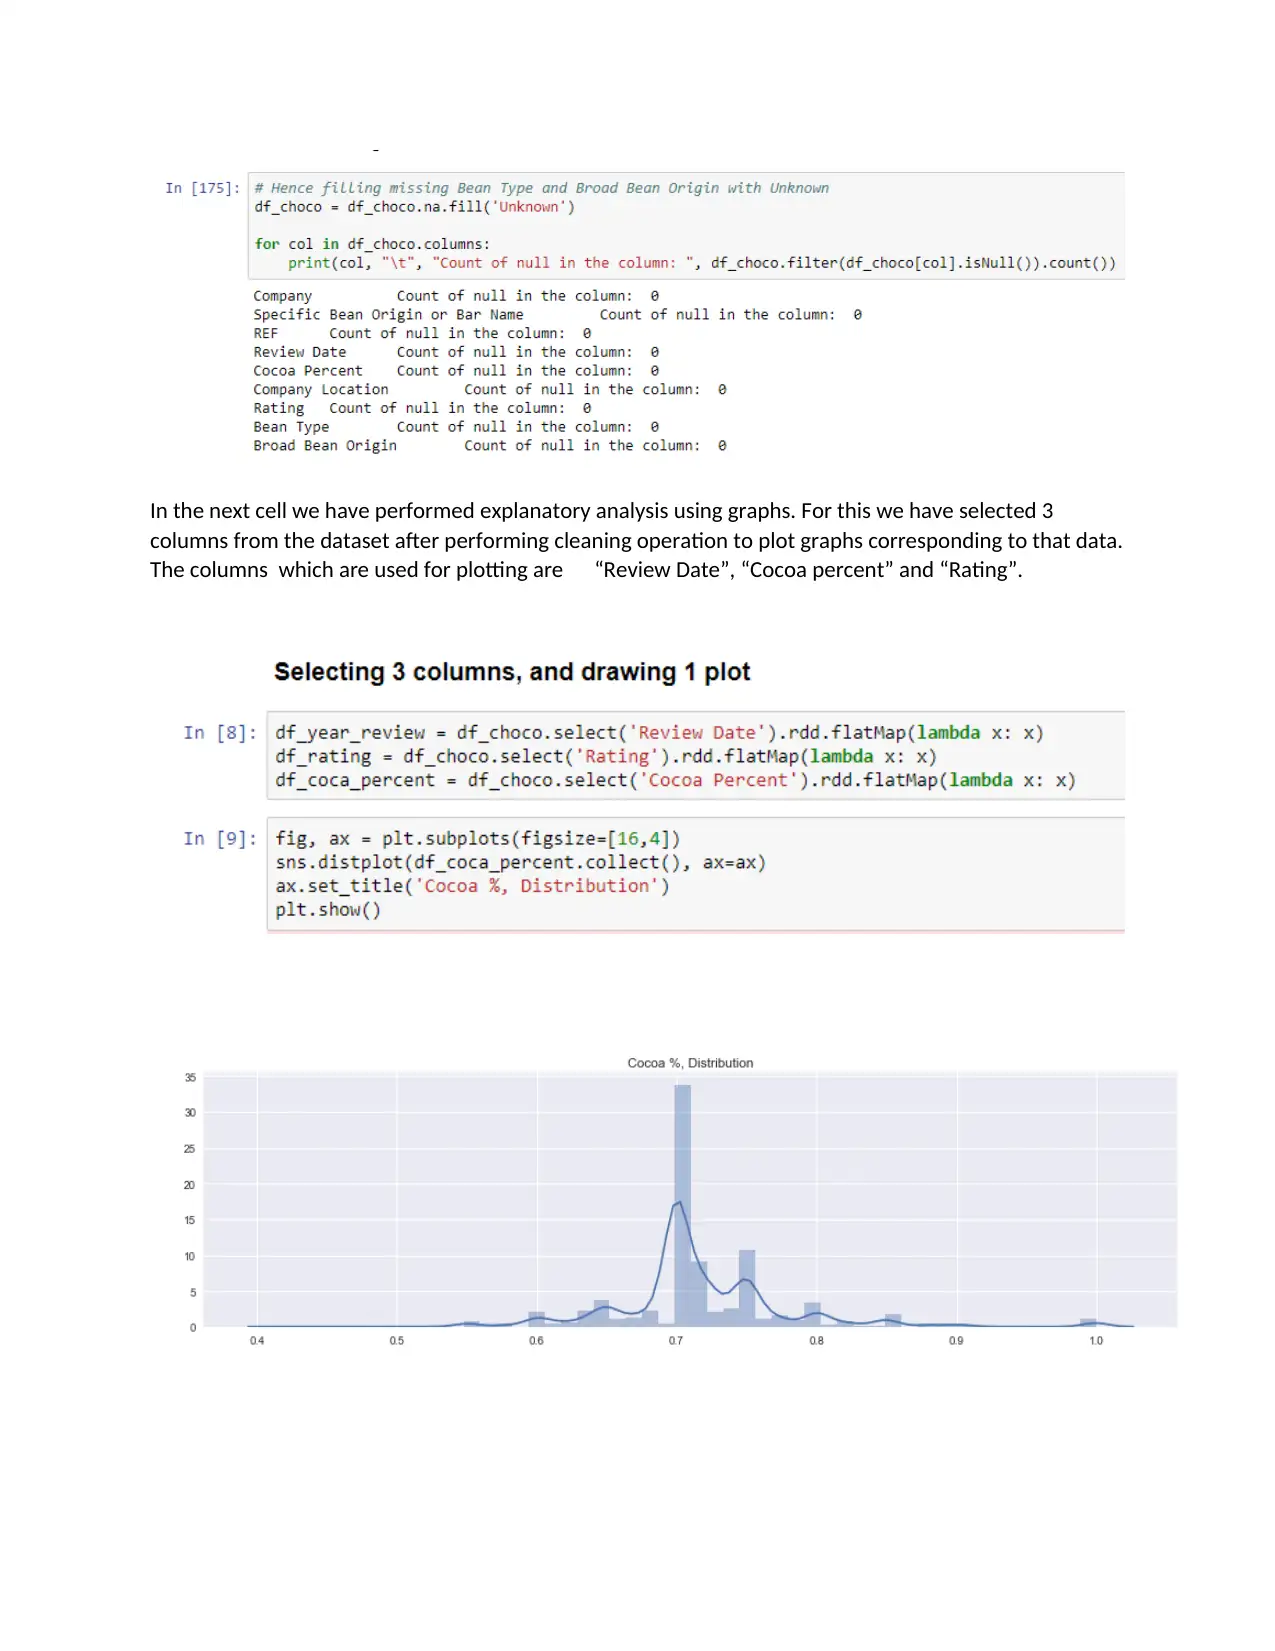
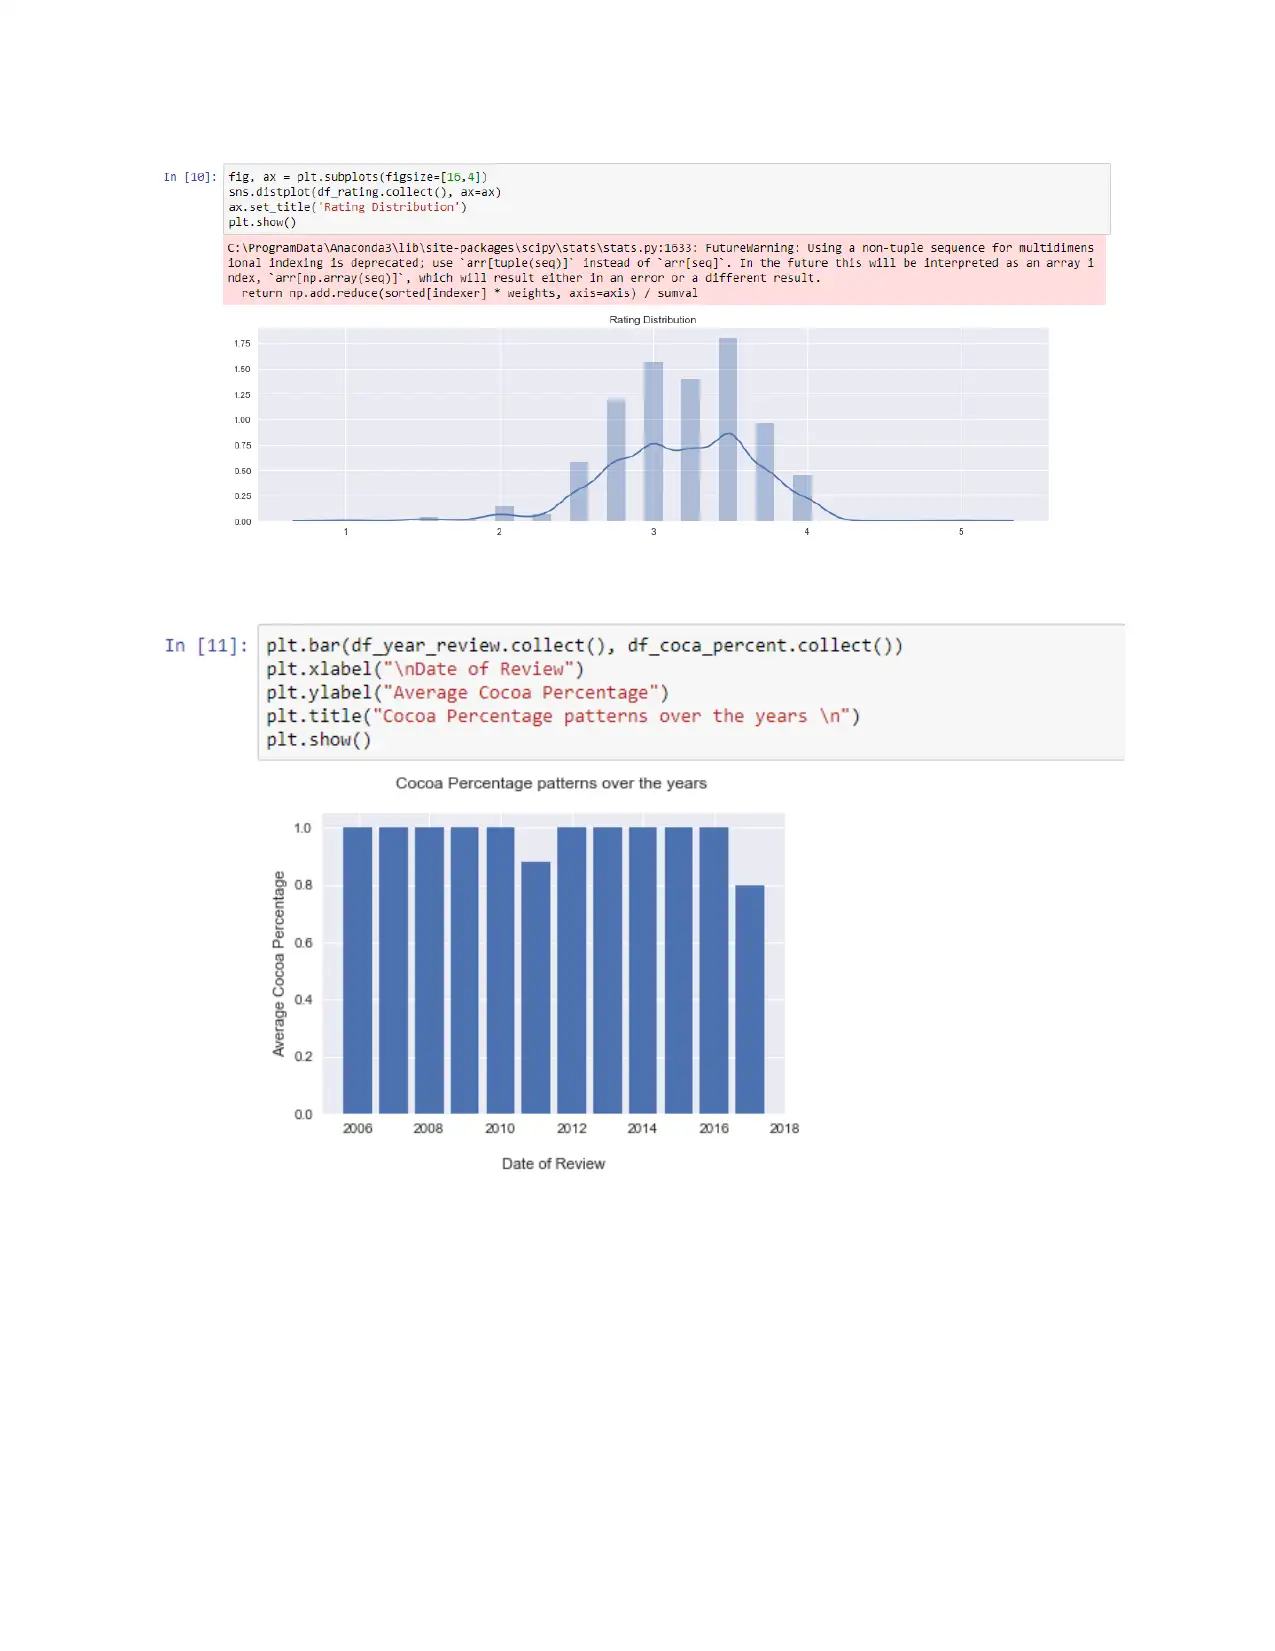
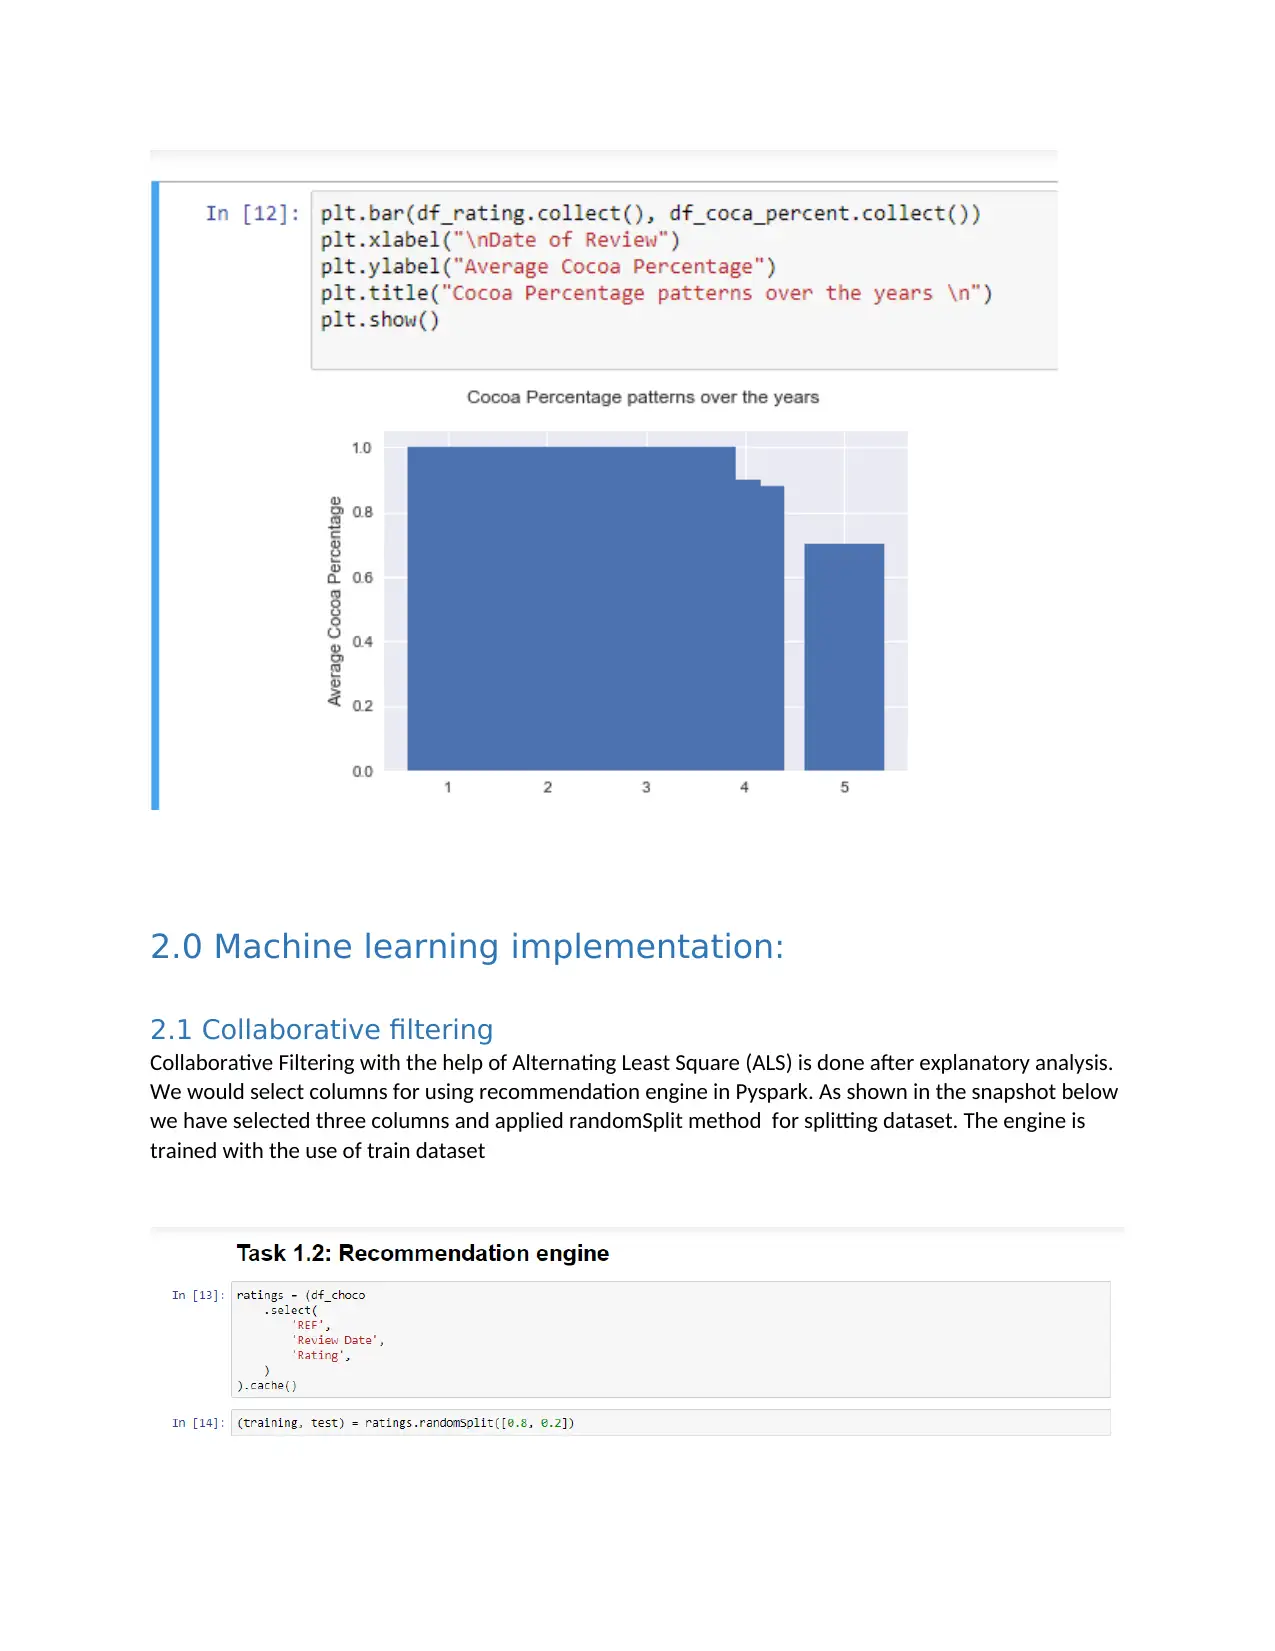
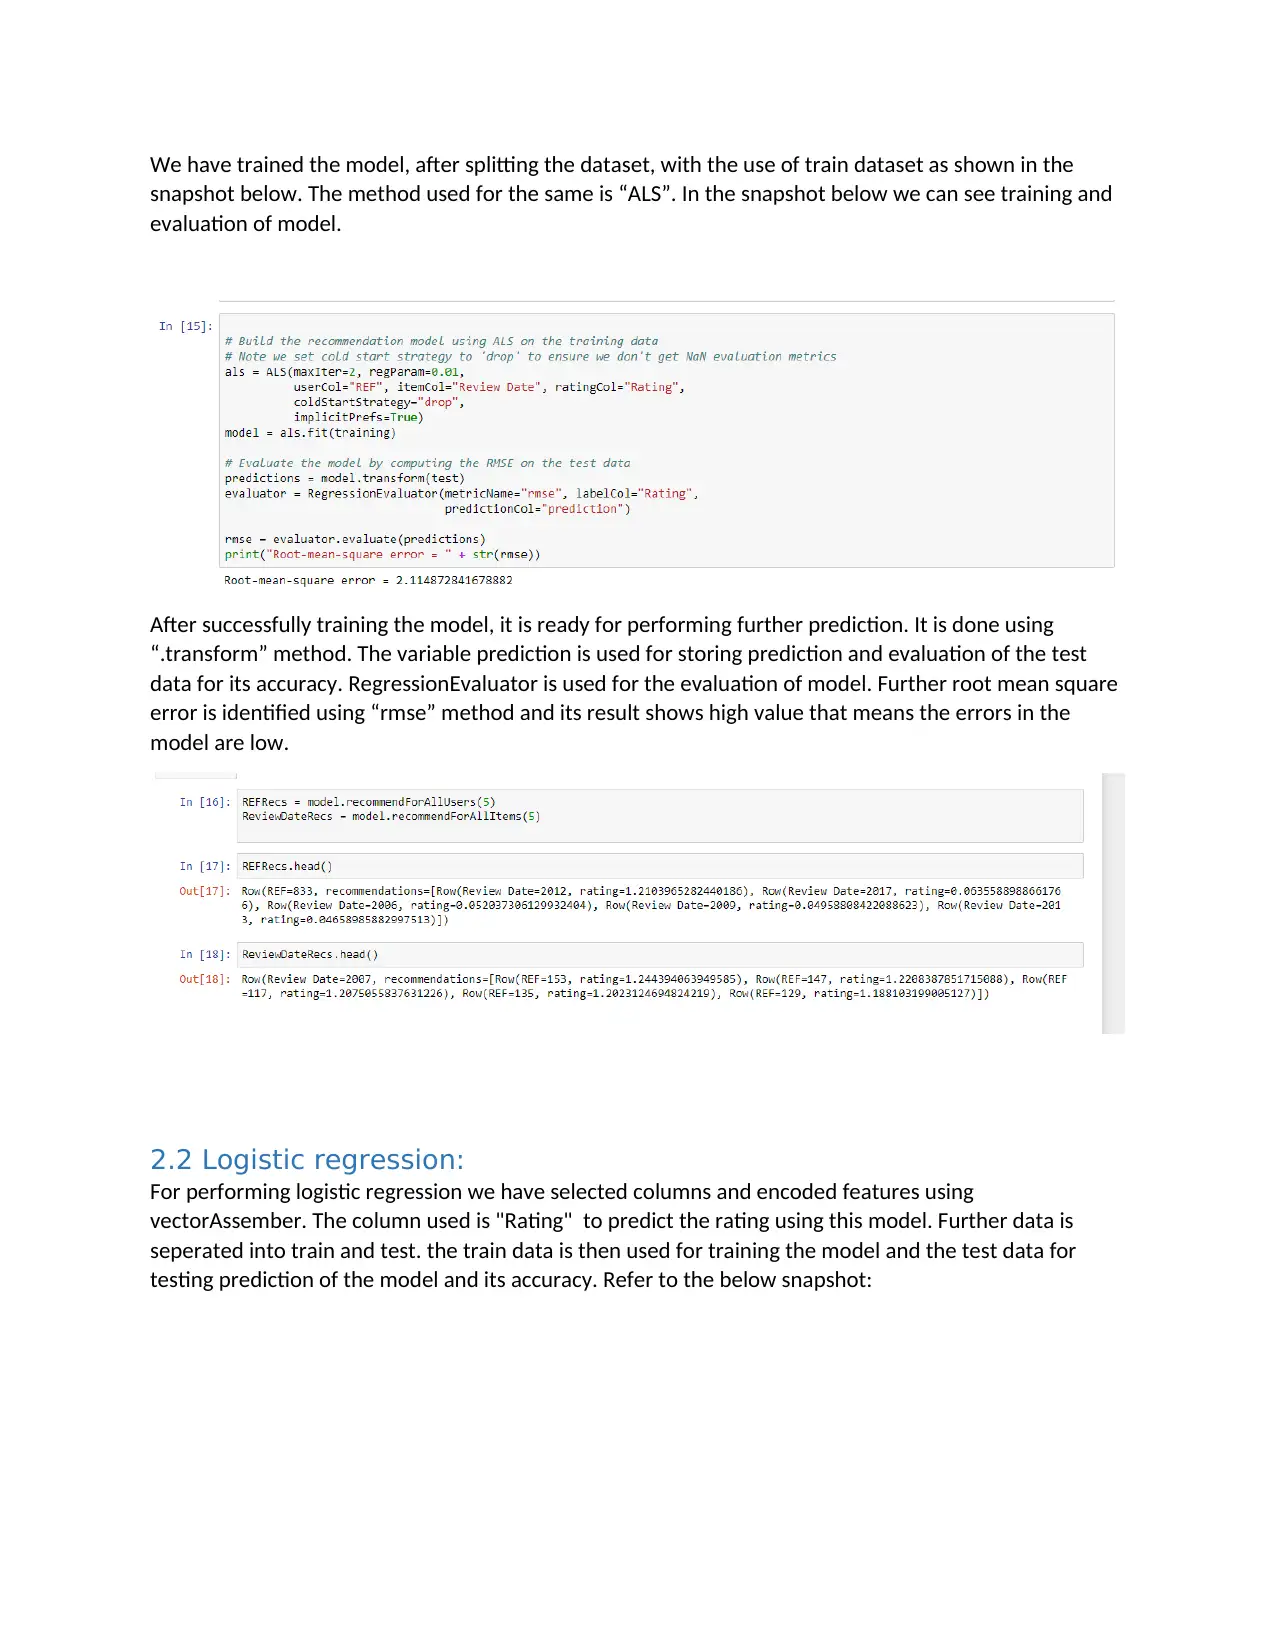
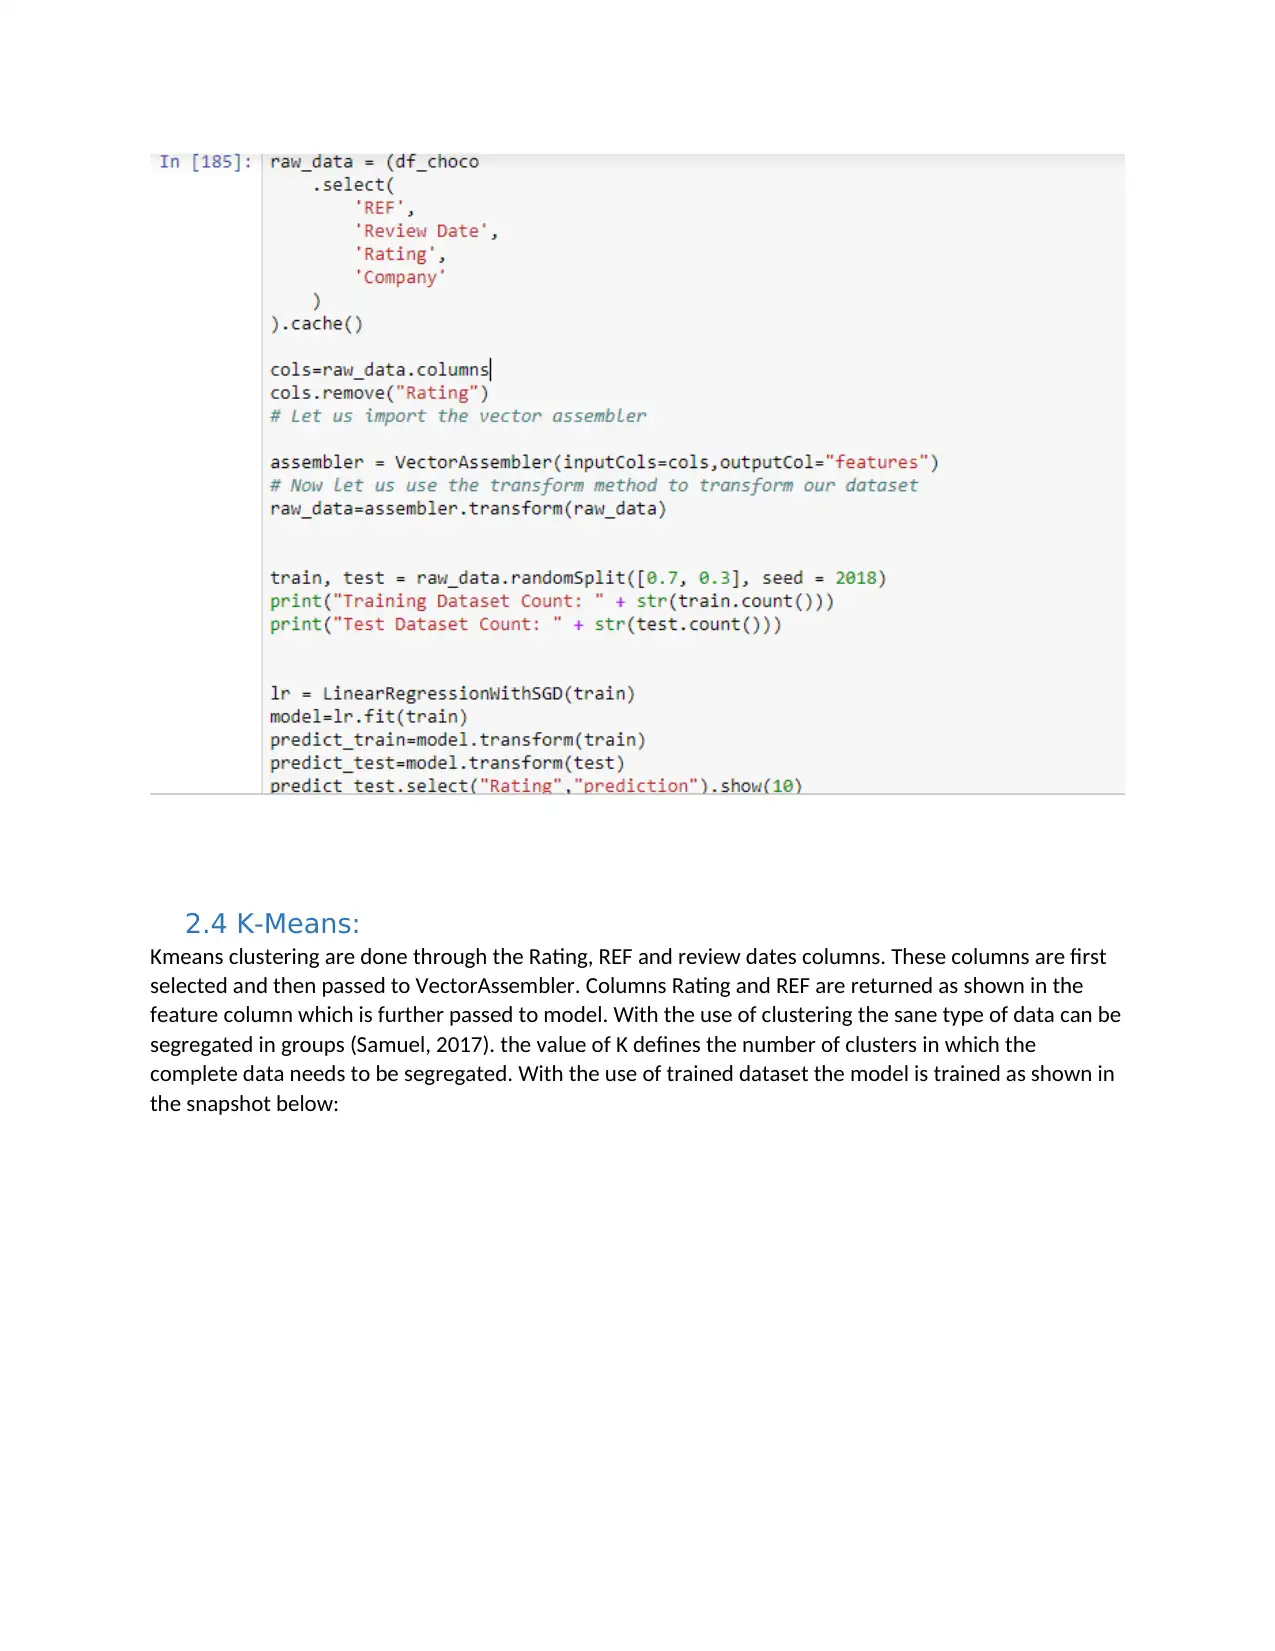
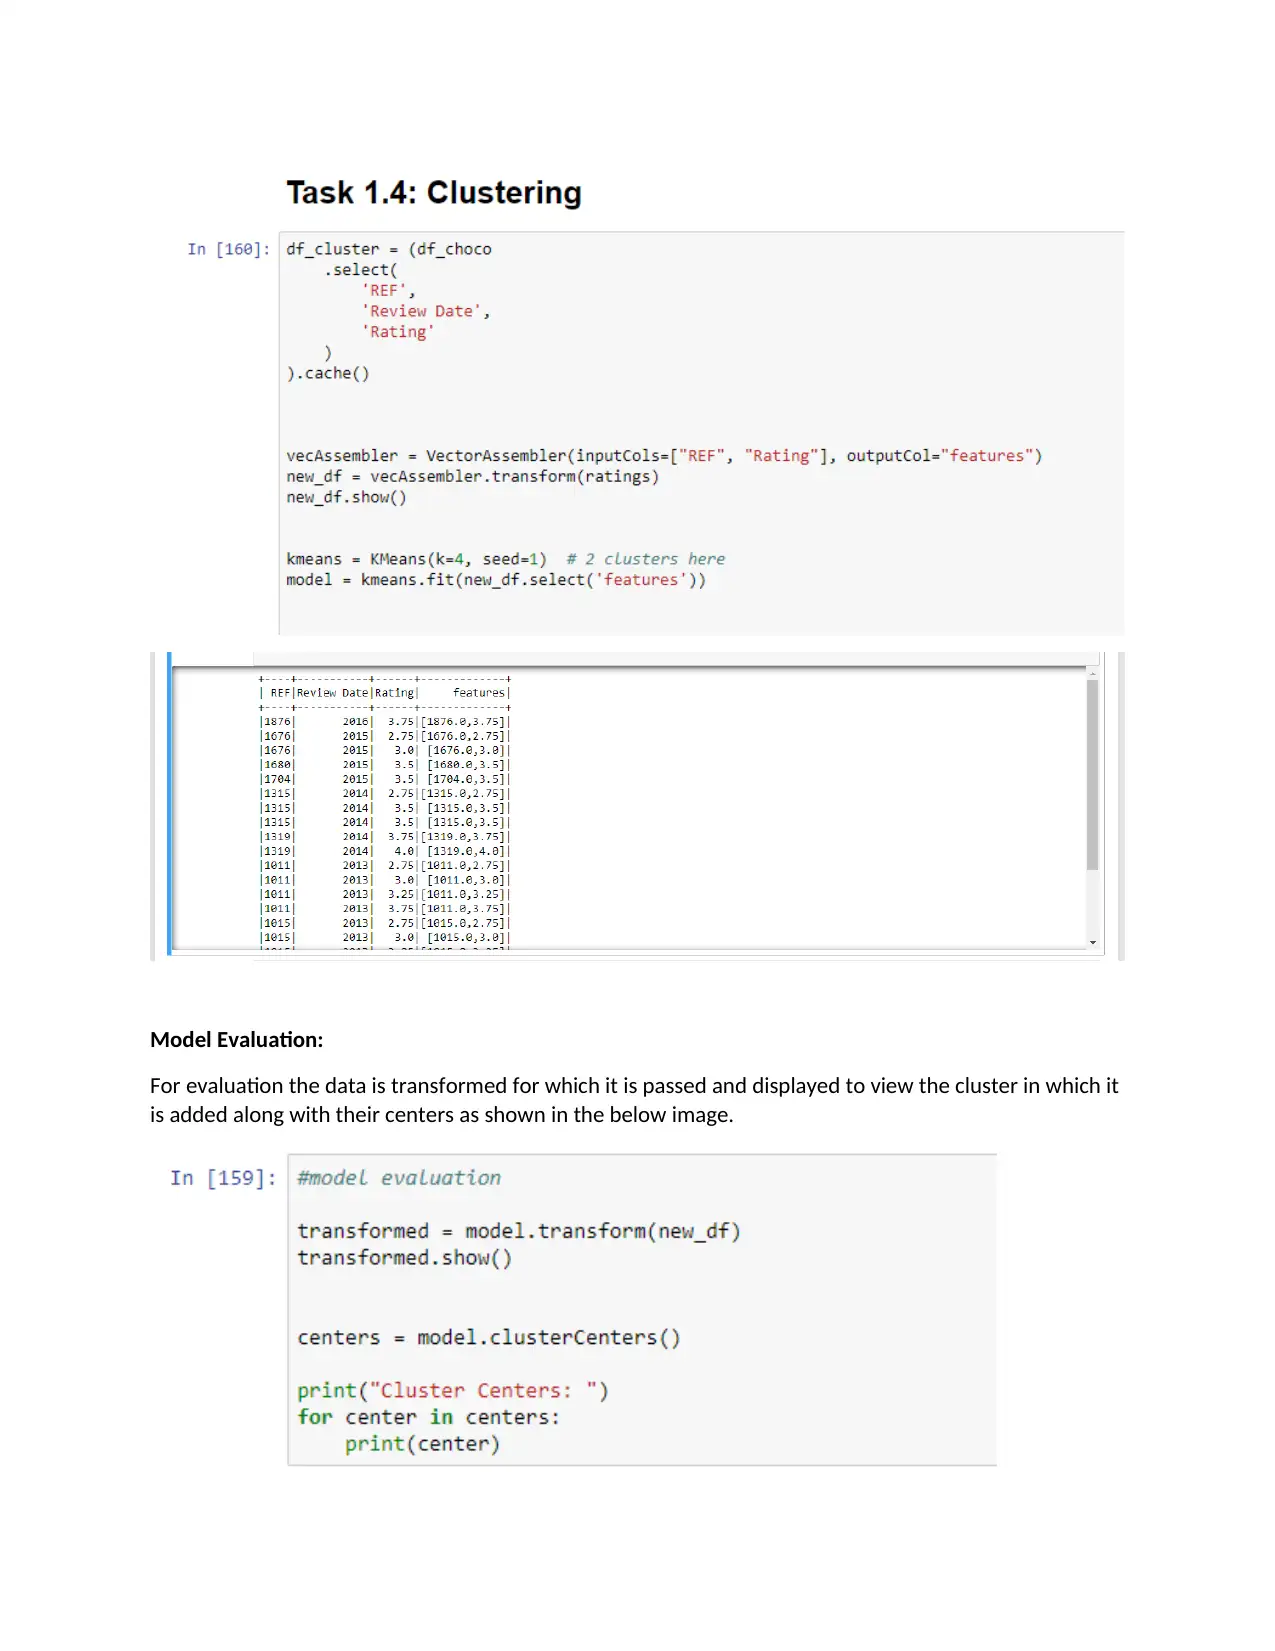
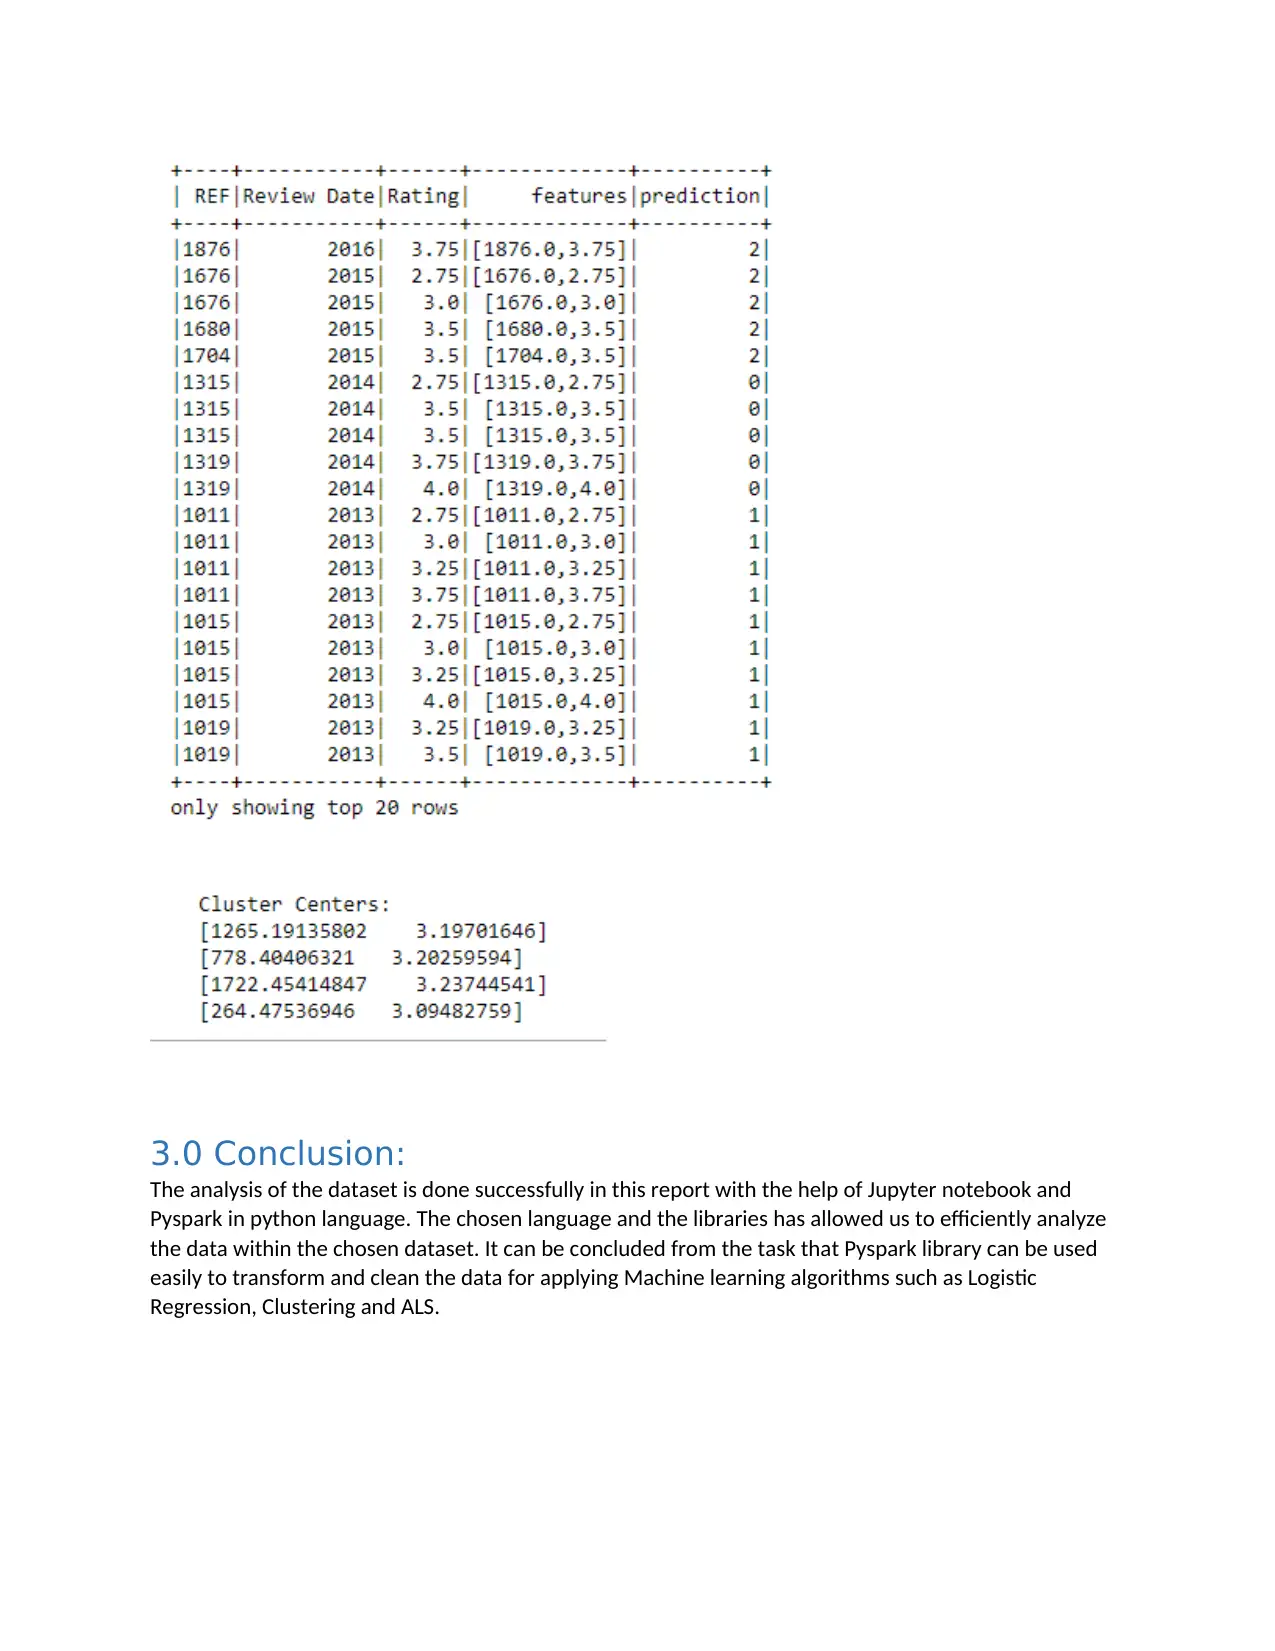
This report presents a detailed analysis of a chocolate bar ratings dataset using Pyspark and Python within a Jupyter notebook environment. The introduction highlights the growing importance of machine learning and the capabilities of Pyspark for handling large datasets. The report details the data cleaning process, including handling missing values and data transformation. Exploratory data analysis is performed using visualizations generated with Spark, seaborn, and matplotlib. The core of the report focuses on the implementation of machine learning algorithms, including collaborative filtering using Alternating Least Squares (ALS), logistic regression, and K-Means clustering. Each algorithm is explained, from data preparation and model training to evaluation using techniques like RegressionEvaluator and RMSE. The report concludes by summarizing the successful application of Pyspark and its libraries for data analysis, machine learning, and model evaluation, demonstrating its effectiveness for analyzing the chosen dataset. The references include relevant academic papers that support the analysis and methods used.

Contents
1.0 Introduction...........................................................................................................................................2
2.0 Machine learning implementation:.......................................................................................................8
2.1 Collaborative filtering........................................................................................................................8
2.3 Logistic regression:............................................................................................................................9
2.4 K-Means:..........................................................................................................................................10
3.0 Conclusion:..........................................................................................................................................12
References:................................................................................................................................................13
Paraphrase This Document
Need a fresh take? Get an instant paraphrase of this document with our AI Paraphraser

1.0 Introduction
Machine learning is a field related to computational statistics which enables computer to learn by its
own instead to explicit programming. From estimation of insurance risk and home loans to self driving
cars the use of machine learning has gained significant importance in data analytics (Aziz, Zaidouni &
Bellafkih, 2019). To compute huge amount of data for data analytics various tools are available in the
market. Spark is one of the fastest and reliable tool to compute streams of data. This report shows the
utilization of Pyspark, which is the library provided by Python to use spark, for the analysis of data on to
gain meaningful insights. The dataset on which we would be working in this assignment is taken from
Chocolate bar ratings. Pyspark is able to solve problems on parallel data proceeding and can handle
multiprocessing complexities for example, distributing code, dta and collection of output on cluster of
machines (Asri, Mousannif & Moatassime, 2019). Pyspark provide the data scientist with the interface to
use Resilient Distributed Datasets (RDD) and many functions to perform machine learning computations
in Python language. Thus, the complete analysis on dataset is done with the use of Pyspark alone with
the use of Jupyter notebook as a tool.
The chosen dataset has in total 9 columns on which entire analysis would be performed. The dataset has
been attached with the report for reference. The libraries that are to be used in the notebook are
imported in the first section and are used in the rest of the code. with spark, seaborn and matplotlib
libraries has been used in the notebook to visualize the dataset. Kmeans, LinearRegressionwithSGD and
ALS are the Machine learning classes imported in the notebook.
Jupyter notebook are incredibly versatile, powerful, shareable and the main advantage is that data
visualization can be performed in the same environment without going anywhere else. In short the
environment allows for coding, running and looking at the code outcome and analyze the results in the
same environment (). It has independent cells for writing different parts of codes and run the them and

view the results independently. As shown in the image below we have performed analysis of the data-
sets in the succeeding cells. within the first cell (as shown in the image) CSV file structure has been
created. The structure is then passed in read.csv method. To store the file in cache, .cached method has
been utilized which can be later retrieved from the cache. To enable the first column as header the
parameter "header" is set "true". In the definition of structure we have also specified the data-types as
per them the fields within the data-frame are imported.
In the succeeding cell the file schema, that has been imported into the Pyspark data-frame, is displayed
with the help of method “printSchema()”. In the below image we can see the output that shows the
columns within the file along with their data-types details and details of nullable.
⊘ This is a preview!⊘
Do you want full access?
Subscribe today to unlock all pages.

Trusted by 1+ million students worldwide

The next cell is shown in the below snapshots shown the total number of rows and columns in the
Pyspark dataframe. It can be seen that there are 1795 rows and 9 columns in the dataframe.
In the next cell we have prepared the data by data cleaning for performing further analysis. Data
cleaning is important to avoid unrealistic values in the anaysis of data in graphs and models. As a part of
cleaning operations, the missing values are checked first. We have performed the same and also
checked for the number of null values in specific columns. The result of data cleaning operation can be
seen in the snapshot below:
First we drop the rows which has company column null (because company name is important for
chocolate hence will remove rows which is not having company name)
We have dropped the rows that has null values for some important columns as shown in the below
snapshot. To drop the rows "na.drop()" method is used with subset parameter. As soon as the specified
column's row having null values are removed it cleans all the columns. For the columns that stores string
values we have filled them with "unknown" values using the method "na.fill()"
Paraphrase This Document
Need a fresh take? Get an instant paraphrase of this document with our AI Paraphraser

In the next cell we have performed explanatory analysis using graphs. For this we have selected 3
columns from the dataset after performing cleaning operation to plot graphs corresponding to that data.
The columns which are used for plotting are “Review Date”, “Cocoa percent” and “Rating”.
columns from the dataset after performing cleaning operation to plot graphs corresponding to that data.
The columns which are used for plotting are “Review Date”, “Cocoa percent” and “Rating”.

⊘ This is a preview!⊘
Do you want full access?
Subscribe today to unlock all pages.

Trusted by 1+ million students worldwide

2.0 Machine learning implementation:
2.1 Collaborative filtering
Collaborative Filtering with the help of Alternating Least Square (ALS) is done after explanatory analysis.
We would select columns for using recommendation engine in Pyspark. As shown in the snapshot below
we have selected three columns and applied randomSplit method for splitting dataset. The engine is
trained with the use of train dataset
Paraphrase This Document
Need a fresh take? Get an instant paraphrase of this document with our AI Paraphraser

We have trained the model, after splitting the dataset, with the use of train dataset as shown in the
snapshot below. The method used for the same is “ALS”. In the snapshot below we can see training and
evaluation of model.
After successfully training the model, it is ready for performing further prediction. It is done using
“.transform” method. The variable prediction is used for storing prediction and evaluation of the test
data for its accuracy. RegressionEvaluator is used for the evaluation of model. Further root mean square
error is identified using “rmse” method and its result shows high value that means the errors in the
model are low.
2.2 Logistic regression:
For performing logistic regression we have selected columns and encoded features using
vectorAssember. The column used is "Rating" to predict the rating using this model. Further data is
seperated into train and test. the train data is then used for training the model and the test data for
testing prediction of the model and its accuracy. Refer to the below snapshot:

2.4 K-Means:
Kmeans clustering are done through the Rating, REF and review dates columns. These columns are first
selected and then passed to VectorAssembler. Columns Rating and REF are returned as shown in the
feature column which is further passed to model. With the use of clustering the sane type of data can be
segregated in groups (Samuel, 2017). the value of K defines the number of clusters in which the
complete data needs to be segregated. With the use of trained dataset the model is trained as shown in
the snapshot below:
⊘ This is a preview!⊘
Do you want full access?
Subscribe today to unlock all pages.

Trusted by 1+ million students worldwide

Model Evaluation:
For evaluation the data is transformed for which it is passed and displayed to view the cluster in which it
is added along with their centers as shown in the below image.
For evaluation the data is transformed for which it is passed and displayed to view the cluster in which it
is added along with their centers as shown in the below image.
Paraphrase This Document
Need a fresh take? Get an instant paraphrase of this document with our AI Paraphraser

3.0 Conclusion:
The analysis of the dataset is done successfully in this report with the help of Jupyter notebook and
Pyspark in python language. The chosen language and the libraries has allowed us to efficiently analyze
the data within the chosen dataset. It can be concluded from the task that Pyspark library can be used
easily to transform and clean the data for applying Machine learning algorithms such as Logistic
Regression, Clustering and ALS.

References:
Asri, H., Mousannif, H. & Moatassime, H.A. 2019, "Reality mining and predictive analytics for building
smart applications", Journal of Big Data, vol. 6, no. 1, pp. 1-25.
Aziz, K., Zaidouni, D. & Bellafkih, M. 2019, "Leveraging resource management for efficient performance
of Apache Spark", Journal of Big Data, vol. 6, no. 1, pp. 1-23.
Samuel, J. 2017, "INFORMATION TOKEN DRIVEN MACHINE LEARNING FOR ELECTRONIC MARKETS:
PERFORMANCE EFFECTS IN BEHAVIORAL FINANCIAL BIG DATA ANALYTICS", Journal of Information
Systems and Technology Management : JISTEM, vol. 14, no. 3, pp. 371-383.
⊘ This is a preview!⊘
Do you want full access?
Subscribe today to unlock all pages.

Trusted by 1+ million students worldwide
1 out of 12
Related Documents
Your All-in-One AI-Powered Toolkit for Academic Success.
+13062052269
info@desklib.com
Available 24*7 on WhatsApp / Email
Unlock your academic potential
Copyright © 2020–2025 A2Z Services. All Rights Reserved. Developed and managed by ZUCOL.


