Chronic Kidney Disease of Unknown Etiology (CKDu) in India: Analysis
VerifiedAdded on 2022/09/09
|12
|10772
|19
Report
AI Summary
This report presents a secondary data analysis of three population-based cross-sectional studies conducted in India between 2010 and 2014, focusing on the prevalence of chronic kidney disease of unknown etiology (CKDu). The study aimed to assess the distribution of estimated glomerular filtration rate (eGFR) and identify risk factors for CKDu in urban and rural areas of Northern and Southern India. Key findings include a 1.6% prevalence of eGFR below 60 mL/min per 1.73 m2 in individuals without diabetes, hypertension, or heavy proteinuria, with variations across regions. In Northern India, older age was the primary risk factor, while in Southern India, rural residence, older age, and less education were associated with lower eGFR and CKDu. The study highlights that CKDu is present in India and identifies risk factors consistent with those reported in Central America and Sri Lanka, contributing valuable insights into the global epidemiology of CKDu. The study emphasizes the need for further research and public health interventions to address this emerging health concern.
1O’Callaghan-Gordo C, et al. BMJ Open 2019;9:e023353. doi:10.1136/bmjopen-2018-023353
Open access
Prevalence of and risk factors for
chronic kidney disease of unknown
aetiology in India: secondary data
analysis of three population-based
cross-sectional studies
Cristina O’Callaghan-Gordo,1,2,3,4 Roopa Shivashankar,5,6 Shuchi Anand,7
Shreeparna Ghosh,5 Jason Glaser,4,8 Ruby Gupta,5 Kristina Jakobsson,9,10
Dimple Kondal,5,6 Anand Krishnan,11 Sailesh Mohan,5 Viswanathan Mohan,12,13
Dorothea Nitsch,14 Praveen P A,6,15 Nikhil Tandon,15 K M Venkat Narayan,16
Neil Pearce,4,17 Ben Caplin,18 Dorairaj Prabhakaran5,6
To cite: O’Callaghan-Gordo C,
Shivashankar R, Anand S, et al.
Prevalence of and risk factors
for chronic kidney disease of
unknown aetiology in India:
secondary data analysis of
three population-based cross-
sectional studies. BMJ Open
2019;9:e023353. doi:10.1136/
bmjopen-2018-023353
► Prepublication history and
additional material for this
paper are available online. To
view these files, please visit
the journal online (-2018-
023353">http://dx. doi.org/ 10.
1136/bmjopen- 2018-023353).
CO’C-G and RS are joint first
authors.
BC and DP are joint last authors.
Received 4 April 2018
Revised 26 October 2018
Accepted 4 January 2019
For numbered affiliations see
end of article.
Correspondence to
Dr Cristina O’Callaghan-Gordo;
cristina. ocallaghan@isglobal. org
Research
© Author(s) (or their
employer(s)) 2019. Re-use
permitted under CC BY.
Published by BMJ.
AbstrACt
Objectives To assess whether chronic kidney disease
of unknown aetiology (CKDu) is present in India and to
identify risk factors for it using population-based data and
standardised methods.
Design Secondary data analysis of three population-
based cross-sectional studies conducted between 2010
and 2014.
setting Urban and rural areas of Northern India (states
of Delhi and Haryana) and Southern India (states of Tamil
Nadu and Andhra Pradesh).
Participants 12 500 individuals without diabetes,
hypertension or heavy proteinuria.
Outcome measures Mean estimated glomerular filtration
rate (eGFR) and prevalence of eGFR below 60 mL/min
per 1.73 m2 (eGFR <60) in individuals without diabetes,
hypertension or heavy proteinuria (proxy definition of CKDu).
results The mean eGFR was 105.0±17.8 mL/min per
1.73 m2. The prevalence of eGFR <60 was 1.6% (95%
CI=1.4 to 1.7), but this figure varied markedly between
areas, being highest in rural areas of Southern Indian
(4.8% (3.8 to 5.8)). In Northern India, older age was the
only risk factor associated with lower mean eGFR and
eGFR <60 (regression coefficient (95% CI)=−0.94 (0.97
to 0.91); OR (95% CI)=1.10 (1.08 to 1.11)). In Southern
India, risk factors for lower mean eGFR and eGFR
<60, respectively, were residence in a rural area (−7.78
(-8.69 to –6.86); 4.95 (2.61 to 9.39)), older age (−0.90
(–0.93 to –0.86); 1.06 (1.04 to 1.08)) and less education
(−0.94 (-1.32 to –0.56); 0.67 (0.50 to 0.90) for each
5 years at school).
Conclusions CKDu is present in India and is not confined
to Central America and Sri Lanka. Identified risk factors are
consistent with risk factors previously reported for CKDu in
Central America and Sri Lanka.
IntrODuCtIOn
High prevalence of chronic kidney disease
of unknown aetiology (CKDu) has mainly
been reported in the last decades among
the working age populations of agricul-
tural communitiesof tropical/subtropical
regions, specifically in Central America and
Sri Lanka.1–3 In Nicaragua and El Salvador,
the estimated prevalence of estimated
glomerular filtration rate (eGFR; the clin-
ical measure of kidney function) below
60 mL/min per 1.73 m2 (eGFR <60), in the
absence of diabetes and hypertension, was
10%–20%.4–6 It has been suggestedthat
CKDu may also be highly prevalent in other
low-income and middle-incomecountries
(LMICs), including India.7–11 However, it is
not clear in which other regions of the world
CKDu occurs, whether the underlying aeti-
ology is the same in different regions and
what the risk factors are. Currently, there is
no consensus, but factors such as heat stress,
strengths and limitations of this study
► The use of a random selection of population-base
participants allows the estimation of chronic kidn
disease of unknown aetiology (CKDu) prevalence
the general population.
► A large sample size including participants from d
ferent areas of India (urban and rural, and North
and Southern India) increases the representa
ness of the results.
► The use of standardised definitions of CKDu facil
tates international comparisons of CKDu prevale
and risk factors.
► The prevalence of estimated glomerular filtra
rate <60 observed in this study is likely to be un
estimated; however, this is unlikely to have biase
the internal comparisons conducted in this study
copyright.
on April 9, 2020 at India:BMJ-PG Sponsored. Protected byhttp://bmjopen.bmj.com/BMJ Open: first published as 10.1136/bmjopen-2018-023353 on 7 March 2019. Downloaded from
Paraphrase This Document
Need a fresh take? Get an instant paraphrase of this document with our AI Paraphraser
2 O’Callaghan-Gordo C, et al. BMJ Open 2019;9:e023353. doi:10.1136/bmjopen-
Open access
strenuous work, climatic conditions, agrochemical use,
heavy metal exposure and infections have been suggested
as risk factors.1 12–15
Data on CKDu from India are scarce. The recent report
of verbal autopsy data from India suggests CKD of all
causes is a growing problem. However, it does not provide
accurate population-based data on CKDu.16 17 Existing
reports indicate that CKDu may be common but it is diffi-
cult to be definite about this because of the absence of
population-based studies using standardised and compa-
rable methods. Data from the Indian CKD Registry, a
hospital based registry of incident cases of CKD between
2006 and 2010, found that CKDu was the second most
common form of CKD after diabetic nephropathy.10
However, this is restricted to referred cases and there-
fore may not be representative of the general population.
There are also sporadic reports of high numbers of CKDu
casesamong agriculturalcommunitiesof the South
Eastern Indian states of Andhra Pradesh and Odisha
(reviewedby Chatterejee18 and Ganguli19
). However,
population-based data have not been reported for India.
We conducted a secondaryanalysis of represen-
tative sample surveysconducted in India between
2010 and 2014. Given the absence of a clear case defini-
tion for CKDu it is necessary to make a presumptive diag-
nosis based on measures/estimates of GFR in the absence
of known risk factors for kidney disease. The overall aim
of the current study was to use a methodology which is
comparable with previous studies elsewhere in the world
(particularly in Central America) to assess the extent to
which reduced kidney function is a problem in India, and
which areas and subpopulations are most affected. We
therefore: (1) assessed the distribution eGFR and preva-
lence of eGFR below 60 mL/min per 1.73 m2 (eGFR <60)
in Indian populations restricted to those without known
risk factors for CKD, i.e. diabetes, hypertension or heavy
proteinuria; (2) compared these outcomes in North and
South India and in urban and rural populations; and (3)
identified the risk factors associated with these outcomes.
MethODs
study population
We used cross-sectional data from three population-based
studies conducted in India: the ‘Centre for Cardiometa-
bolic Risk Reduction in South Asia’ cohort study (CARRS
study),20 the ‘Implementing a comprehensive diabetes
preventionand managementprogram’ study (UDAY
study)21 and the ‘Prevalence of Coronary Heart Disease
repeat survey’ study funded by the Indian Council of
Medical Research (ICMR-CHD study).22 Details on study
design and selection of participants from the CARRS,
UDAY and ICMR-CHD studies have been previously
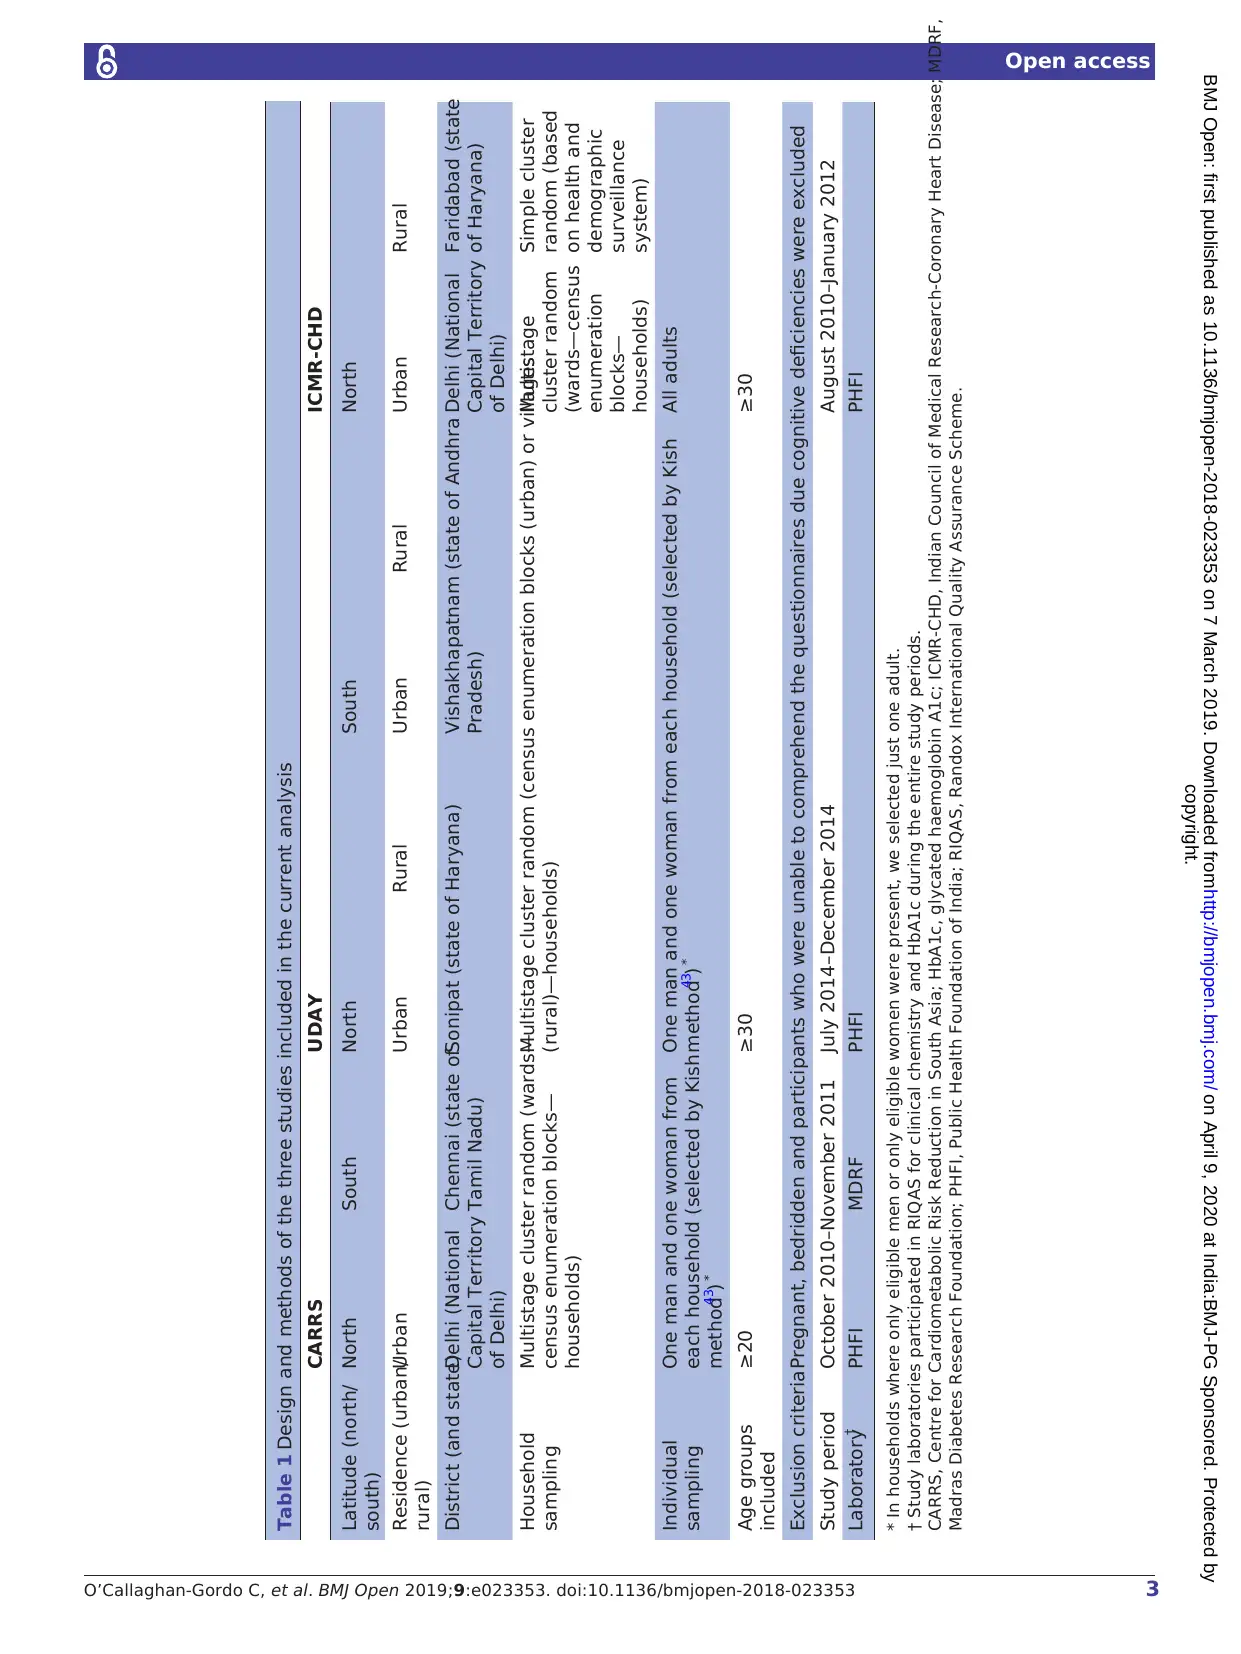
described20–22and are summarised in table 1.
For the current analyses, we excluded participants with
missing information on serum creatinine, as this vari-
able was necessary to estimate eGFR. As the focus of our
study was CKDu, we excluded participants with known
risk factors for CKD (ie, diabetes and hypertension) o
evidence of primary glomerular disease (as assessed
heavy proteinuria) or with missing information for these
risk factors. We also excluded participants with missin
information on basic covariables(education) for all
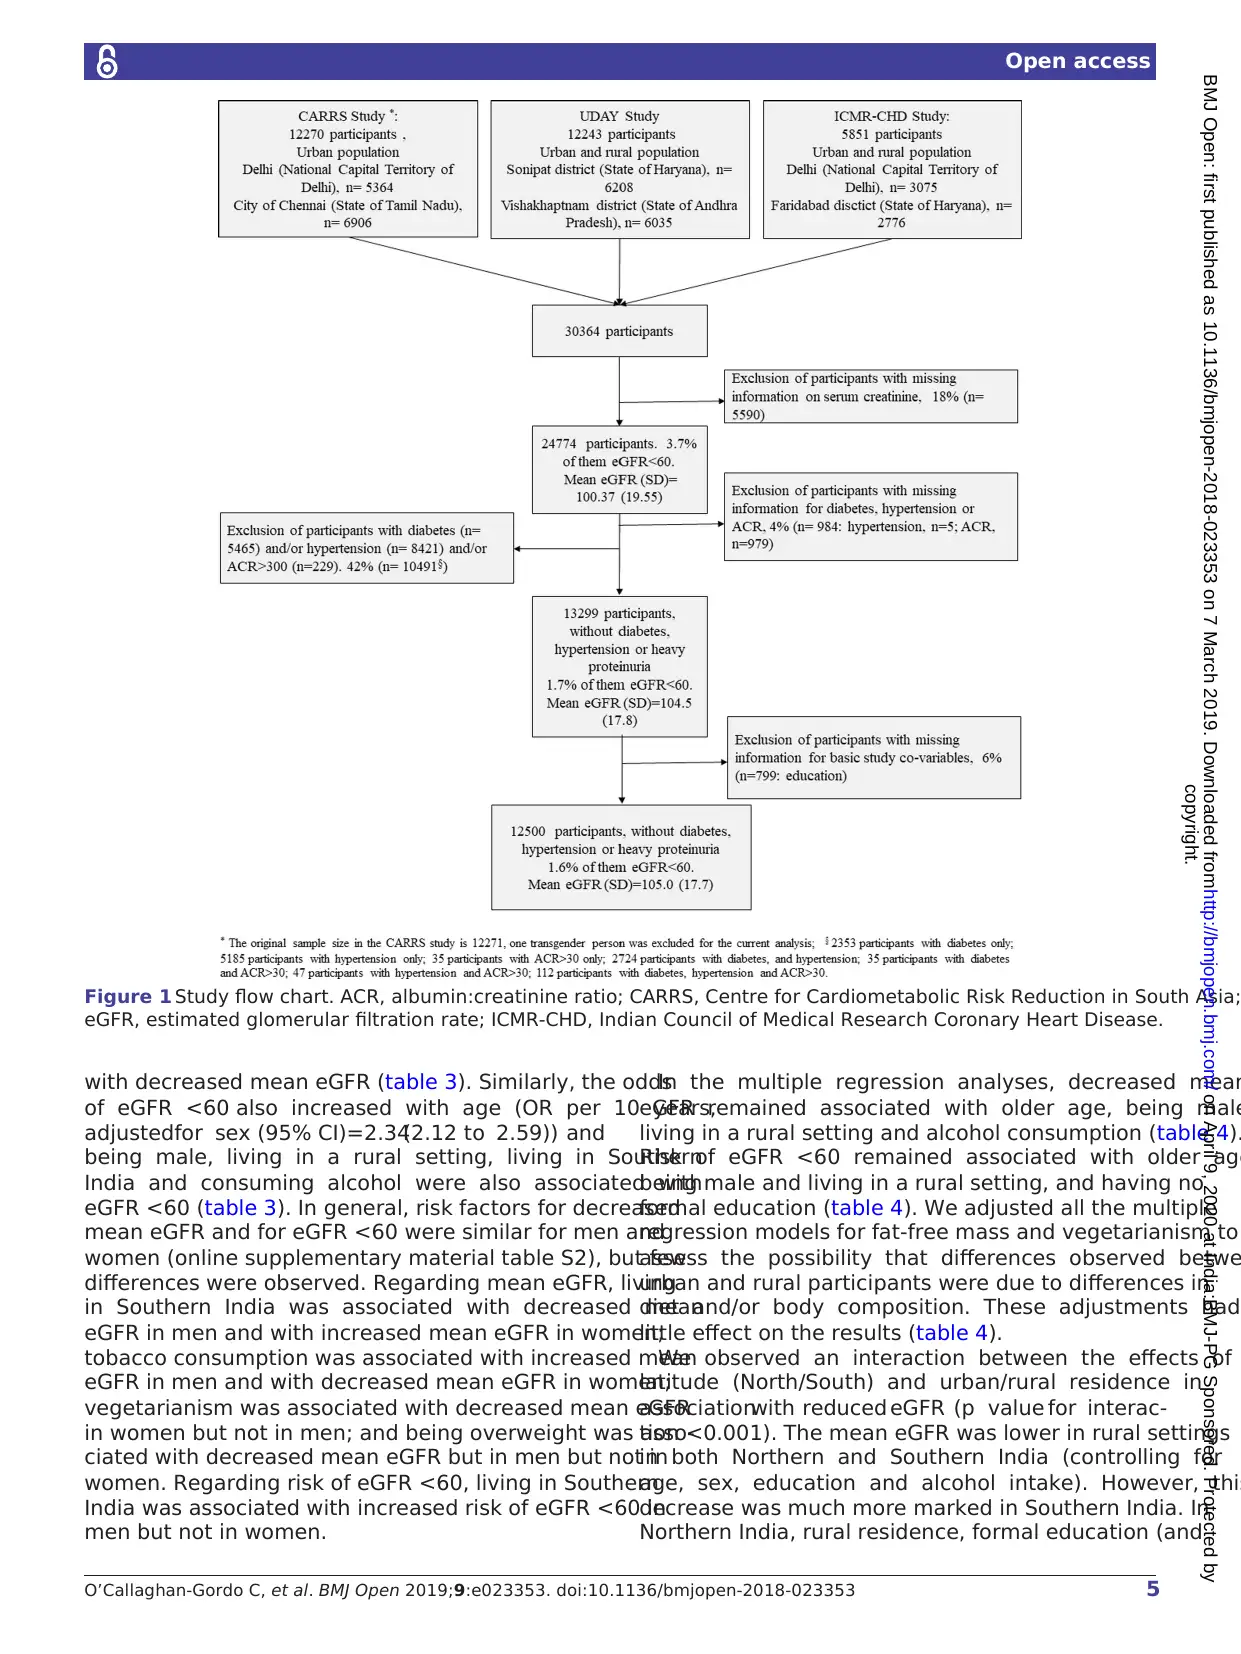
the analyses conducted. A study flowchart is presente
We classified participants as having: diabetes, if plasm
fasting glucose was≥126 mg/dL or glycated haemoglobin
A1c (HbA1c) was≥6.5% or self-reported diabetes; hyper-
tension, if systolic blood pressure was≥140 mm Hg or
diastolic blood pressure was≥90 mm Hg or self-reported
hypertension; and heavy proteinuria, if the albumin:cre-
atinine ratio (ACR) in urine was≥300 mg/g. We used the
CKD-EPI equation to estimate GFR.23
Data collection and laboratory analyses
Data collection was conducted between October 2010
and December 2014. All three studies used a standardised
questionnaire to collect data on age, sex, completed year
of education (0,≤5, >5–≤10, >10), alcohol intake (ever,
never) and dietary habits (vegetarian yes, no). Weigh
height and body composition were measured using stadi-
ometers (SECA 214 in the three studies) and electronic
bioimpedance measuring instruments (Tanita BC 418 in
CARRS and ICMR-CHD studies, and Tanita BC 601 in
UDAY study). Body mass index (BMI, kg/m2) was calcu-
lated and categorised (≤18.5: underweight; >18.5–≤25:
normal weight; >25–≤30: overweight;>30: obese) and fat
free mass was derived from bioelectric impedance anal-
ysis. In CARRS and ICMR-CHD studies, fat-free mass
(kg) was directly measured as previously described,24
whereas in UDAY study, fat free mass was estimated from
the percentage of total body fat. To estimate fat-free
mass from the percentage of body fat, we calculated the
amount of total body fat by multiplying the percentage
of body fat by the weight of the participant, and fro
that value we estimated the amount of fat-free mass
subtracting the weight of total body fat from the tota
weight of the participant. Blood pressure was measured
using electronic sphygmomanometers (OMRON (HEM-
7080) in CARRS and ICMR-CHD studies, and OMRON
(HEM 7200) in UDAY study), as previously reported.20 25
Stadiometers, electronic bioimpedance measuring instru-
ments, and electronic sphygmomanometers were cali-
brated before each study,and no re-calibrationwas
needed during the duration of different studies. A fasting
venous blood sample was used to measure glucose levels
HbA1c and serum creatinine levels and urine sample to
measure albuminuria and creatinuria.20 Glucose levels
were measured using hexokinase/kinetic methods,
HbA1c using high-performance liquid chromatography,
serum creatinine using the rate-blanked and compen-
sated kinetic Jaffe method, traceable to isotope dilu-
tion mass spectrometry and albuminuria using immune
turbidmetric method.20 Samples from UDAY, ICMR-CHD
and samples from CARRS from Delhi were analysed a
Public Health Foundation of India (PHFI) laboratory
and samples from CARRS from Chennai were analyse
copyright.
on April 9, 2020 at India:BMJ-PG Sponsored. Protected byhttp://bmjopen.bmj.com/BMJ Open: first published as 10.1136/bmjopen-2018-023353 on 7 March 2019. Downloaded from
Open access
strenuous work, climatic conditions, agrochemical use,
heavy metal exposure and infections have been suggested
as risk factors.1 12–15
Data on CKDu from India are scarce. The recent report
of verbal autopsy data from India suggests CKD of all
causes is a growing problem. However, it does not provide
accurate population-based data on CKDu.16 17 Existing
reports indicate that CKDu may be common but it is diffi-
cult to be definite about this because of the absence of
population-based studies using standardised and compa-
rable methods. Data from the Indian CKD Registry, a
hospital based registry of incident cases of CKD between
2006 and 2010, found that CKDu was the second most
common form of CKD after diabetic nephropathy.10
However, this is restricted to referred cases and there-
fore may not be representative of the general population.
There are also sporadic reports of high numbers of CKDu
casesamong agriculturalcommunitiesof the South
Eastern Indian states of Andhra Pradesh and Odisha
(reviewedby Chatterejee18 and Ganguli19
). However,
population-based data have not been reported for India.
We conducted a secondaryanalysis of represen-
tative sample surveysconducted in India between
2010 and 2014. Given the absence of a clear case defini-
tion for CKDu it is necessary to make a presumptive diag-
nosis based on measures/estimates of GFR in the absence
of known risk factors for kidney disease. The overall aim
of the current study was to use a methodology which is
comparable with previous studies elsewhere in the world
(particularly in Central America) to assess the extent to
which reduced kidney function is a problem in India, and
which areas and subpopulations are most affected. We
therefore: (1) assessed the distribution eGFR and preva-
lence of eGFR below 60 mL/min per 1.73 m2 (eGFR <60)
in Indian populations restricted to those without known
risk factors for CKD, i.e. diabetes, hypertension or heavy
proteinuria; (2) compared these outcomes in North and
South India and in urban and rural populations; and (3)
identified the risk factors associated with these outcomes.
MethODs
study population
We used cross-sectional data from three population-based
studies conducted in India: the ‘Centre for Cardiometa-
bolic Risk Reduction in South Asia’ cohort study (CARRS
study),20 the ‘Implementing a comprehensive diabetes
preventionand managementprogram’ study (UDAY
study)21 and the ‘Prevalence of Coronary Heart Disease
repeat survey’ study funded by the Indian Council of
Medical Research (ICMR-CHD study).22 Details on study
design and selection of participants from the CARRS,
UDAY and ICMR-CHD studies have been previously
described20–22and are summarised in table 1.
For the current analyses, we excluded participants with
missing information on serum creatinine, as this vari-
able was necessary to estimate eGFR. As the focus of our
study was CKDu, we excluded participants with known
risk factors for CKD (ie, diabetes and hypertension) o
evidence of primary glomerular disease (as assessed
heavy proteinuria) or with missing information for these
risk factors. We also excluded participants with missin
information on basic covariables(education) for all
the analyses conducted. A study flowchart is presente
We classified participants as having: diabetes, if plasm
fasting glucose was≥126 mg/dL or glycated haemoglobin
A1c (HbA1c) was≥6.5% or self-reported diabetes; hyper-
tension, if systolic blood pressure was≥140 mm Hg or
diastolic blood pressure was≥90 mm Hg or self-reported
hypertension; and heavy proteinuria, if the albumin:cre-
atinine ratio (ACR) in urine was≥300 mg/g. We used the
CKD-EPI equation to estimate GFR.23
Data collection and laboratory analyses
Data collection was conducted between October 2010
and December 2014. All three studies used a standardised
questionnaire to collect data on age, sex, completed year
of education (0,≤5, >5–≤10, >10), alcohol intake (ever,
never) and dietary habits (vegetarian yes, no). Weigh
height and body composition were measured using stadi-
ometers (SECA 214 in the three studies) and electronic
bioimpedance measuring instruments (Tanita BC 418 in
CARRS and ICMR-CHD studies, and Tanita BC 601 in
UDAY study). Body mass index (BMI, kg/m2) was calcu-
lated and categorised (≤18.5: underweight; >18.5–≤25:
normal weight; >25–≤30: overweight;>30: obese) and fat
free mass was derived from bioelectric impedance anal-
ysis. In CARRS and ICMR-CHD studies, fat-free mass
(kg) was directly measured as previously described,24
whereas in UDAY study, fat free mass was estimated from
the percentage of total body fat. To estimate fat-free
mass from the percentage of body fat, we calculated the
amount of total body fat by multiplying the percentage
of body fat by the weight of the participant, and fro
that value we estimated the amount of fat-free mass
subtracting the weight of total body fat from the tota
weight of the participant. Blood pressure was measured
using electronic sphygmomanometers (OMRON (HEM-
7080) in CARRS and ICMR-CHD studies, and OMRON
(HEM 7200) in UDAY study), as previously reported.20 25
Stadiometers, electronic bioimpedance measuring instru-
ments, and electronic sphygmomanometers were cali-
brated before each study,and no re-calibrationwas
needed during the duration of different studies. A fasting
venous blood sample was used to measure glucose levels
HbA1c and serum creatinine levels and urine sample to
measure albuminuria and creatinuria.20 Glucose levels
were measured using hexokinase/kinetic methods,
HbA1c using high-performance liquid chromatography,
serum creatinine using the rate-blanked and compen-
sated kinetic Jaffe method, traceable to isotope dilu-
tion mass spectrometry and albuminuria using immune
turbidmetric method.20 Samples from UDAY, ICMR-CHD
and samples from CARRS from Delhi were analysed a
Public Health Foundation of India (PHFI) laboratory
and samples from CARRS from Chennai were analyse
copyright.
on April 9, 2020 at India:BMJ-PG Sponsored. Protected byhttp://bmjopen.bmj.com/BMJ Open: first published as 10.1136/bmjopen-2018-023353 on 7 March 2019. Downloaded from
3O’Callaghan-Gordo C, et al. BMJ Open 2019;9:e023353. doi:10.1136/bmjopen-2018-023353
Open access
Table 1 Design and methods of the three studies included in the current analysis
CARRS UDAY ICMR-CHD
Latitude (north/
south)
North South North South North
Residence (urban/
rural)
Urban Urban Rural Urban Rural Urban Rural
District (and state)Delhi (National
Capital Territory
of Delhi)
Chennai (state of
Tamil Nadu)
Sonipat (state of Haryana) Vishakhapatnam (state of Andhra
Pradesh)
Delhi (National
Capital Territory
of Delhi)
Faridabad (state
of Haryana)
Household
sampling
Multistage cluster random (wards—
census enumeration blocks—
households)
Multistage cluster random (census enumeration blocks (urban) or villages
(rural)—households)
Multistage
cluster random
(wards—census
enumeration
blocks—
households)
Simple cluster
random (based
on health and
demographic
surveillance
system)
Individual
sampling
One man and one woman from
each household (selected by Kish
method43) *
One man and one woman from each household (selected by Kish
method43) *
All adults
Age groups
included
≥20 ≥30 ≥30
Exclusion criteriaPregnant, bedridden and participants who were unable to comprehend the questionnaires due cognitive deficiencies were excluded
Study period October 2010–November 2011 July 2014–December 2014 August 2010–January 2012
Laboratory† PHFI MDRF PHFI PHFI
* In households where only eligible men or only eligible women were present, we selected just one adult.
† Study laboratories participated in RIQAS for clinical chemistry and HbA1c during the entire study periods.
CARRS, Centre for Cardiometabolic Risk Reduction in South Asia; HbA1c, glycated haemoglobin A1c; ICMR-CHD, Indian Council of Medical Research-Coronary Heart Disease; MDRF,
Madras Diabetes Research Foundation; PHFI, Public Health Foundation of India; RIQAS, Randox International Quality Assurance Scheme.
copyright.
on April 9, 2020 at India:BMJ-PG Sponsored. Protected byhttp://bmjopen.bmj.com/BMJ Open: first published as 10.1136/bmjopen-2018-023353 on 7 March 2019. Downloaded from
⊘ This is a preview!⊘
Do you want full access?
Subscribe today to unlock all pages.
Trusted by 1+ million students worldwide
4 O’Callaghan-Gordo C, et al. BMJ Open 2019;9:e023353. doi:10.1136/bmjopen-
Open access
at Madras Diabetes Research Foundation (MDRF) labo-
ratory. Both PHFI and MDRF laboratories used the same
methodologies and protocols to analyse the samples and
participated in Randox International Quality Assurance
Scheme for clinical chemistry and HbA1c during the
entire study periods. Data from the three studies were
homogenised and merged in a single data set.
statistical analyses
We reported mean eGFR and prevalence of eGFR <60
according to different characteristics of the study popu-
lations. UDAY and CARRS studies did not involve fully
random population samples (since sampling was based
on households, with one participant per household)
and the proportions of study participants with particular
outcomes (eg, eGFR <60), will not be exactly the same
(but very similar) to what would have been obtained with
genuine random population samples; thus in this paper
we refer to the prevalence in the study participants, not
overall population prevalence estimates. We used linear
regression models to estimate the associations between
potential risk factors and eGFR and logistic regression
models to estimate the associations between potential
risk factors and eGFR <60. We also repeated the analyses
separately for males and females. Variables associated
with eGFR in the basic analyses (adjusted for age and
sex) were considered for the multiple regression analysis.
In the final multiple regression model, we included all
variables that were of a priori interest and/or had shown
independent associations with eGFR. We then checked
for multicollinearity for each variable in the multiple
regression analyses in comparison with the basic anal-
yses.26 Six per cent of participants had missing values
for basic co-variables (ie, education) and were excluded
from the analysis; 5% and 9% of participants had missing
values for BMI and for fat-free mass, respectively. These
participants were included in the main analysis, but we
excluded them to compare models non-adjusted and
adjusted for these variables. We calculated prevalence
ratios of eGFR <60 for rural versus urban areas in different
age groups. Urban areas were defined as ‘all places with
a municipality, corporation, cantonment board or noti-
fied town area committee, etc., and all other places which
satisfied the following criteria: a minimum population of
5,000; at least 75 per cent of the male main working popu-
lation engaged in non-agricultural pursuits; and a density
of population of at least 400 persons per km2, according
to the 2011 Census of India definition.27 Finally, we esti-
mated potential interactionsbetween urban (versus
rural) residence and latitude (Northern India (ie, states
of Delhi and Haryana) versus Southern India (states of
Tamil Nadu and Andhra Pradesh). Classification of lati-
tude was done in concordance with the classification of
major geographical areas on India defined by the ICMR.28
We conducted all analyses using Stata V.14 (StataCorp).
Patient and public involvement
Patients were not involved in the design of this analysis.
results
Characteristics of study participants
A total of 12 500 people were eligible for the current anal-
yses (figure 1). Table 2 summarises the sociodemographic
and anthropometric characteristics of the 12 500 stud
participants included in this analysis (the same informa-
tion including participants with known risk factors for
CKD (n=24 774) in online supplementary material table
S1). The mean (standard deviation (±SD)) age of partic-
ipants was 41.5±11.6 years. 88% (4805/5434) of the male
population was formally employed; 76% (5346/7066) of
women worked on house duties (ie, housewives). The
mean BMI was 24±5.0 kg/m2 and mean fat free mass
was 42±15 kg/m2. The mean fasting plasma glucose was
91.9±12.3 mg/dL and the mean HbA1c was 5.5%±0.4%.
The mean systolic and diastolic blood pressures were
114±12 mmHg and 74±9 mmHg, respectively.The
median (IQR) ACR was 2.4 (4.3) mg/g (after exclusion
of those with ACR >300 mg/g, n=1208).
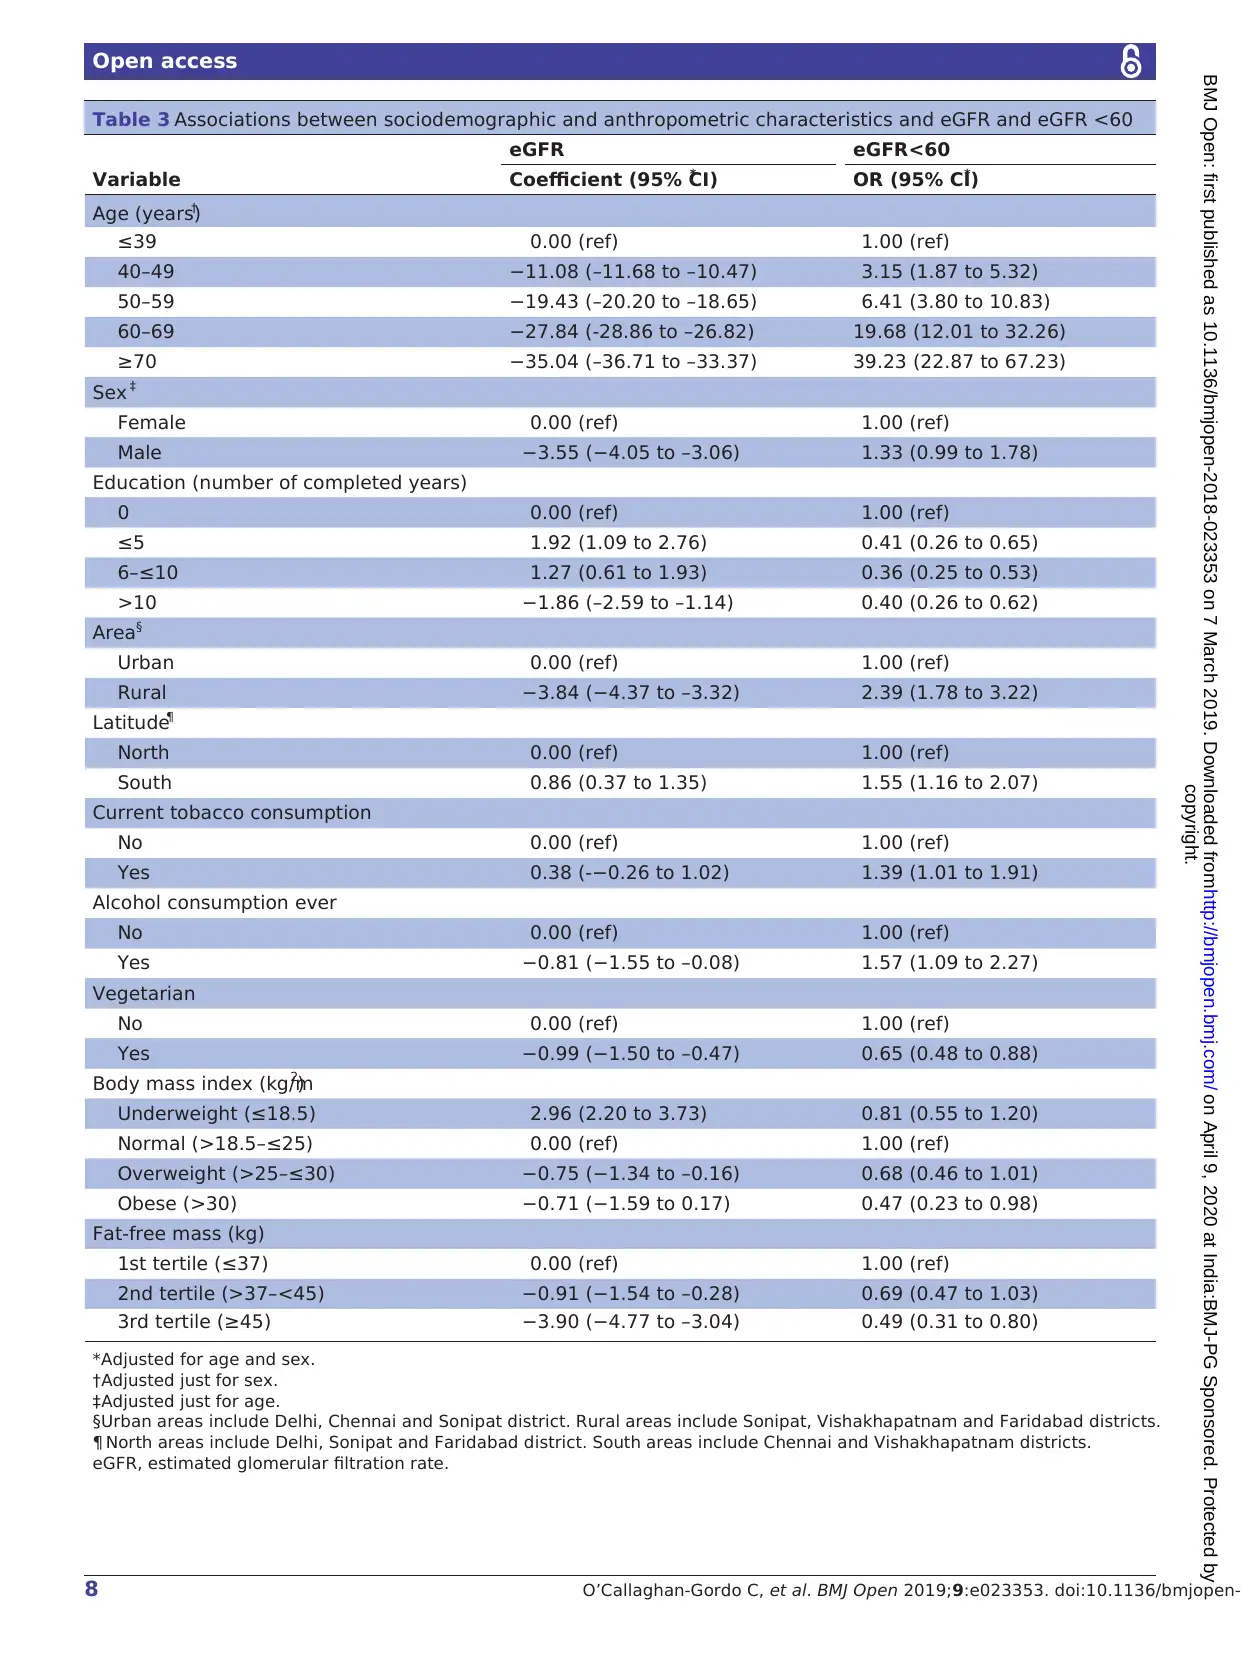
Mean eGFr and prevalence of eGFr <60
The mean eGFR was 105.0±17.8 mL/min per 1.73 m2.
The mean eGFR was lower at increasing ages, in males, in
inhabitants from rural areas and in those from Northern
India, in participants with no formal education, and in
participants who reported tobacco consumption, alcohol
intake and being vegetarian(table 2). We observed
differences in mean eGFR depending on the area, being
104.5±17.6 in urban areas of Northern India, 100.3±16.2
in rural areas of Northern India, 110.9±15.7 in urban
areas of Southern India and 97.4±19.8 in the rural area
of Southern India.
The prevalence of eGFR <60 among the study popu
lation was 1.6% (95% CI 1.4% to 1.9%). Seventeen p
cent (95% CI 16% to 17%) of study participants had
eGFR ≥60–<90 mL/min per 1.73 m2 and 82% (95% CI
81% to 82%) had eGFR≥90 mL/min per 1.73 m2. The
prevalences of different categories of eGFR differed b
formal education, tobacco consumption, alcohol intake
and vegetarianism (table 2). Also, we observed marke
differences in the prevalence of eGFR <60 depending on
the area, being 1.4% (95% CI 1.1% to 1.8%) in urba
areas of Northern India, 1.9 (95% CI 1.4 to 2.6) in rural
areas of Northern India, 0.43% (95% CI 0.03% to 0.07%)
in urban areas of Southern India and 4.8% (95% CI
3.9% to 5.9%) in the rural area of Southern India. The
prevalence ratio of eGFR <60 for rural versus urban resi-
dence was higher in participants younger than 50 years
(prevalence ratio in age group≤39=5.5, and prevalence
ratio in age group 40–49=5.8) than in older participants
(figure 2).
risk factors for lower eGFr and eGFr <60
As expected, age was an important risk factor for reduced
eGFR: eGFR was 9.30 mL/min per 1.73 m2 (95% CI −9.51
to –9.09, model adjusted for sex) lower for each add
tional 10 years of age. Additionally, being male, living in
a rural setting and consuming alcohol were associate
copyright.
on April 9, 2020 at India:BMJ-PG Sponsored. Protected byhttp://bmjopen.bmj.com/BMJ Open: first published as 10.1136/bmjopen-2018-023353 on 7 March 2019. Downloaded from
Open access
at Madras Diabetes Research Foundation (MDRF) labo-
ratory. Both PHFI and MDRF laboratories used the same
methodologies and protocols to analyse the samples and
participated in Randox International Quality Assurance
Scheme for clinical chemistry and HbA1c during the
entire study periods. Data from the three studies were
homogenised and merged in a single data set.
statistical analyses
We reported mean eGFR and prevalence of eGFR <60
according to different characteristics of the study popu-
lations. UDAY and CARRS studies did not involve fully
random population samples (since sampling was based
on households, with one participant per household)
and the proportions of study participants with particular
outcomes (eg, eGFR <60), will not be exactly the same
(but very similar) to what would have been obtained with
genuine random population samples; thus in this paper
we refer to the prevalence in the study participants, not
overall population prevalence estimates. We used linear
regression models to estimate the associations between
potential risk factors and eGFR and logistic regression
models to estimate the associations between potential
risk factors and eGFR <60. We also repeated the analyses
separately for males and females. Variables associated
with eGFR in the basic analyses (adjusted for age and
sex) were considered for the multiple regression analysis.
In the final multiple regression model, we included all
variables that were of a priori interest and/or had shown
independent associations with eGFR. We then checked
for multicollinearity for each variable in the multiple
regression analyses in comparison with the basic anal-
yses.26 Six per cent of participants had missing values
for basic co-variables (ie, education) and were excluded
from the analysis; 5% and 9% of participants had missing
values for BMI and for fat-free mass, respectively. These
participants were included in the main analysis, but we
excluded them to compare models non-adjusted and
adjusted for these variables. We calculated prevalence
ratios of eGFR <60 for rural versus urban areas in different
age groups. Urban areas were defined as ‘all places with
a municipality, corporation, cantonment board or noti-
fied town area committee, etc., and all other places which
satisfied the following criteria: a minimum population of
5,000; at least 75 per cent of the male main working popu-
lation engaged in non-agricultural pursuits; and a density
of population of at least 400 persons per km2, according
to the 2011 Census of India definition.27 Finally, we esti-
mated potential interactionsbetween urban (versus
rural) residence and latitude (Northern India (ie, states
of Delhi and Haryana) versus Southern India (states of
Tamil Nadu and Andhra Pradesh). Classification of lati-
tude was done in concordance with the classification of
major geographical areas on India defined by the ICMR.28
We conducted all analyses using Stata V.14 (StataCorp).
Patient and public involvement
Patients were not involved in the design of this analysis.
results
Characteristics of study participants
A total of 12 500 people were eligible for the current anal-
yses (figure 1). Table 2 summarises the sociodemographic
and anthropometric characteristics of the 12 500 stud
participants included in this analysis (the same informa-
tion including participants with known risk factors for
CKD (n=24 774) in online supplementary material table
S1). The mean (standard deviation (±SD)) age of partic-
ipants was 41.5±11.6 years. 88% (4805/5434) of the male
population was formally employed; 76% (5346/7066) of
women worked on house duties (ie, housewives). The
mean BMI was 24±5.0 kg/m2 and mean fat free mass
was 42±15 kg/m2. The mean fasting plasma glucose was
91.9±12.3 mg/dL and the mean HbA1c was 5.5%±0.4%.
The mean systolic and diastolic blood pressures were
114±12 mmHg and 74±9 mmHg, respectively.The
median (IQR) ACR was 2.4 (4.3) mg/g (after exclusion
of those with ACR >300 mg/g, n=1208).
Mean eGFr and prevalence of eGFr <60
The mean eGFR was 105.0±17.8 mL/min per 1.73 m2.
The mean eGFR was lower at increasing ages, in males, in
inhabitants from rural areas and in those from Northern
India, in participants with no formal education, and in
participants who reported tobacco consumption, alcohol
intake and being vegetarian(table 2). We observed
differences in mean eGFR depending on the area, being
104.5±17.6 in urban areas of Northern India, 100.3±16.2
in rural areas of Northern India, 110.9±15.7 in urban
areas of Southern India and 97.4±19.8 in the rural area
of Southern India.
The prevalence of eGFR <60 among the study popu
lation was 1.6% (95% CI 1.4% to 1.9%). Seventeen p
cent (95% CI 16% to 17%) of study participants had
eGFR ≥60–<90 mL/min per 1.73 m2 and 82% (95% CI
81% to 82%) had eGFR≥90 mL/min per 1.73 m2. The
prevalences of different categories of eGFR differed b
formal education, tobacco consumption, alcohol intake
and vegetarianism (table 2). Also, we observed marke
differences in the prevalence of eGFR <60 depending on
the area, being 1.4% (95% CI 1.1% to 1.8%) in urba
areas of Northern India, 1.9 (95% CI 1.4 to 2.6) in rural
areas of Northern India, 0.43% (95% CI 0.03% to 0.07%)
in urban areas of Southern India and 4.8% (95% CI
3.9% to 5.9%) in the rural area of Southern India. The
prevalence ratio of eGFR <60 for rural versus urban resi-
dence was higher in participants younger than 50 years
(prevalence ratio in age group≤39=5.5, and prevalence
ratio in age group 40–49=5.8) than in older participants
(figure 2).
risk factors for lower eGFr and eGFr <60
As expected, age was an important risk factor for reduced
eGFR: eGFR was 9.30 mL/min per 1.73 m2 (95% CI −9.51
to –9.09, model adjusted for sex) lower for each add
tional 10 years of age. Additionally, being male, living in
a rural setting and consuming alcohol were associate
copyright.
on April 9, 2020 at India:BMJ-PG Sponsored. Protected byhttp://bmjopen.bmj.com/BMJ Open: first published as 10.1136/bmjopen-2018-023353 on 7 March 2019. Downloaded from
Paraphrase This Document
Need a fresh take? Get an instant paraphrase of this document with our AI Paraphraser
5O’Callaghan-Gordo C, et al. BMJ Open 2019;9:e023353. doi:10.1136/bmjopen-2018-023353
Open access
with decreased mean eGFR (table 3). Similarly, the odds
of eGFR <60 also increased with age (OR per 10 years,
adjustedfor sex (95% CI)=2.34(2.12 to 2.59)) and
being male, living in a rural setting, living in Southern
India and consuming alcohol were also associated with
eGFR <60 (table 3). In general, risk factors for decreased
mean eGFR and for eGFR <60 were similar for men and
women (online supplementary material table S2), but few
differences were observed. Regarding mean eGFR, living
in Southern India was associated with decreased mean
eGFR in men and with increased mean eGFR in women;
tobacco consumption was associated with increased mean
eGFR in men and with decreased mean eGFR in women;
vegetarianism was associated with decreased mean eGFR
in women but not in men; and being overweight was asso-
ciated with decreased mean eGFR but in men but not in
women. Regarding risk of eGFR <60, living in Southern
India was associated with increased risk of eGFR <60 in
men but not in women.
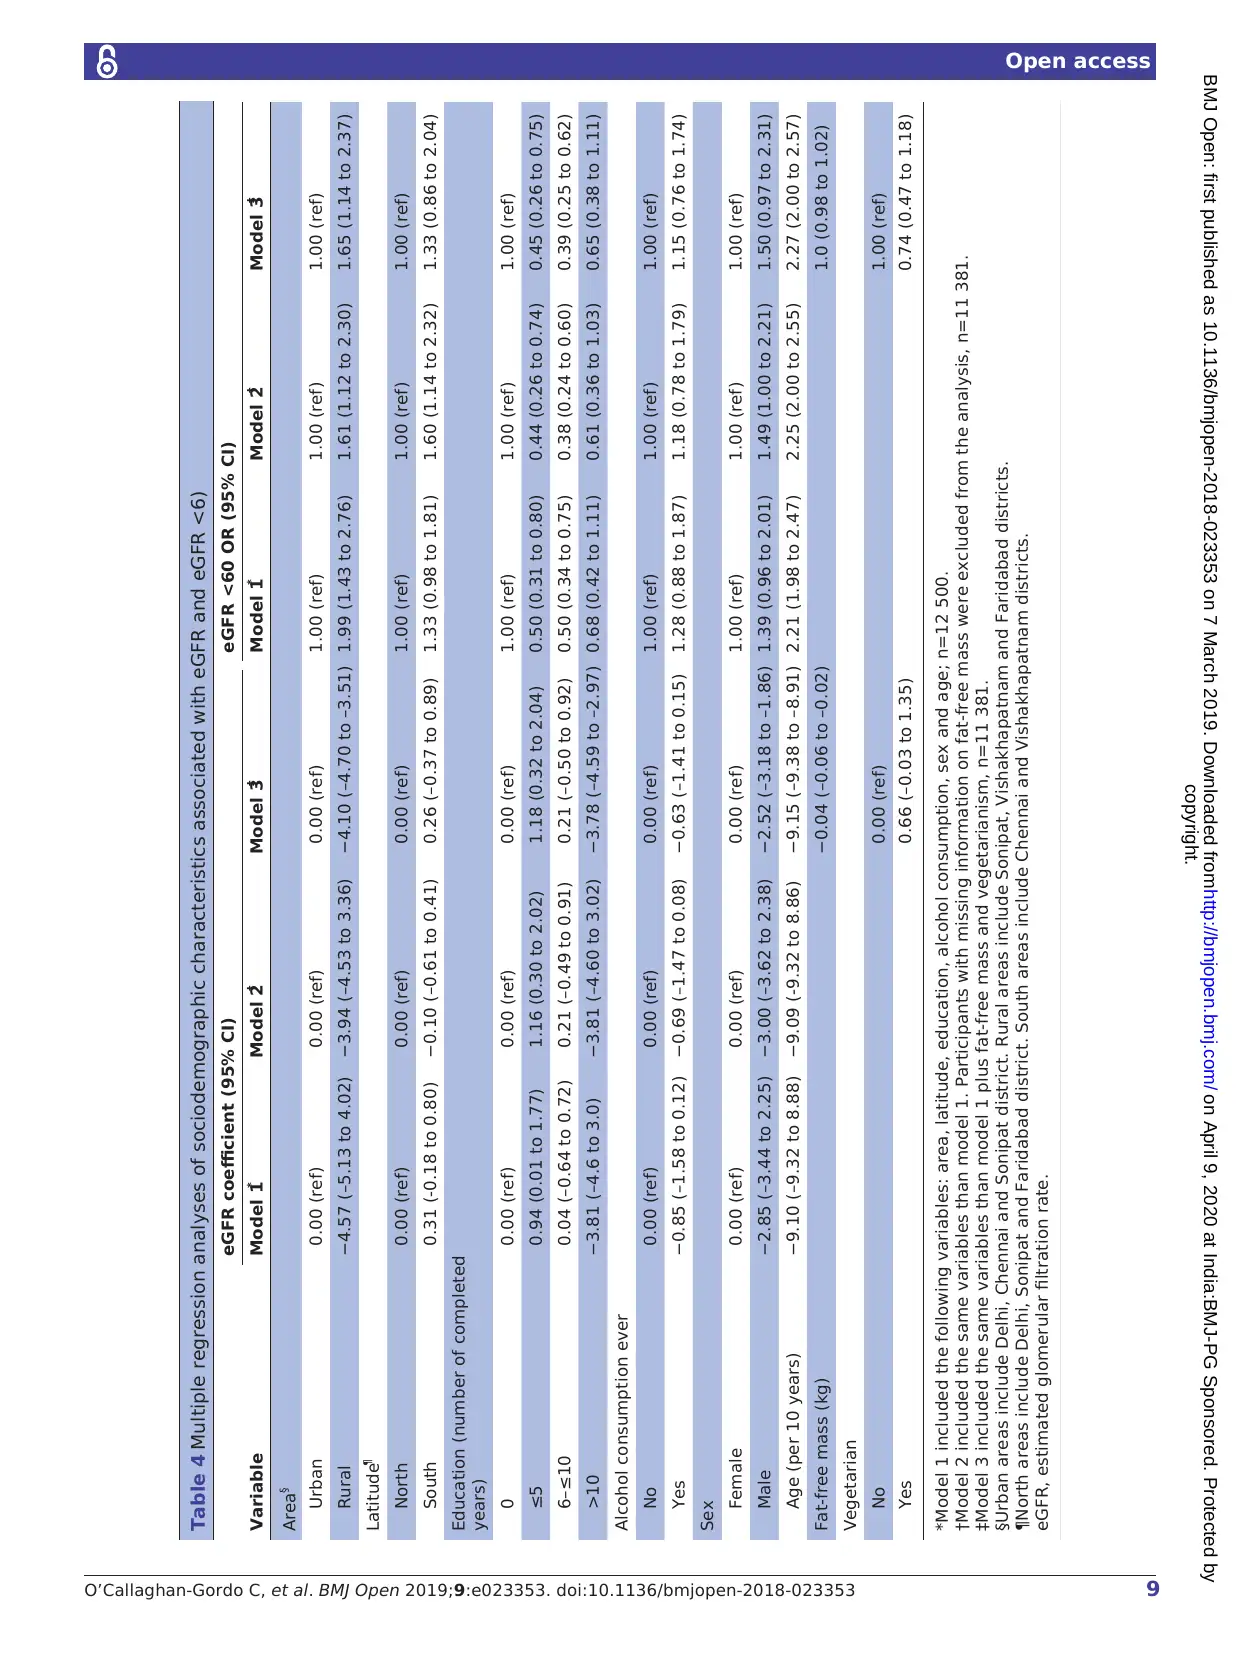
In the multiple regression analyses, decreased mean
eGFR remained associated with older age, being male
living in a rural setting and alcohol consumption (table 4).
Risk of eGFR <60 remained associated with older age
being male and living in a rural setting, and having no
formal education (table 4). We adjusted all the multiple
regression models for fat-free mass and vegetarianism to
assess the possibility that differences observed betwe
urban and rural participants were due to differences in
diet and/or body composition. These adjustments had
little effect on the results (table 4).
We observed an interaction between the effects of
latitude (North/South) and urban/rural residence in
associationwith reduced eGFR (p value for interac-
tion <0.001). The mean eGFR was lower in rural settings
in both Northern and Southern India (controlling for
age, sex, education and alcohol intake). However, this
decrease was much more marked in Southern India. In
Northern India, rural residence, formal education (and
Figure 1 Study flow chart. ACR, albumin:creatinine ratio; CARRS, Centre for Cardiometabolic Risk Reduction in South Asia;
eGFR, estimated glomerular filtration rate; ICMR-CHD, Indian Council of Medical Research Coronary Heart Disease.
copyright.
on April 9, 2020 at India:BMJ-PG Sponsored. Protected byhttp://bmjopen.bmj.com/BMJ Open: first published as 10.1136/bmjopen-2018-023353 on 7 March 2019. Downloaded from
Open access
with decreased mean eGFR (table 3). Similarly, the odds
of eGFR <60 also increased with age (OR per 10 years,
adjustedfor sex (95% CI)=2.34(2.12 to 2.59)) and
being male, living in a rural setting, living in Southern
India and consuming alcohol were also associated with
eGFR <60 (table 3). In general, risk factors for decreased
mean eGFR and for eGFR <60 were similar for men and
women (online supplementary material table S2), but few
differences were observed. Regarding mean eGFR, living
in Southern India was associated with decreased mean
eGFR in men and with increased mean eGFR in women;
tobacco consumption was associated with increased mean
eGFR in men and with decreased mean eGFR in women;
vegetarianism was associated with decreased mean eGFR
in women but not in men; and being overweight was asso-
ciated with decreased mean eGFR but in men but not in
women. Regarding risk of eGFR <60, living in Southern
India was associated with increased risk of eGFR <60 in
men but not in women.
In the multiple regression analyses, decreased mean
eGFR remained associated with older age, being male
living in a rural setting and alcohol consumption (table 4).
Risk of eGFR <60 remained associated with older age
being male and living in a rural setting, and having no
formal education (table 4). We adjusted all the multiple
regression models for fat-free mass and vegetarianism to
assess the possibility that differences observed betwe
urban and rural participants were due to differences in
diet and/or body composition. These adjustments had
little effect on the results (table 4).
We observed an interaction between the effects of
latitude (North/South) and urban/rural residence in
associationwith reduced eGFR (p value for interac-
tion <0.001). The mean eGFR was lower in rural settings
in both Northern and Southern India (controlling for
age, sex, education and alcohol intake). However, this
decrease was much more marked in Southern India. In
Northern India, rural residence, formal education (and
Figure 1 Study flow chart. ACR, albumin:creatinine ratio; CARRS, Centre for Cardiometabolic Risk Reduction in South Asia;
eGFR, estimated glomerular filtration rate; ICMR-CHD, Indian Council of Medical Research Coronary Heart Disease.
copyright.
on April 9, 2020 at India:BMJ-PG Sponsored. Protected byhttp://bmjopen.bmj.com/BMJ Open: first published as 10.1136/bmjopen-2018-023353 on 7 March 2019. Downloaded from
6 O’Callaghan-Gordo C, et al. BMJ Open 2019;9:e023353. doi:10.1136/bmjopen-
Open access
Table 2 Sociodemographic and anthropometric characteristics of study participants (population without diabetes,
hypertension or heavy proteinuria)
Variable n (%)* n=12 500
eGFR eGFR categories, n (%)†
mean (SD) ≥90 90–60 <60
Sociodemographic
Age (years)
≤39 6121 (49) 113.8 (14.6) 5656 (92) 443 (7) 22 (0)
40–49 3476 (28) 102.5 (14.2) 2864 (82) 572 (16) 40 (1)
50–59 1706 (14) 93.9 (14.3) 1163 (68) 503 (29) 40 (2)
60–69 893 (7) 85.3 (16.2) 463 (52) 368 (41) 62 (7)
≥70 304 (2) 77.5 (15.1) 62 (20) 201 (66) 41 (13)
Sex
Female 7066 (57) 107.9 (17.1) 6039 (85) 945 (13) 82 (1)
Male 5434 (43) 101.3 (17.9) 4169 (77) 1142 (21) 123 (2)
Education (number completed years)
0 2820 (23) 100.7 (19.0) 2165 (77) 551 (20) 104 (4)
≤5 1709 (14) 105.9 (17.3) 1412 (83) 273 (16) 24 (1)
6–≤10 4817 (39) 107.2 (16.8) 4095 (85) 675 (14) 47 (1)
>10 3154 (25) 105.0 (17.5) 2536 (80) 588 (19) 30 (1)
Area‡
Urban 8494 (68) 107.8 (16.1) 7247 (85) 1171 (14) 76 (1)
Rural 4006 (32) 99.0 (18.0) 2961 (74) 916 (23) 129 (3)
Latitude§
North 6263 (50) 103.0 (17.2) 4967 (79) 1197 (19) 99 (2)
South 6237 (50) 107.0 (18.1) 5241 (84) 890 (14) 106 (2)
Life-style factors
Current tobacco consumption
No 9357 (75) 106.8 (17.3) 7836 (84) 1406 (15) 115 (1)
Yes 3143 (25) 99.8 (18.1) 2372 (75) 681 (22) 90 (3)
Alcohol consumption ever
No 10 094 (81) 105.9 (17.4) 8362 (83) 1589 (16) 143 (1)
Yes 2406 (19) 101.1 (18.5) 1846 (77) 498 (21) 62 (3)
Vegetarian
No 7972 (64) 107.0 (18.0) 6690 (84) 1154 (14) 128 (2)
Yes 4528 (36) 101.6 (16.6) 3518 (78) 933 (21) 77 (2)
Biological factors
Body mass index (kg/m2)
Underweight (≤18.5) 5879 (47) 104.2 (17.9) 4734 (81) 1029 (18) 116 (2)
Normal (>18.5–≤25) 1576 (13) 104.7 (19.3) 1283 (81) 257 (16) 36 (2)
Overweight (>25–≤30) 3313 (27) 105.0 (16.9) 2710 (82) 568 (17) 35 (1)
Obese (>30) 1150 (9) 105.5 (16.4) 948 (82) 194 (17) 8 (1)
Missing data 582 (5) 533 (92) 39 (7) 10 (2)
Fat free mass (kg)
First tertile (≤37) 3746 (30) 106.6 (18.1) 3146 (84) 532 (14) 68 (2)
Second tertile (>37 -<45) 3801 (30) 105.9 (17.2) 3145 (83) 601 (16) 55 (1)
Third tertile (≥45) 3834 (31) 102.1 (17.0) 2981 (78) 801 (21) 52 (1)
Missing data 1119 (9) 936 (84) 153 (14) 30 (3)
* Percentages in columns.
† Percentages in rows.
‡ Urban areas include Delhi, Chennai and Sonipat district. Rural areas include Sonipat, Vishakhapatnam and Faridabad districts.
§ North areas include Delhi, Sonipat and Faridabad district. South areas include Chennai and Vishakhapatnam districts.
eGFR, estimated glomerular filtration rate.
copyright.
on April 9, 2020 at India:BMJ-PG Sponsored. Protected byhttp://bmjopen.bmj.com/BMJ Open: first published as 10.1136/bmjopen-2018-023353 on 7 March 2019. Downloaded from
⊘ This is a preview!⊘
Do you want full access?
Subscribe today to unlock all pages.
Trusted by 1+ million students worldwide
7O’Callaghan-Gordo C, et al. BMJ Open 2019;9:e023353. doi:10.1136/bmjopen-2018-023353
Open access
duration) and age were the only other risk factor associ-
ated with reduced eGFR. In Southern India, being male
was also a risk factor for reduced eGFR, whereas formal
education was only a risk factor for reduced eGFR among
those with more than 10 years of schooling (table 5). We
also observed an interaction between the effects of lati-
tude (North/South) and urban/rural residence in asso-
ciation with eGFR <60 (p value likelihood-ratio test for
interaction <0.001). In Northern India, eGFR <60 was not
associated with urban/rural residence, and older age was
the only factor associated with eGFR <60. In Southern
India, rural residence was the strongest risk factor for
eGFR <60 but older age and lower years of formal educa-
tion also increased the risk of eGFR <60 (table 5).
sensitivity analyses
We performed a sensitivity analysis including those with
ACR >300 (but without hypertension or diabetes, n=33) as
we were concerned that those with CKDu might develop
proteinuria at more advancedCKD stages.However,
this did not alter the mean eGFR (mean eGFR among
the overall study population=105.0±17.8, mean eGFR in
this sensitivity analysis=105.0±17.8), nor the estimated
prevalence of eGFR <60 (prevalence among the overall
study population=1.6%; prevalence in this sensitivity anal-
ysis=1.7%). The findings on risk factors were also similar
to the findings from the primary analyses (online supple-
mentary material table S3).
Given concerns about potentially different thresholds
to define diabetes and high blood pressure in different
ethnic groups,29 30we performed a further sensitivity anal-
ysis including fasting plasma glucose, HbA1c and systolic
blood pressure in the multivariate model (even though
there is evidence for both causation and reverse causation
between these factors and CKD31
). Systolic blood pressure
and fasting plasma glucose were associated with reduced
eGFR in this non diabetic population, but inclusion of
these variables did not alter the coefficients for the asso-
ciations with other risk factors observed in the primary
analysis (online supplementary material table S4). HbA1c
was associated with eGFR <60 in this non diabetic popu-
lation but inclusion of this variable did not alter the OR
for other risk factors observed in the primary analysis
(online supplementary material table S4). Therefore,
although the relationship between subclinical diabetes
and impaired kidney function requires further prospec-
tive investigation, there is no evidence that the excess ris
of low eGFR (ie, lower mean eGFR and higher prevalence
of eGFR <60) in rural Southern India is associated with
either impaired fasting glucose or higher blood pressure.
DIsCussIOn
We report the distribution of eGFR in people without
diabetes, hypertension or heavy proteinuria and esti-
mate the prevalence of CKDu in our study population
including participants from urban and rural settings. This
is the first population-based evidence, using standardised
methods, which indicates that CKDu is present in India
and is not confined to Central America and Sri Lanka.
We found that the rural population from Southern
India (Vishakhapatnam district) had the highest risk of
decreased eGFR (lower mean eGFR and higher prev-
alence of eGFR <60). Risk factors of decreased eGFR
were different between Southern and Northern India.
In Southern India, rural residence, older age and being
male were risk factors for both lower mean eGFR an
eGFR <60; education was associated with decreased risk
for eGFR <60 but not with lower mean eGFR. In Northern
India, older age was the only risk factor for both lower
mean eGFR and eGFR <60; rural residence and years of
formal education were associated with lower mean eGFR
but not with eGFR <60. In summary, in Southern India,
older age, being male and rural residence were the main
risk factors for decreased eGFR, whereas in Norther India
older age was the main risk factors for decreased eGFR.
As in Central America, the risk of low eGFR was higher
in rural settings than in urban settings. This is in concor-
dance with a previous study from Hyderabad (India), that
has provided evidence of a higher risk of low eGFR i
a rural population compared with urban-migrant and to
urban population,32 and with various studies from other
LMICs that have provided evidence of clusters of CKDu
among the rural population.2 3 Exposure to some of the
suggested potential risk factors for CKDu such as agricul-
tural work and agrochemical exposure, among others,33
may be greater in rural settings. Such exposures may
also differ between Southern and Northern India, and
potentiallyexplain the differencesobservedbetween
these areas. The associations between urban/rural res
dence and lower mean eGFR was much more marked in
Southern India than in Northern India, and the associ-
ations between urban/rural residence and eGFR <60
was only observed in Southern India. The higher preva-
lence ratio (for eGFR <60) in the working age population
compared with older age groups is consistent with th
hypothesis that deceased in eGFR could be potentiall
explained by occupational exposures. The suggestive sex
differences may also support this hypothesis. However, we
Figure 2 Prevalence ratio of estimated glomerular filtration
rate <60 for rural versus urban residence in different age
groups.
copyright.
on April 9, 2020 at India:BMJ-PG Sponsored. Protected byhttp://bmjopen.bmj.com/BMJ Open: first published as 10.1136/bmjopen-2018-023353 on 7 March 2019. Downloaded from
Paraphrase This Document
Need a fresh take? Get an instant paraphrase of this document with our AI Paraphraser
8 O’Callaghan-Gordo C, et al. BMJ Open 2019;9:e023353. doi:10.1136/bmjopen-
Open access
Table 3 Associations between sociodemographic and anthropometric characteristics and eGFR and eGFR <60
Variable
eGFR eGFR<60
Coefficient (95% CI)* OR (95% CI)*
Age (years)†
≤39 0.00 (ref) 1.00 (ref)
40–49 −11.08 (–11.68 to –10.47) 3.15 (1.87 to 5.32)
50–59 −19.43 (–20.20 to –18.65) 6.41 (3.80 to 10.83)
60–69 −27.84 (-28.86 to –26.82) 19.68 (12.01 to 32.26)
≥70 −35.04 (–36.71 to –33.37) 39.23 (22.87 to 67.23)
Sex ‡
Female 0.00 (ref) 1.00 (ref)
Male −3.55 (−4.05 to –3.06) 1.33 (0.99 to 1.78)
Education (number of completed years)
0 0.00 (ref) 1.00 (ref)
≤5 1.92 (1.09 to 2.76) 0.41 (0.26 to 0.65)
6–≤10 1.27 (0.61 to 1.93) 0.36 (0.25 to 0.53)
>10 −1.86 (–2.59 to –1.14) 0.40 (0.26 to 0.62)
Area§
Urban 0.00 (ref) 1.00 (ref)
Rural −3.84 (−4.37 to –3.32) 2.39 (1.78 to 3.22)
Latitude¶
North 0.00 (ref) 1.00 (ref)
South 0.86 (0.37 to 1.35) 1.55 (1.16 to 2.07)
Current tobacco consumption
No 0.00 (ref) 1.00 (ref)
Yes 0.38 (-−0.26 to 1.02) 1.39 (1.01 to 1.91)
Alcohol consumption ever
No 0.00 (ref) 1.00 (ref)
Yes −0.81 (−1.55 to –0.08) 1.57 (1.09 to 2.27)
Vegetarian
No 0.00 (ref) 1.00 (ref)
Yes −0.99 (−1.50 to –0.47) 0.65 (0.48 to 0.88)
Body mass index (kg/m2)
Underweight (≤18.5) 2.96 (2.20 to 3.73) 0.81 (0.55 to 1.20)
Normal (>18.5–≤25) 0.00 (ref) 1.00 (ref)
Overweight (>25–≤30) −0.75 (−1.34 to –0.16) 0.68 (0.46 to 1.01)
Obese (>30) −0.71 (−1.59 to 0.17) 0.47 (0.23 to 0.98)
Fat-free mass (kg)
1st tertile (≤37) 0.00 (ref) 1.00 (ref)
2nd tertile (>37–<45) −0.91 (−1.54 to –0.28) 0.69 (0.47 to 1.03)
3rd tertile (≥45) −3.90 (−4.77 to –3.04) 0.49 (0.31 to 0.80)
*Adjusted for age and sex.
†Adjusted just for sex.
‡Adjusted just for age.
§Urban areas include Delhi, Chennai and Sonipat district. Rural areas include Sonipat, Vishakhapatnam and Faridabad districts.
¶ North areas include Delhi, Sonipat and Faridabad district. South areas include Chennai and Vishakhapatnam districts.
eGFR, estimated glomerular filtration rate.
copyright.
on April 9, 2020 at India:BMJ-PG Sponsored. Protected byhttp://bmjopen.bmj.com/BMJ Open: first published as 10.1136/bmjopen-2018-023353 on 7 March 2019. Downloaded from
9O’Callaghan-Gordo C, et al. BMJ Open 2019;9:e023353. doi:10.1136/bmjopen-2018-023353
Open access
Table 4 Multiple regression analyses of sociodemographic characteristics associated with eGFR and eGFR <6)
Variable
eGFR coefficient (95% CI) eGFR <60 OR (95% CI)
Model 1* Model 2† Model 3‡ Model 1* Model 2† Model 3‡
Area§
Urban 0.00 (ref) 0.00 (ref) 0.00 (ref) 1.00 (ref) 1.00 (ref) 1.00 (ref)
Rural −4.57 (–5.13 to 4.02) −3.94 (–4.53 to 3.36) −4.10 (–4.70 to –3.51) 1.99 (1.43 to 2.76) 1.61 (1.12 to 2.30) 1.65 (1.14 to 2.37)
Latitude¶
North 0.00 (ref) 0.00 (ref) 0.00 (ref) 1.00 (ref) 1.00 (ref) 1.00 (ref)
South 0.31 (-0.18 to 0.80) −0.10 (–0.61 to 0.41) 0.26 (–0.37 to 0.89) 1.33 (0.98 to 1.81) 1.60 (1.14 to 2.32) 1.33 (0.86 to 2.04)
Education (number of completed
years)
0 0.00 (ref) 0.00 (ref) 0.00 (ref) 1.00 (ref) 1.00 (ref) 1.00 (ref)
≤5 0.94 (0.01 to 1.77) 1.16 (0.30 to 2.02) 1.18 (0.32 to 2.04) 0.50 (0.31 to 0.80) 0.44 (0.26 to 0.74) 0.45 (0.26 to 0.75)
6–≤10 0.04 (–0.64 to 0.72) 0.21 (–0.49 to 0.91) 0.21 (–0.50 to 0.92) 0.50 (0.34 to 0.75) 0.38 (0.24 to 0.60) 0.39 (0.25 to 0.62)
>10 −3.81 (–4.6 to 3.0) −3.81 (–4.60 to 3.02) −3.78 (–4.59 to –2.97) 0.68 (0.42 to 1.11) 0.61 (0.36 to 1.03) 0.65 (0.38 to 1.11)
Alcohol consumption ever
No 0.00 (ref) 0.00 (ref) 0.00 (ref) 1.00 (ref) 1.00 (ref) 1.00 (ref)
Yes −0.85 (–1.58 to 0.12) −0.69 (–1.47 to 0.08) −0.63 (–1.41 to 0.15) 1.28 (0.88 to 1.87) 1.18 (0.78 to 1.79) 1.15 (0.76 to 1.74)
Sex
Female 0.00 (ref) 0.00 (ref) 0.00 (ref) 1.00 (ref) 1.00 (ref) 1.00 (ref)
Male −2.85 (–3.44 to 2.25) −3.00 (–3.62 to 2.38) −2.52 (–3.18 to –1.86) 1.39 (0.96 to 2.01) 1.49 (1.00 to 2.21) 1.50 (0.97 to 2.31)
Age (per 10 years) −9.10 (–9.32 to 8.88) −9.09 (-9.32 to 8.86) −9.15 (–9.38 to –8.91) 2.21 (1.98 to 2.47) 2.25 (2.00 to 2.55) 2.27 (2.00 to 2.57)
Fat-free mass (kg) −0.04 (–0.06 to –0.02) 1.0 (0.98 to 1.02)
Vegetarian
No 0.00 (ref) 1.00 (ref)
Yes 0.66 (–0.03 to 1.35) 0.74 (0.47 to 1.18)
*Model 1 included the following variables: area, latitude, education, alcohol consumption, sex and age; n=12 500.
†Model 2 included the same variables than model 1. Participants with missing information on fat-free mass were excluded from the analysis, n=11 381.
‡Model 3 included the same variables than model 1 plus fat-free mass and vegetarianism, n=11 381.
§Urban areas include Delhi, Chennai and Sonipat district. Rural areas include Sonipat, Vishakhapatnam and Faridabad districts.
¶North areas include Delhi, Sonipat and Faridabad district. South areas include Chennai and Vishakhapatnam districts.
eGFR, estimated glomerular filtration rate.
copyright.
on April 9, 2020 at India:BMJ-PG Sponsored. Protected byhttp://bmjopen.bmj.com/BMJ Open: first published as 10.1136/bmjopen-2018-023353 on 7 March 2019. Downloaded from
⊘ This is a preview!⊘
Do you want full access?
Subscribe today to unlock all pages.
Trusted by 1+ million students worldwide
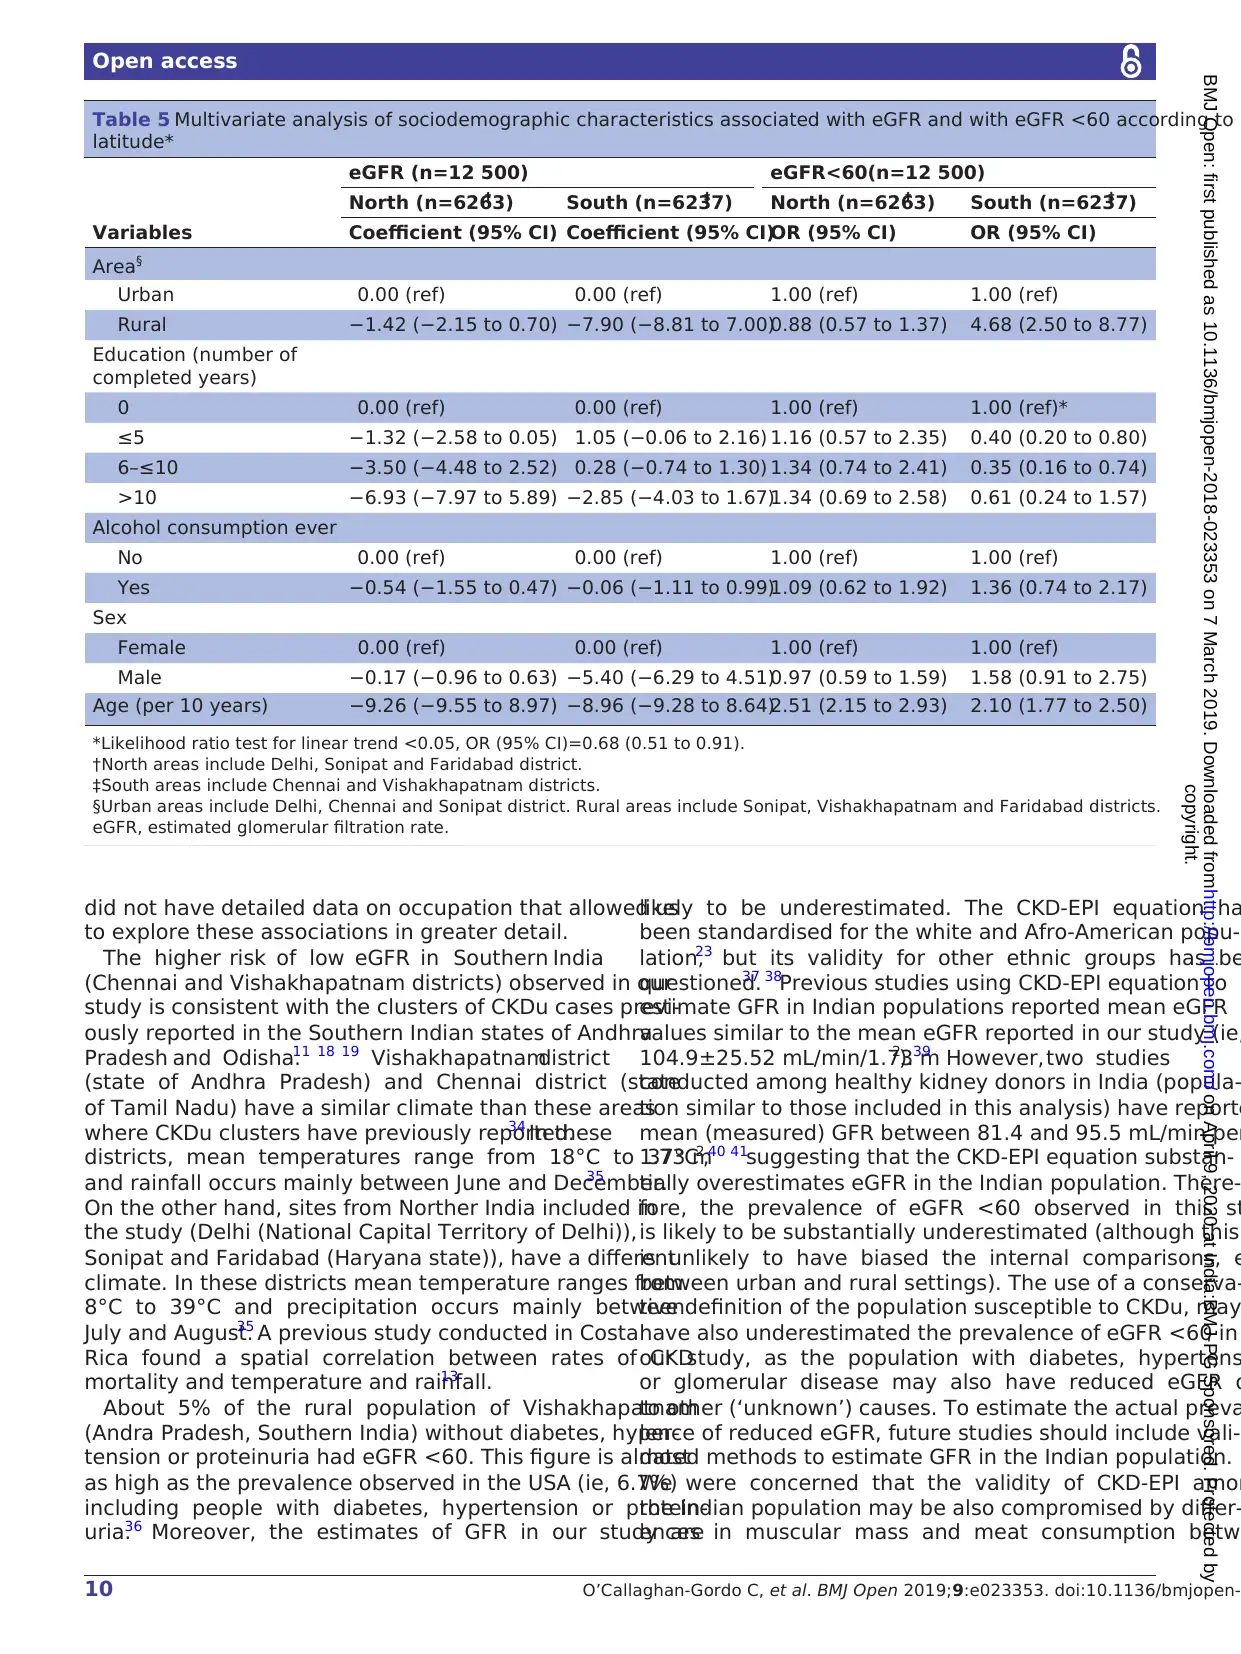
10 O’Callaghan-Gordo C, et al. BMJ Open 2019;9:e023353. doi:10.1136/bmjopen-
Open access
did not have detailed data on occupation that allowed us
to explore these associations in greater detail.
The higher risk of low eGFR in Southern India
(Chennai and Vishakhapatnam districts) observed in our
study is consistent with the clusters of CKDu cases previ-
ously reported in the Southern Indian states of Andhra
Pradesh and Odisha.11 18 19 Vishakhapatnamdistrict
(state of Andhra Pradesh) and Chennai district (state
of Tamil Nadu) have a similar climate than these areas
where CKDu clusters have previously reported.34 In these
districts, mean temperatures range from 18°C to 37°C
and rainfall occurs mainly between June and December.35
On the other hand, sites from Norther India included in
the study (Delhi (National Capital Territory of Delhi)),
Sonipat and Faridabad (Haryana state)), have a different
climate. In these districts mean temperature ranges from
8°C to 39°C and precipitation occurs mainly between
July and August.35 A previous study conducted in Costa
Rica found a spatial correlation between rates of CKD
mortality and temperature and rainfall.13
About 5% of the rural population of Vishakhapatnam
(Andra Pradesh, Southern India) without diabetes, hyper-
tension or proteinuria had eGFR <60. This figure is almost
as high as the prevalence observed in the USA (ie, 6.7%)
including people with diabetes, hypertension or protein-
uria.36 Moreover, the estimates of GFR in our study are
likely to be underestimated. The CKD-EPI equation ha
been standardised for the white and Afro-American popu-
lation,23 but its validity for other ethnic groups has be
questioned.37 38
Previous studies using CKD-EPI equation to
estimate GFR in Indian populations reported mean eGFR
values similar to the mean eGFR reported in our study (ie,
104.9±25.52 mL/min/1.73 m2).39 However, two studies
conducted among healthy kidney donors in India (popula-
tion similar to those included in this analysis) have reporte
mean (measured) GFR between 81.4 and 95.5 mL/min per
1.73 m2,40 41suggesting that the CKD-EPI equation substan-
tially overestimates eGFR in the Indian population. There-
fore, the prevalence of eGFR <60 observed in this st
is likely to be substantially underestimated (although this
is unlikely to have biased the internal comparisons, e
between urban and rural settings). The use of a conserva-
tive definition of the population susceptible to CKDu, may
have also underestimated the prevalence of eGFR <60 in
our study, as the population with diabetes, hypertens
or glomerular disease may also have reduced eGFR d
to other (‘unknown’) causes. To estimate the actual preva
lence of reduced eGFR, future studies should include vali-
dated methods to estimate GFR in the Indian population.
We were concerned that the validity of CKD-EPI amon
the Indian population may be also compromised by differ-
ences in muscular mass and meat consumption betw
Table 5 Multivariate analysis of sociodemographic characteristics associated with eGFR and with eGFR <60 according to
latitude*
Variables
eGFR (n=12 500) eGFR<60(n=12 500)
North (n=6263)† South (n=6237)‡ North (n=6263)† South (n=6237)‡
Coefficient (95% CI) Coefficient (95% CI)OR (95% CI) OR (95% CI)
Area§
Urban 0.00 (ref) 0.00 (ref) 1.00 (ref) 1.00 (ref)
Rural −1.42 (−2.15 to 0.70) −7.90 (−8.81 to 7.00)0.88 (0.57 to 1.37) 4.68 (2.50 to 8.77)
Education (number of
completed years)
0 0.00 (ref) 0.00 (ref) 1.00 (ref) 1.00 (ref)*
≤5 −1.32 (−2.58 to 0.05) 1.05 (−0.06 to 2.16) 1.16 (0.57 to 2.35) 0.40 (0.20 to 0.80)
6–≤10 −3.50 (−4.48 to 2.52) 0.28 (−0.74 to 1.30) 1.34 (0.74 to 2.41) 0.35 (0.16 to 0.74)
>10 −6.93 (−7.97 to 5.89) −2.85 (−4.03 to 1.67)1.34 (0.69 to 2.58) 0.61 (0.24 to 1.57)
Alcohol consumption ever
No 0.00 (ref) 0.00 (ref) 1.00 (ref) 1.00 (ref)
Yes −0.54 (−1.55 to 0.47) −0.06 (−1.11 to 0.99)1.09 (0.62 to 1.92) 1.36 (0.74 to 2.17)
Sex
Female 0.00 (ref) 0.00 (ref) 1.00 (ref) 1.00 (ref)
Male −0.17 (−0.96 to 0.63) −5.40 (−6.29 to 4.51)0.97 (0.59 to 1.59) 1.58 (0.91 to 2.75)
Age (per 10 years) −9.26 (−9.55 to 8.97) −8.96 (−9.28 to 8.64)2.51 (2.15 to 2.93) 2.10 (1.77 to 2.50)
*Likelihood ratio test for linear trend <0.05, OR (95% CI)=0.68 (0.51 to 0.91).
†North areas include Delhi, Sonipat and Faridabad district.
‡South areas include Chennai and Vishakhapatnam districts.
§Urban areas include Delhi, Chennai and Sonipat district. Rural areas include Sonipat, Vishakhapatnam and Faridabad districts.
eGFR, estimated glomerular filtration rate.
copyright.
on April 9, 2020 at India:BMJ-PG Sponsored. Protected byhttp://bmjopen.bmj.com/BMJ Open: first published as 10.1136/bmjopen-2018-023353 on 7 March 2019. Downloaded from
Paraphrase This Document
Need a fresh take? Get an instant paraphrase of this document with our AI Paraphraser
11O’Callaghan-Gordo C, et al. BMJ Open 2019;9:e023353. doi:10.1136/bmjopen-2018-023353
Open access
population groups within India. We adjusted the analyses
for fat free mass and vegetarianism, but this did not alter the
results, suggesting no confounding effect by these variables.
Our study has at least three potential limitations. First,
we only had one measure of eGFR, and therefore we could
not differentiate acute kidney injury (AKI) from CKD.
This is a common limitation in epidemiological studies,
as it is challenging to obtain more than one measure of
eGFR at least 3 months apart in large population-based
investigations. Therefore, we may have misclassified some
cases of AKI as reduced eGFR, and therefore overestimate
the prevalence of this condition. Nevertheless, there is no
a priori reason to think that potential misclassification was
different according to the evaluated risks factors. Second,
the three population-based studies included in this anal-
ysis used different sampling strategies. CARRS and UDAY
studies included only one man and one woman from all
the eligible participants of selected households, whereas
ICMR-CHD included all eligible adults from each
selected household. This could have slightly biased our
results (including our prevalence estimates) if risk factors
potentially associated with CKDu were different between
households inhabited only by a man and a women or by
extended families. Third, information on other potential
risk factors for CKDu, such as infections by Leptospora or
hantavirus infection, or use of non-steroidal anti-inflam-
matory drugs was not available.
The main strengths of the study are the use of a random
selection of population-based participants and a large
sample size including participants from different areas
of India (urban and rural, and Northern and Southern
India). Moreover, we used the definitions proposed in
DRGREE study,42 that aims to allow international compar-
isons of CKDu prevalence and help in the description of
risk factors and in identifying the causes and mechanisms
leading to CKDu.
In conclusion, our findings indicate that reduced
eGFR, consistent with the definition of CKDu, is common
in rural settings of Southern India (Vishakhapatnam
district). This results support the hypothesis that the
epidemic of CKDu, initially described in agricultural
communities of Central America and Sri Lanka, may be
common in other rural communities of tropical/subtrop-
ical countries. This has important implications for global
health, since it indicates that CKDu may have a substan-
tial public health burden globally that has been previ-
ously unrecognised. Population-based studies in other
tropical/subtropical countries are required to assess the
global patterns of burden of disease from CKDu.42
Author affiliations
1ISGlobal, Barcelona, Spain
2Universitat Pompeu Fabra (UPF), Barcelona, Spain
3CIBER Epidemiología y Salud Pública (CIBERESP), Madrid, Spain
4Department of Medical Statistics, London School of Hygiene and Tropical Medicine,
London, UK
5Public Health Foundation of India, Gurgaon, Haryana, India
6Centre for Control of Chronic Conditions (4Cs), New Delhi, Haryana, India
7StanfordUniversity School of Medicine, Stanford, CA, USA
8LaIsla Network, Ada, Michigan, USA
9Occupationaland Environmental Medicine, Sahlgrenska Academy, Goth
University, Gothenburg, Sweden
10
Occupationaland Environmental Medicine, Lund University, Lund, Swed
11
Centrefor Community Medicine, All India Institute of Medical Sciences,
Haryana, India
12
Diabetes Research, Madras Diabetes Research Foundation, Chennai, In
13
Dr.Mohan’s Diabetes Specialities Centre, Chennai, India
14
Departmentof Epidemiology and Population Health, London School of H
Tropical Medicine, London, UK
15
Departmentof Endocrinology and Metabolism, All India Institute of Med
Sciences, New Delhi, India
16
EmoryGlobal Diabetes Research Center, Rollins School of Public Health
University, Atlanta, GA, USA
17
Centrefor Global NCDs, London School of Hygiene and Tropical Medicin
UK
18
Centrefor Nephrology, University College London Medical School, Lond
Correction notice This article has been corrected since it first publish
the publication of this article, the authors noticed that the map of India
the study sites needed correction. The borders of India shown in the ma
inaccurate and the authors have therefore decided to withdraw this map
publication. The article has therefore been republished without the origi
Any readers with an academic interest in the information originally disp
figure may contact the authors directly in relation to this information.
Acknowledgements We thank Manolis Kogevinas for his comments o
advanced version of the manuscript.
Contributors CO-G, BC, NP and DP designed the work; RS, SA, SG, RG
VM, PPA, NT and KMN collected the data; CO-G and DK conducted the an
the data; CO-G, RS, SA, JG, KJ, DN, SM, KMN, NP, BC and DP interpreted
of the work. CO-G, RS, BC, and NP drafted the manuscript; RS, SA, SG, JG
DK, AK, SM, VM, DN, PPA, NT, KMN and DP revised the manuscript for im
intellectual content, provided comments and suggested revisions. All au
approved the final version for publication.
Funding This work was supported in part by grant MR/P02386X/1 from
United Kingdom Medical Research Council under the Global Challenges
Fund. It was also supported by grants from the Colt Foundation and the
Foundation. The CARRS study was funded with federal funds from the N
Heart, Lung, and Blood Institute, National Institutes of Health, under Con
HHSN2682009900026C. UDAY study was funded by Eli Lilly Foundation.
study was funded by the Indian Council Medical Research (ICMR). The C
Global NCDs is supported by the Wellcome Trust Institutional Strategic S
(097834/Z/11/B). CO-G was supported by a Sara Borrell postdoctoral fel
awarded from the Carlos III National Institute of Health, Spain (CD13/00
Competing interests None declared.
Patient consent for publication Not required.
ethics approval Participants from CARRS, UDAY and ICMR-CHD studie
informed consent prior to participation. The three studies obtained ethic
from the corresponding institutions.
Provenance and peer review Not commissioned; externally peer rev
Data sharing statement The datasets used and/or analysed during th
study are available from Public Health Foundation of India (PHFI) on reas
request. Interested investigators should contact PHFI. Computing code c
obtained from the corresponding author.
Open access This is an open access article distributed in accordance w
Creative Commons Attribution 4.0 Unported (CC BY 4.0) license, which p
others to copy, redistribute, remix, transform and build upon this work f
purpose, provided the original work is properly cited, a link to the licenc
and indication of whether changes were made. See: https:// creativecom
licenses/by/ 4.0/.
reFerenCes
1. Wesseling C, Crowe J, Hogstedt C, et al. Mesoamerican
Nephropathy: report from the First International Research Workshop
on MeN. Heredia, Costa Rica, 2013.
copyright.
on April 9, 2020 at India:BMJ-PG Sponsored. Protected byhttp://bmjopen.bmj.com/BMJ Open: first published as 10.1136/bmjopen-2018-023353 on 7 March 2019. Downloaded from
12 O’Callaghan-Gordo C, et al. BMJ Open 2019;9:e023353. doi:10.1136/bmjopen-
Open access
2. Correa-Rotter R, Wesseling C, Johnson RJ. CKD of unknown origin
in Central America: the case for a Mesoamerican nephropathy. Am J
Kidney Dis 2014;63:506–20.
3. Jayatilake N, Mendis S, Maheepala P, et al. Chronic kidney disease of
uncertain aetiology: prevalence and causative factors in a developing
country. BMC Nephrol 2013;14:1.
4. Lebov JF, Valladares E, Peña R, et al. A population-based study
of prevalence and risk factors of chronic kidney disease in León,
Nicaragua. Can J Kidney Health Dis 2015;2:41.
5. Peraza S, Wesseling C, Aragon A, et al. Decreased kidney function
among agricultural workers in El Salvador. Am J Kidney Dis
2012;59:531–40.
6. Torres C, Aragón A, González M, et al. Decreased kidney function
of unknown cause in Nicaragua: a community-based survey. Am J
Kidney Dis 2010;55:485–96.
7. Seck SM, Doupa D, Gueye L, et al. Prevalence of chronic kidney
disease and associated factors in senegalese populations: a
community-based study in saint-louis. Nephrourol Mon 2014;6:e19085.
8. Barsoum RS. Burden of chronic kidney disease: North Africa. Kidney
Int Suppl 2013;3:164–6.
9. El Minshawy O, Ghabrah T, El Bassuoni E. End-stage renal disease in
Tabuk Area, Saudi Arabia: an epidemiological study. Saudi J Kidney
Dis Transpl 2014;25:192–5.
10. Rajapurkar MM, John GT, Kirpalani AL, et al. What do we know about
chronic kidney disease in India: first report of the Indian CKD registry.
BMC Nephrol 2012;13:10.
11. Reddy DV, Gunasekar A. Chronic kidney disease in two coastal
districts of Andhra Pradesh, India: role of drinking water. Environ
Geochem Health 2013;35:439–54.
12. Jayasumana C, Paranagama P, Agampodi S, et al. Drinking well
water and occupational exposure to Herbicides is associated with
chronic kidney disease, in Padavi-Sripura, Sri Lanka. Environmental
Health 2015;14.
13. Wesseling C, van Wendel de Joode B, Crowe J, et al. Mesoamerican
nephropathy: geographical distribution and time trends of chronic
kidney disease mortality between 1970 and 2012 in Costa Rica.
Occup Environ Med 2015;72:714–21.
14. Garcia-Garcia G, Jha V. World Kidney Day Steering Committee.
Environmental and occupational factors in CKD. Occup Environ Med
2015;72:238.
15. Robey RB. Cyclical dehydration-induced renal injury and
Mesoamerican nephropathy: as sweet by any other name? Kidney Int
2014;86:226–9.
16. Jha V, Modi G. Uncovering the rising kidney failure deaths in India.
Lancet Glob Health 2017;5:e14–15.
17. Dare AJ, Fu SH, Patra J, et al. Renal failure deaths and their risk
factors in India 2001–13: nationally representative estimates from the
Million Death Study. Lancet Glob Health 2017;5:e89–95.
18. Chatterjee R. Occupational hazard. Science 2016;352:24–7.
19. Ganguli A. Uddanam Nephropathy/Regional Nephropathy in India:
preliminary findings and a plea for further research. Am J Kidney Dis
2016;68:344–8.
20. Nair M, Ali MK, Ajay VS, et al. CARRS Surveillance study: design and
methods to assess burdens from multiple perspectives. BMC Public
Health 2012;12:1.
21. Mohan S, Jarhyan P, Ghosh S, et al. UDAY: A comprehensive
diabetes and hypertension prevention and management program in
India. BMJ Open 2018;8:e015919.
22. Prabhakaran D, Roy A, Praveen PA, et al. 20-Year trend of
cardiovascular disease risk factors. Glob Heart 2017.
23. Levey AS, Stevens LA, Schmid CH, et al. A new equation to estimate
glomerular filtration rate. Ann Intern Med 2009;150:604–12.
24. Patel SA, Deepa M, Shivashankar R, et al. Comparison of multiple
obesity indices for cardiovascular disease risk classification in South
Asian adults: The CARRS Study. PLoS One 2017;12:e0174251.
25. Anand S, Shivashankar R, Ali MK, et al. Prevalence of chronic kidney
disease in two major Indian cities and projections for associated
cardiovascular disease. Kidney Int 2015;88:178–85.
26. Greenland S, Daniel R, Pearce N, et al. Outcome modelling strategies
in epidemiology: traditional methods and basic alternatives. Int J
Epidemiol 2016;45:565–75.
27. Census of India. 2011 http:// censusindia.gov. in/ (Accessed 1 Aug
2018).
28. Longvah T, Ananthan R, Bhaskarachary K, et al. Indian food
composition tables. Hyderabad, 2017.
29. Herman WH. Do race and ethnicity impact hemoglobin A1c
independent of glycemia? J Diabetes Sci Technol 2009;3:656–60.
30. Modesti PA, Reboldi G, Cappuccio FP, et al. Panethnic differences
in blood pressure in europe: a systematic review and meta-analysis.
PLoS One 2016;11:e0147601.
31. Verhave JC, Hillege HL, Burgerhof JG, et al. The association
between atherosclerotic risk factors and renal function in the general
population. Kidney Int 2005;67:1967–73.
32. Bailey PK, Tomson CR, Kinra S, et al. The effect of rural-to-urban
migration on renal function in an Indian population: cross-sectional
data from the Hyderabad arm of the Indian Migration Study. BMC
Nephrol 2013;14:240.
33. Lunyera J, Mohottige D, Von Isenburg M, et al. CKD of
uncertain etiology: a systematic review. Clin J Am Soc Nephrol
2016;11:379–85.
34. Peel MC, Finlayson BL, McMahon TA. Updated world map of
the Köppen-Geiger climate classification. Hydrol Earth Syst Sci
2007;11:1633–44.
35. Norwegian Meteorological Institute and the Norwegian Broadcasting
Corporation.
36. Levey AS, Coresh J. Chronic kidney disease. The Lancet
2012;379:165–80.
37. Eastwood JB, Kerry SM, Plange-Rhule J, et al. Assessment of
GFR by four methods in adults in Ashanti, Ghana: the need for an
eGFR equation for lean African populations. Nephrol Dial Transplant
2010;25:2178–87.
38. Teo BW, Xu H, Wang D, et al. GFR estimating equations in a
multiethnic Asian population. Am J Kidney Dis 2011;58:56–63.
39. Singh AK, Farag YM, Mittal BV, et al. Epidemiology and risk factors
of chronic kidney disease in India - results from the SEEK (Screening
and Early Evaluation of Kidney Disease) study. BMC Nephrol
2013;14:1.
40. Barai S, Bandopadhayaya GP, Patel CD, et al. Do healthy potential
kidney donors in india have an average glomerular filtration rate of
81.4 ml/min? Nephron Physiol 2005;101:21–6.
41. Srinivas S, Annigeri RA, Mani MK, et al. Estimation of glomerular
filtration rate in South Asian healthy adult kidney donors. Nephrology
2008;13:440–6.
42. Caplin B, Jakobsson K, Glaser J, et al. International collaboration
for the epidemiology of eGFR in low and middle income
populations - Rationale and core protocol for the Disadvantaged
Populations eGFR Epidemiology Study (DEGREE). BMC Nephrol
2017;18:1–8.
43. World Health Organization. STEPS Manual, 2015.
copyright.
on April 9, 2020 at India:BMJ-PG Sponsored. Protected byhttp://bmjopen.bmj.com/BMJ Open: first published as 10.1136/bmjopen-2018-023353 on 7 March 2019. Downloaded from
⊘ This is a preview!⊘
Do you want full access?
Subscribe today to unlock all pages.
Trusted by 1+ million students worldwide
1 out of 12
Your All-in-One AI-Powered Toolkit for Academic Success.
+13062052269
info@desklib.com
Available 24*7 on WhatsApp / Email
![[object Object]](/_next/static/media/star-bottom.7253800d.svg)
Unlock your academic potential
Copyright © 2020–2026 A2Z Services. All Rights Reserved. Developed and managed by ZUCOL.