Circuit Analysis I Lab: Function Generator and Oscilloscope Experiment

Verified

Added on  2021/10/01

|9
|906
|167
Practical Assignment
AI Summary
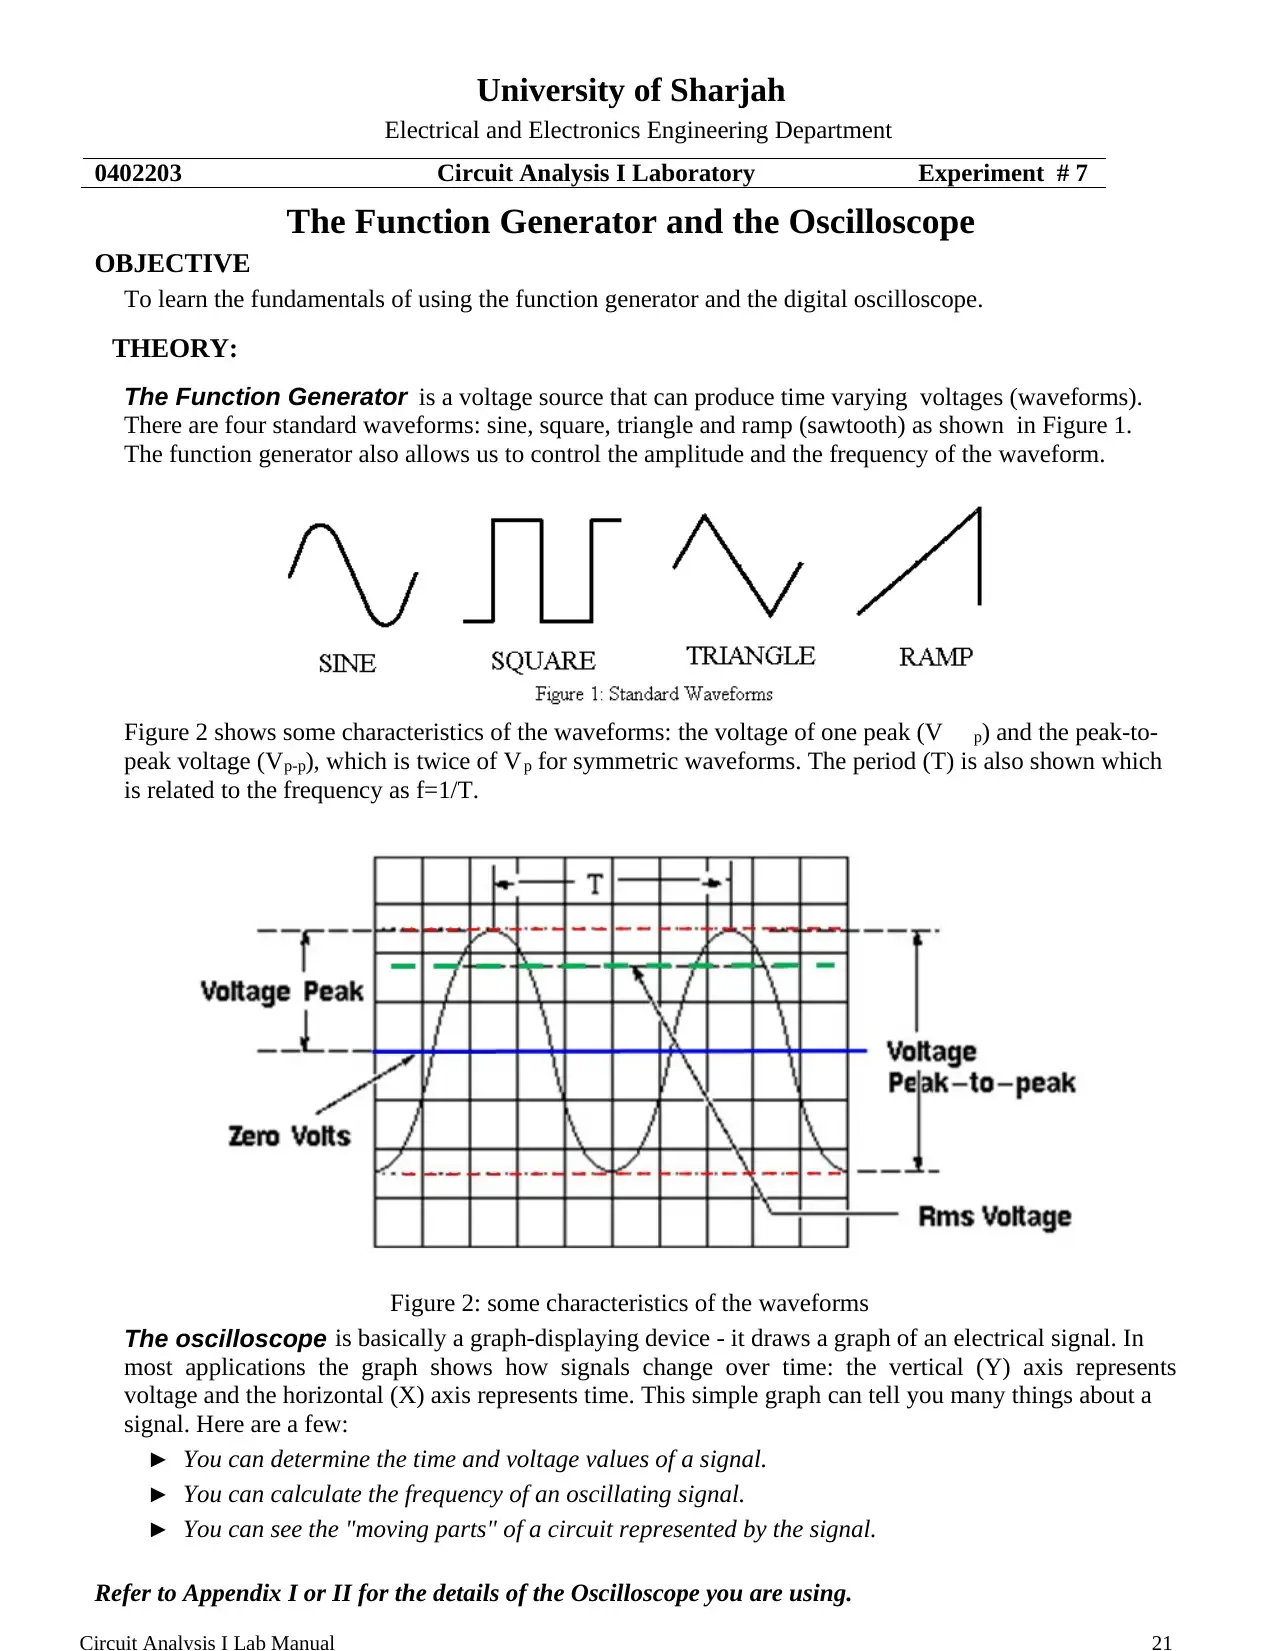
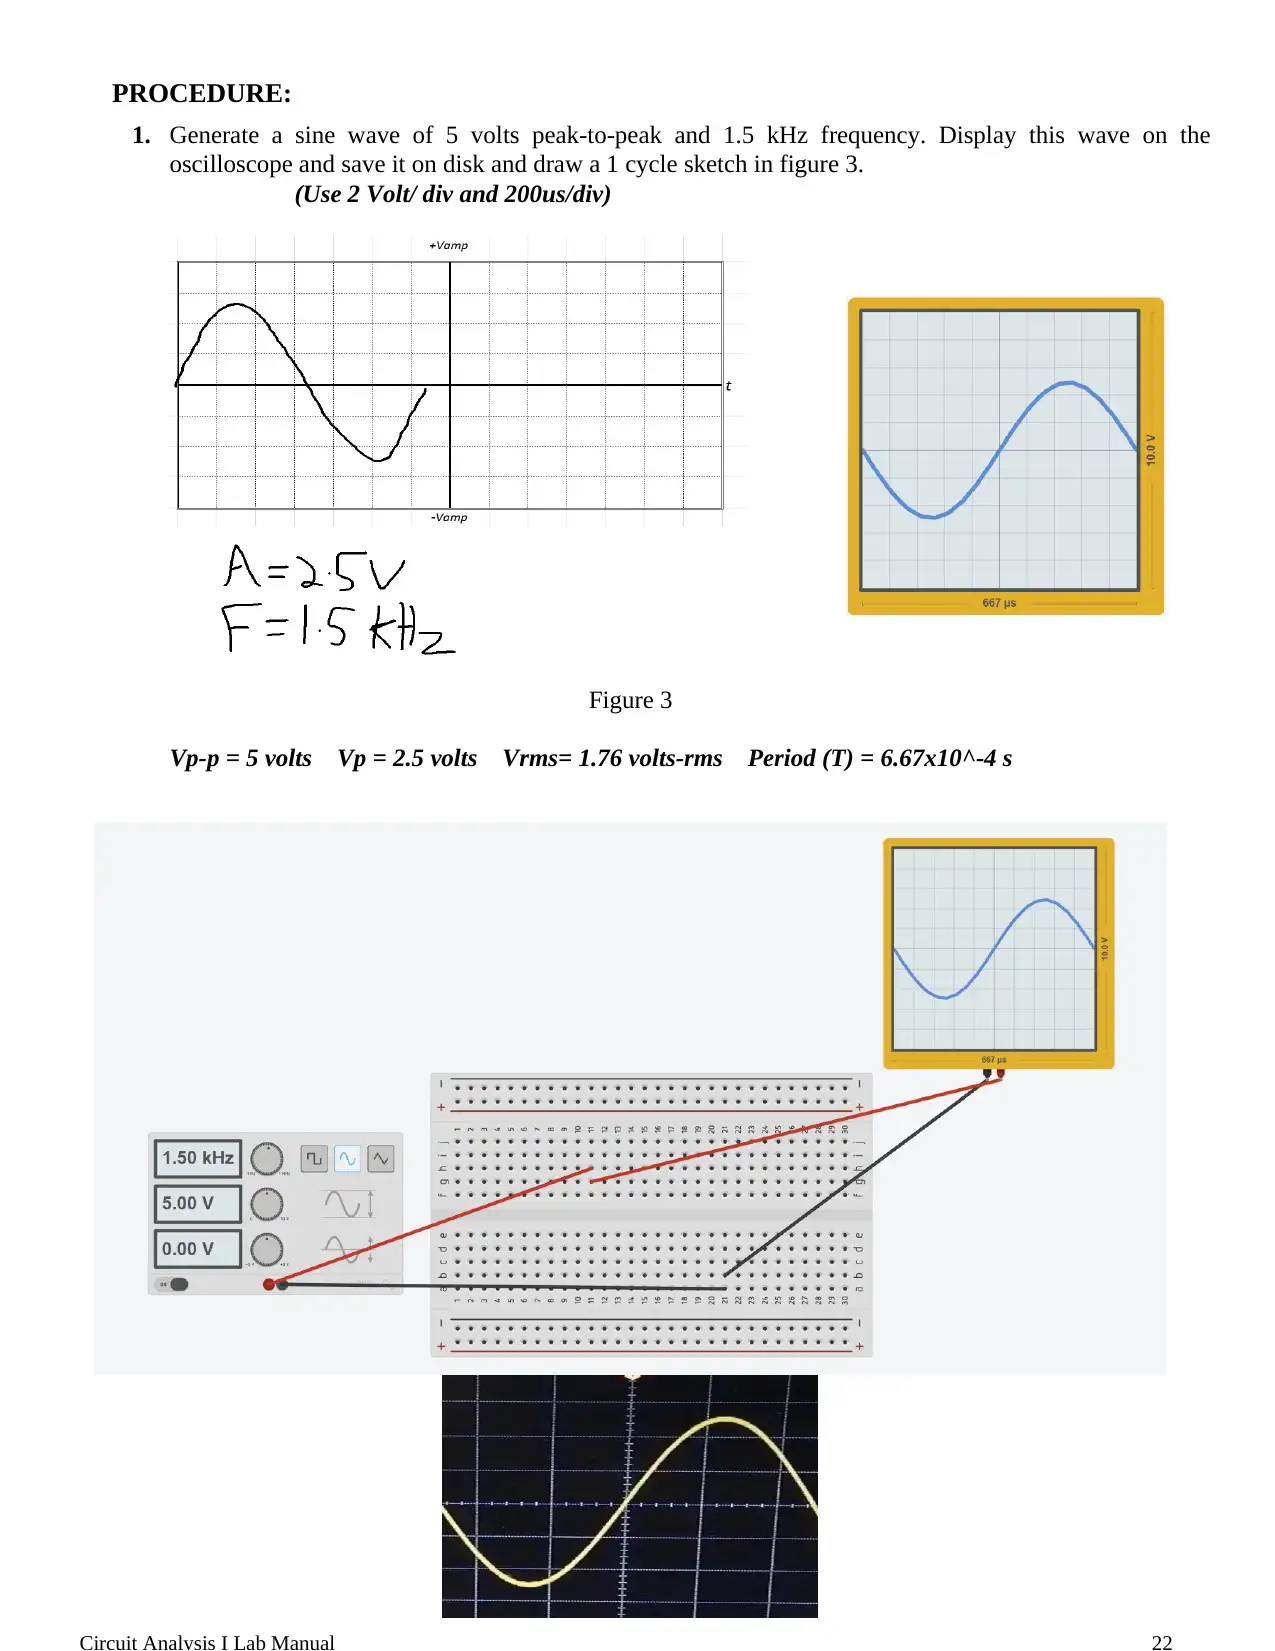
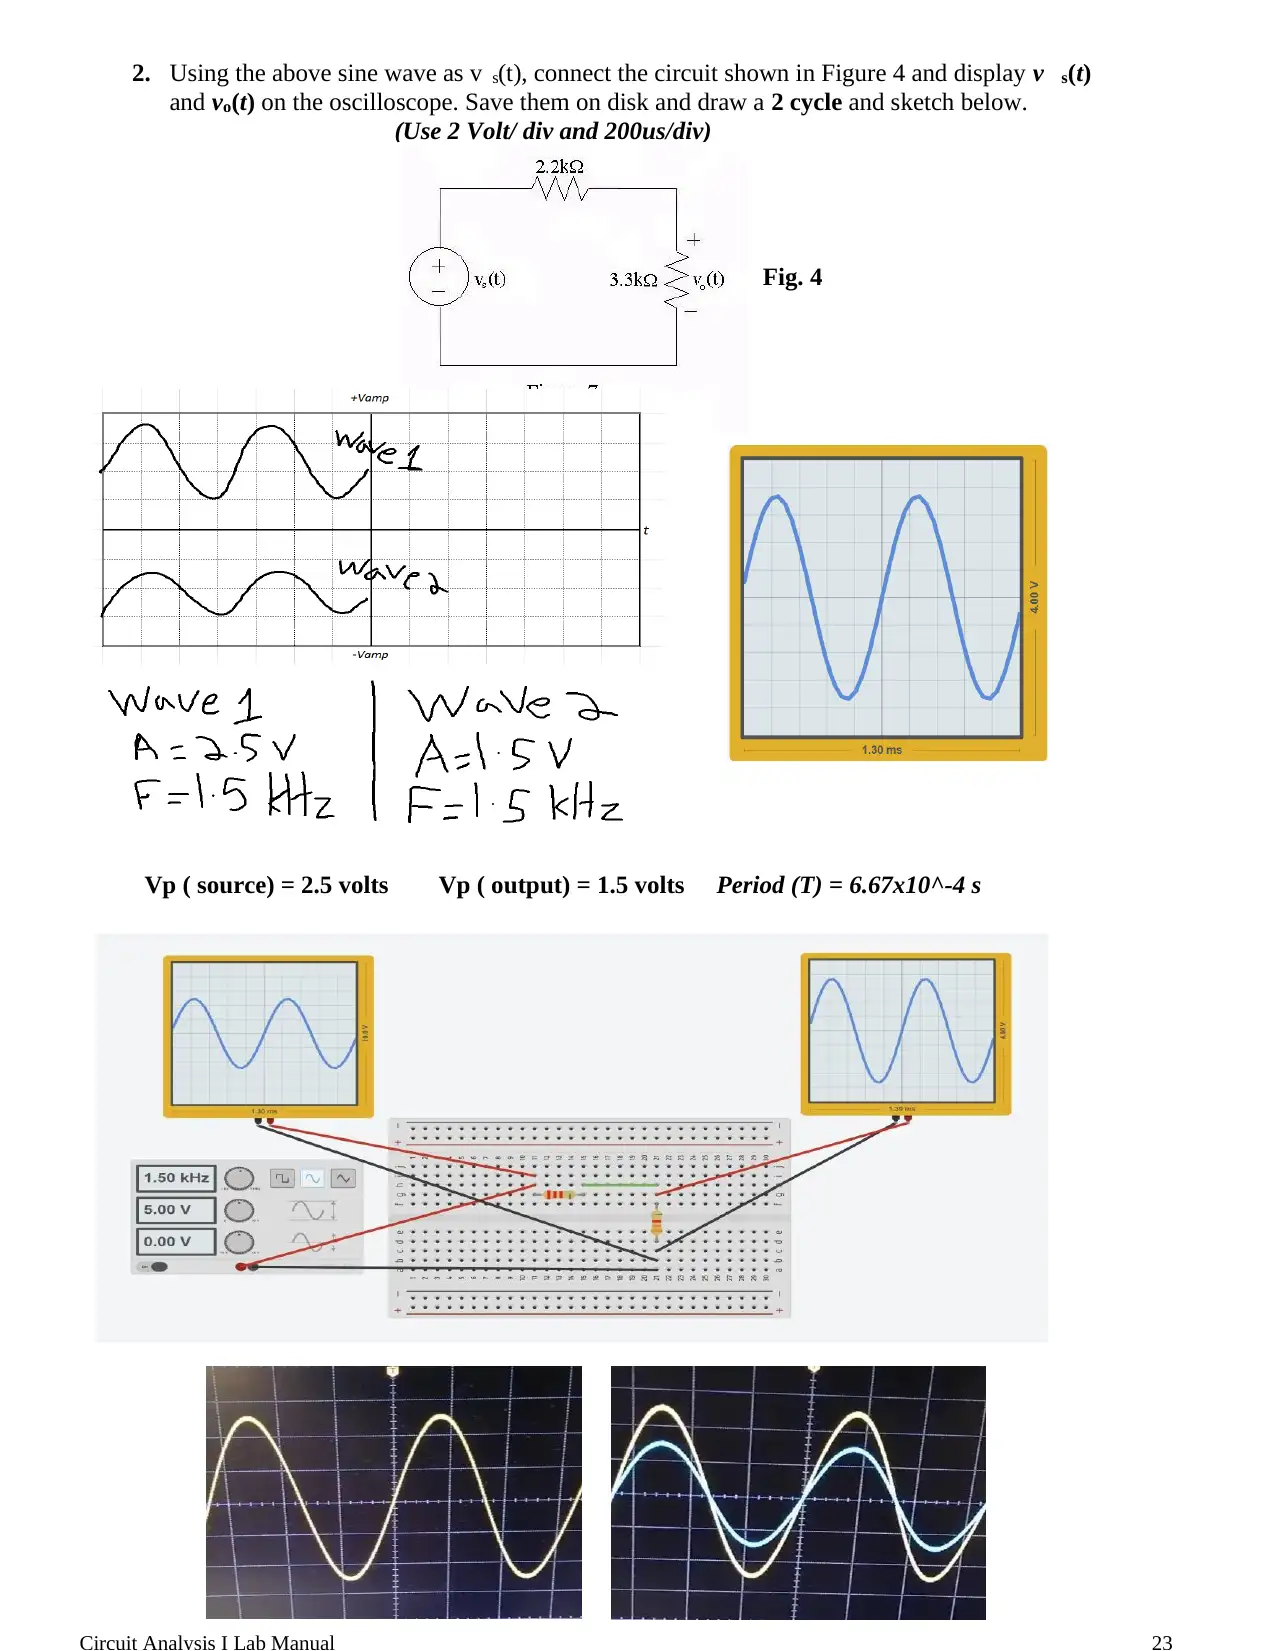
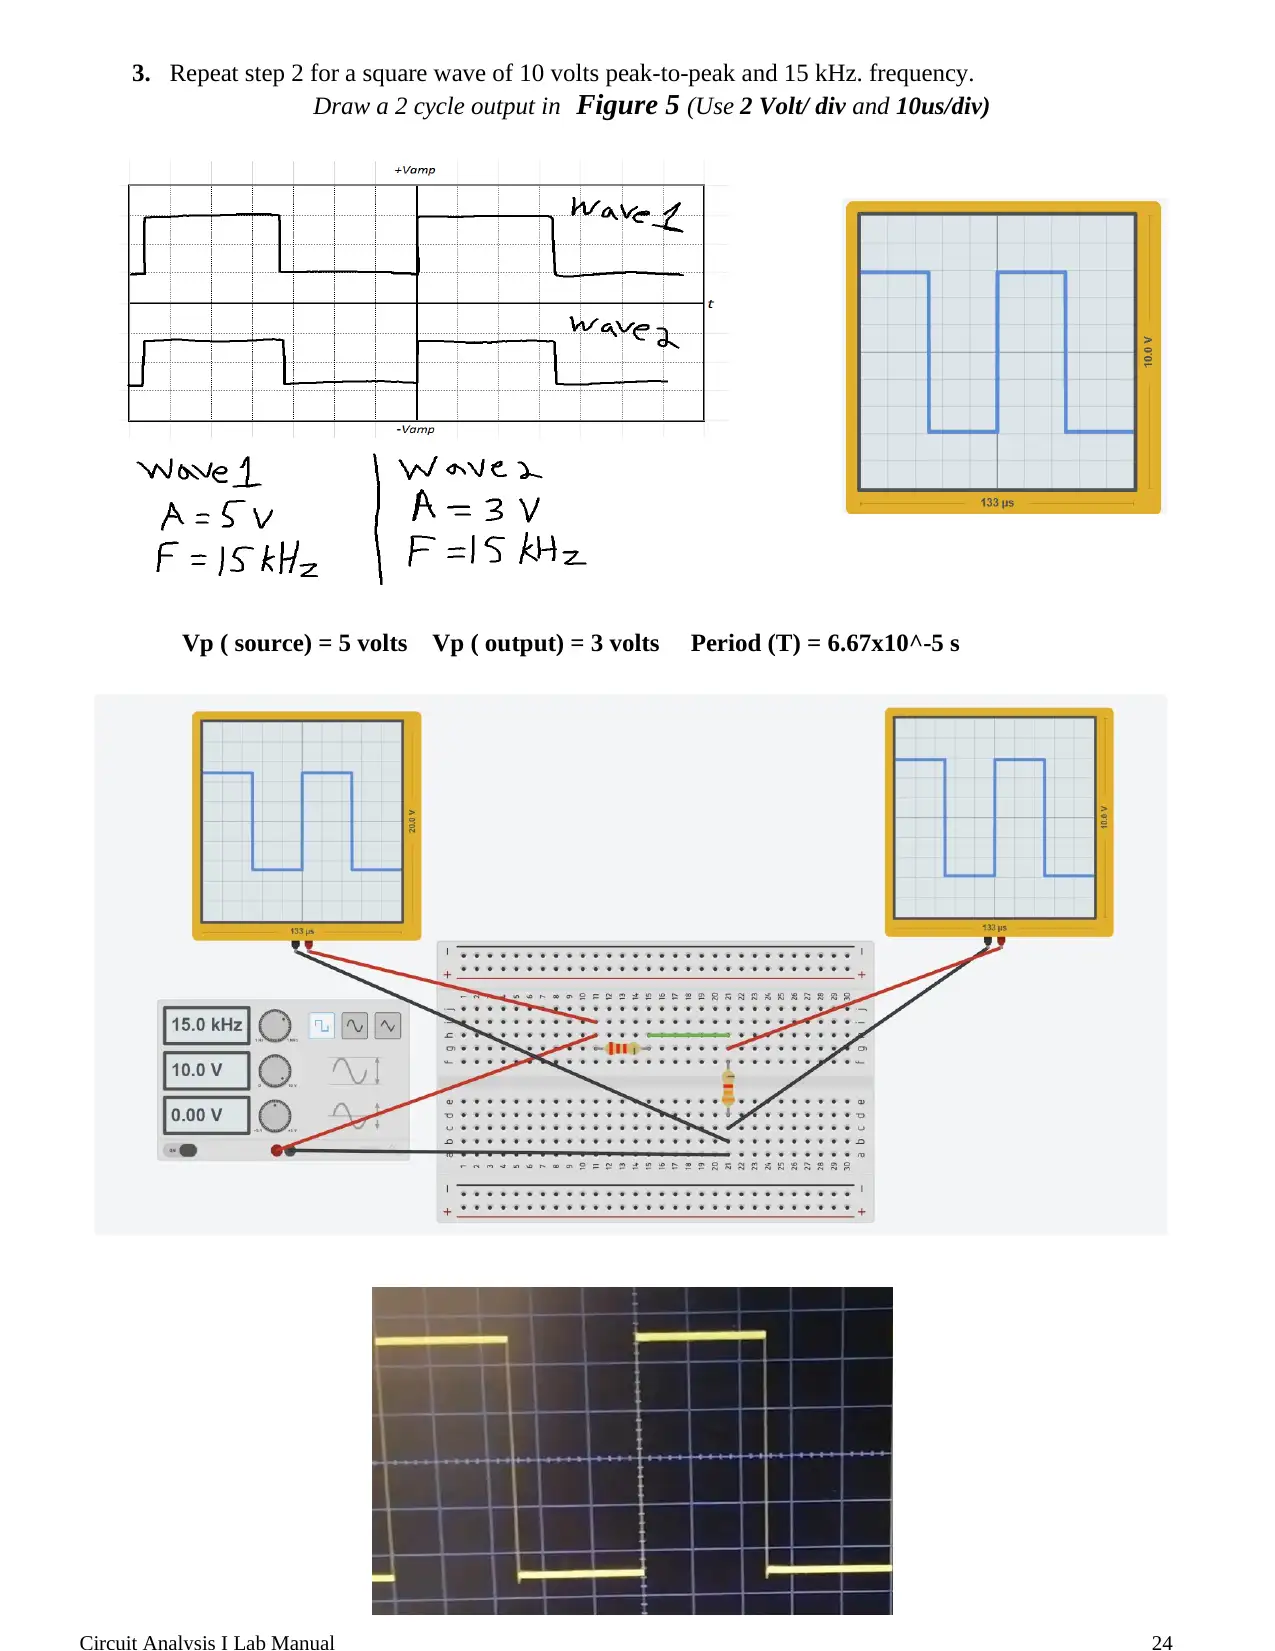
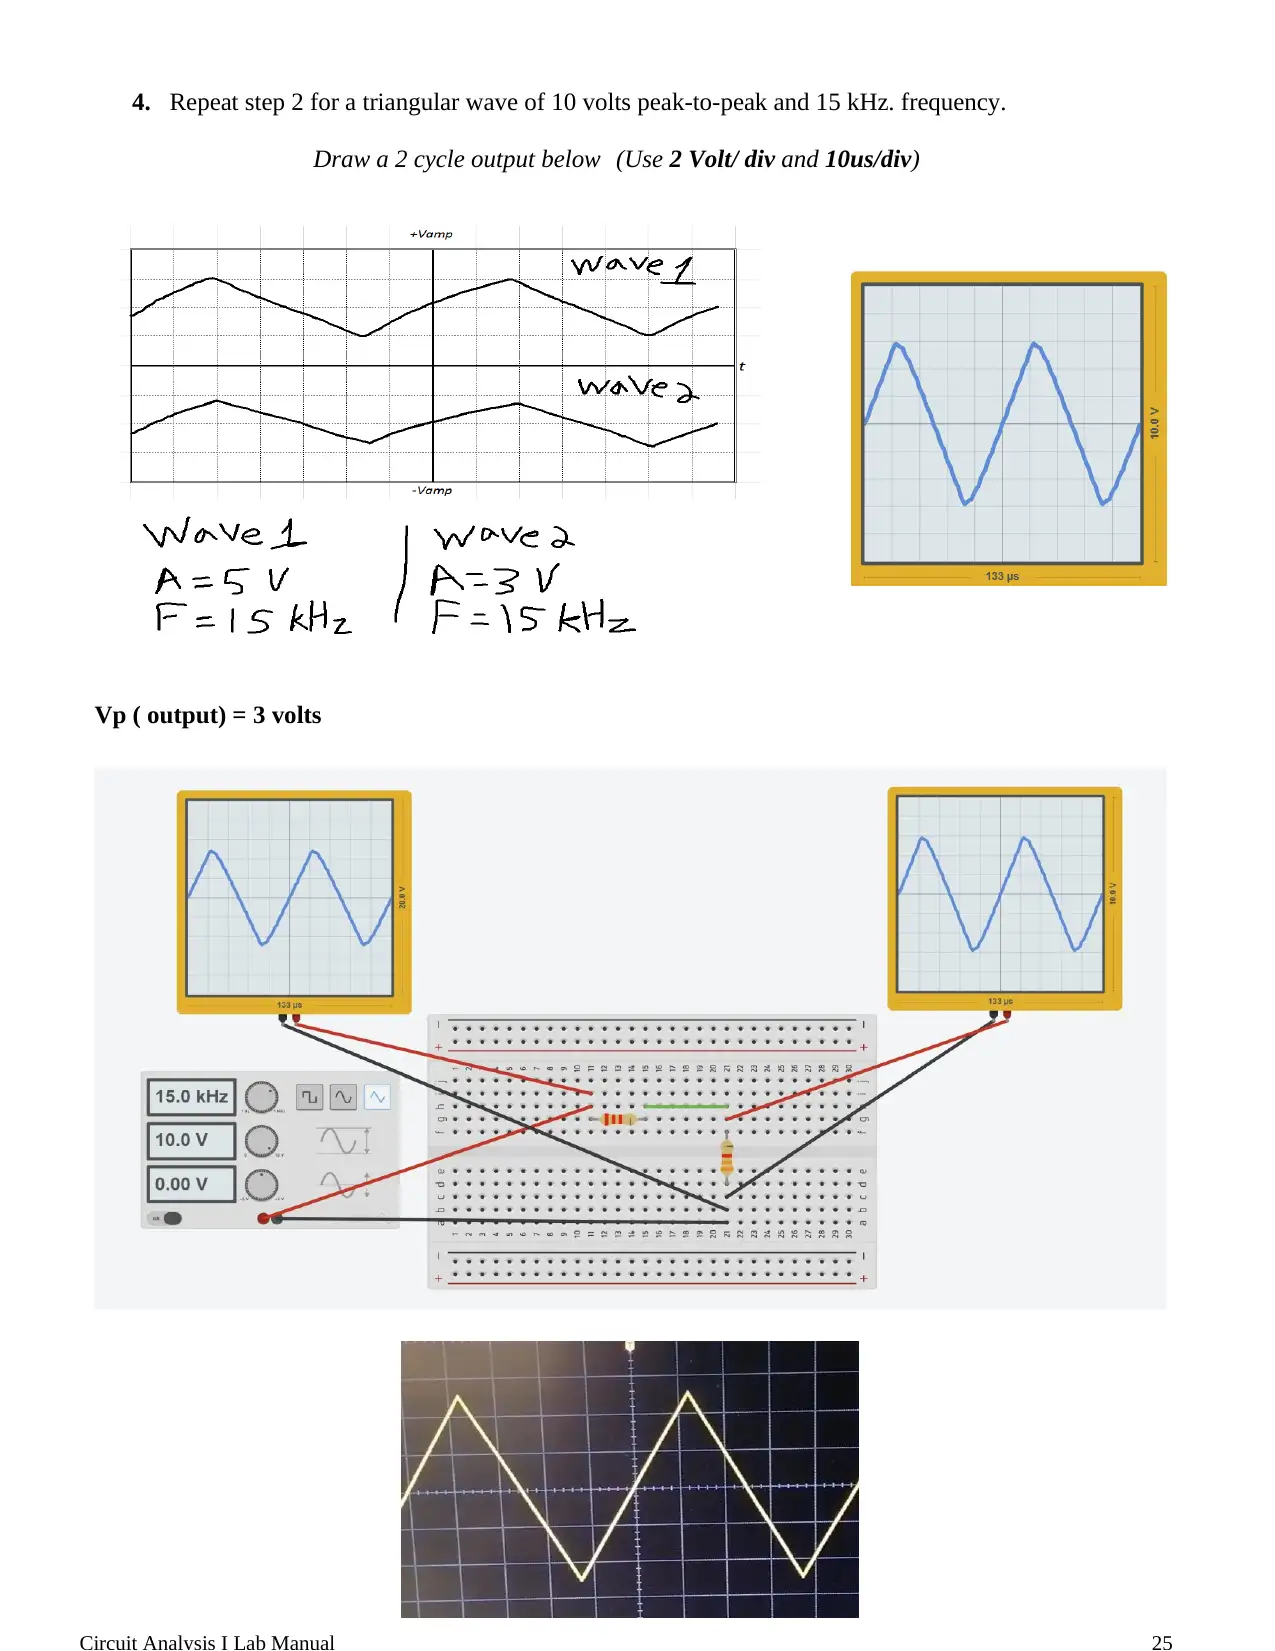
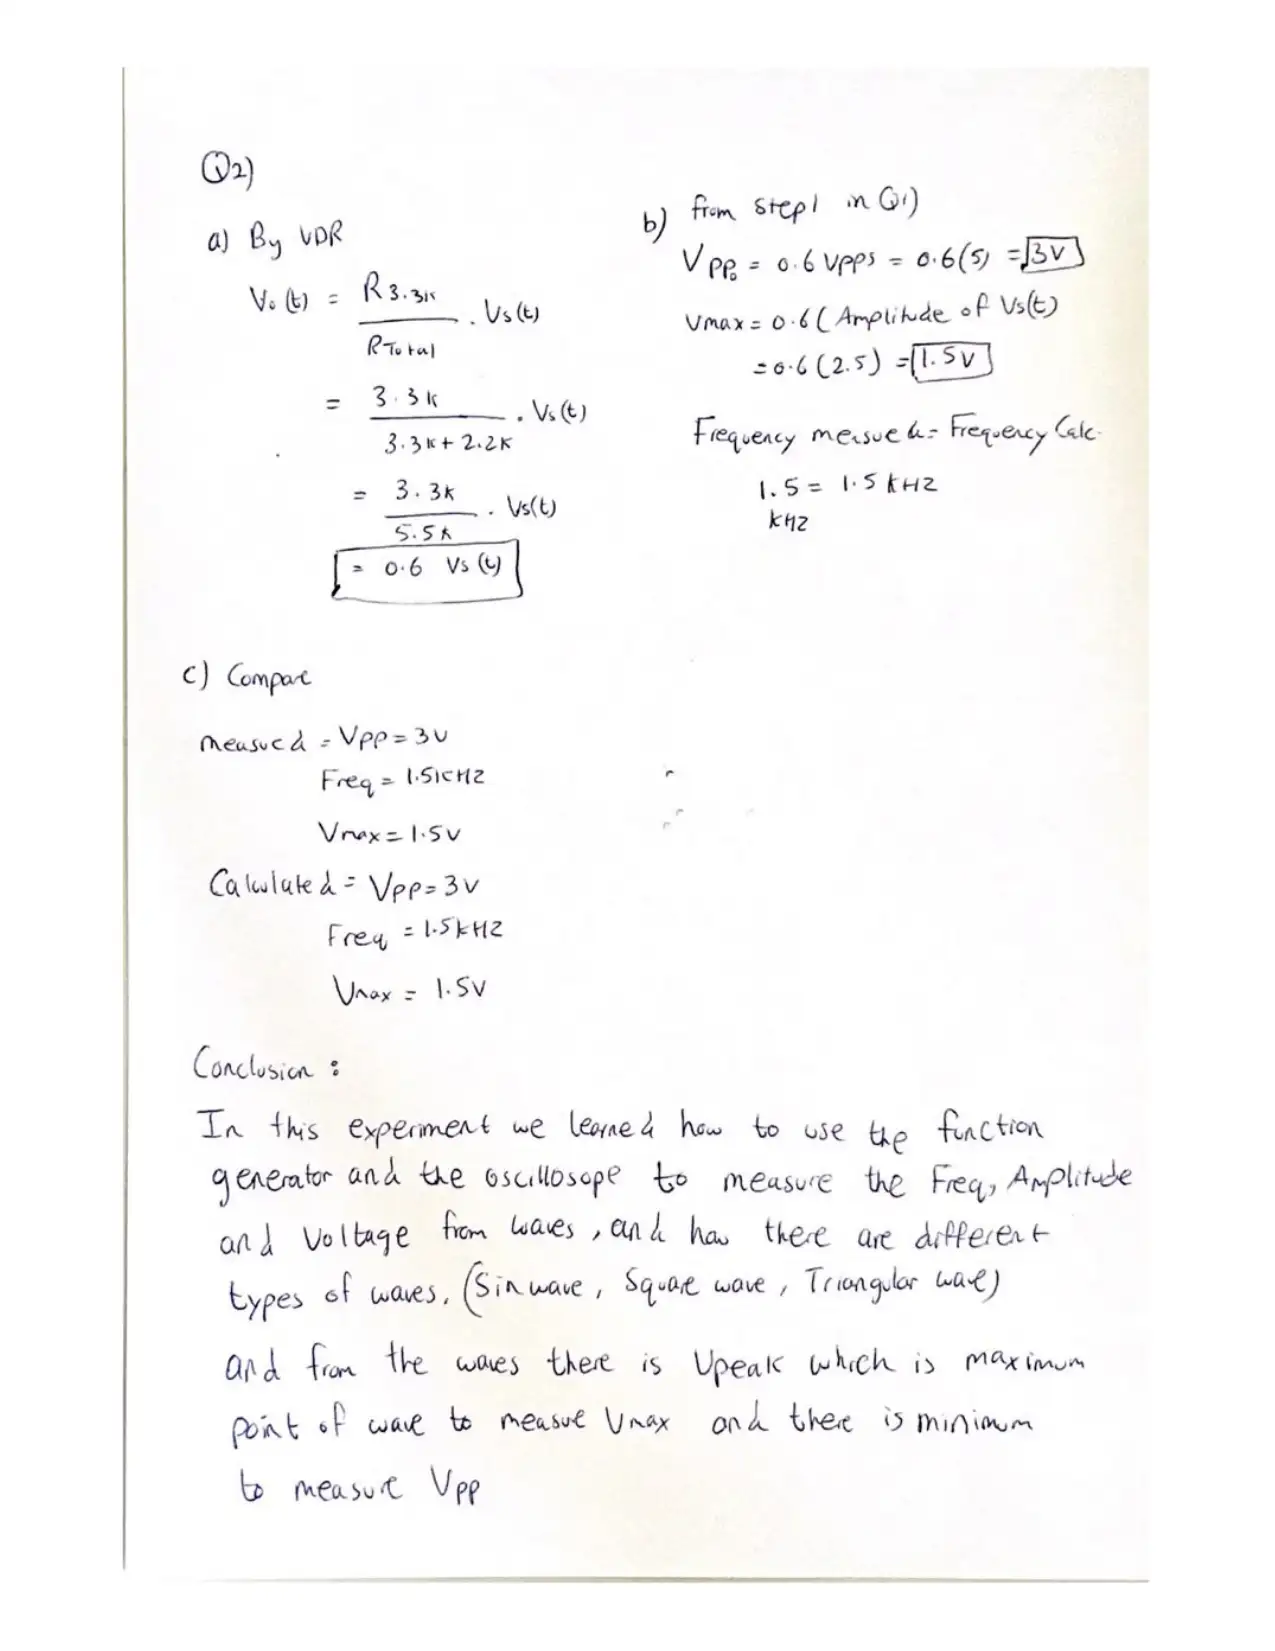
This document is a lab report from the Circuit Analysis I course at the University of Sharjah, focusing on an experiment involving a function generator and an oscilloscope. The objective of the lab was to learn the fundamentals of using a function generator to produce various waveforms (sine, square, and triangle) with controlled amplitude and frequency, and to use an oscilloscope to visualize and analyze these waveforms. The procedure involved generating sine, square, and triangular waves, measuring their characteristics (peak-to-peak voltage, frequency, and period), and observing the output of a simple circuit with a voltage divider. The results section includes plots of the recorded waveforms and a comparison of calculated and measured output voltages to demonstrate the applicability of the voltage divider rule for time-varying voltages. The report also includes a glossary of key terms related to waveforms and signal analysis.
Document Page
UNIVERSITY OF SHARJAH
COLLEGE OF ENGINEERING
ELECTRICAL ENGINEERING
Course Name: Circuit Analysis Lab 1
Course No:0402203
Lab Title: The Function Generator and the oscilloscope
Date Conducted: 1-11-2020
Date of Submission: 8-11-2020
Group Members:
Bader Bilal Adel Alief - U18102761
Abdulla Easa Abdulla Alkulaib Alteneji – U18100014
tabler-icon-diamond-filled.svg

Paraphrase This Document

Need a fresh take? Get an instant paraphrase of this document with our AI Paraphraser
Document Page
University of Sharjah
Electrical and Electronics Engineering Department
0402203 Circuit Analysis I Laboratory Experiment # 7
The Function Generator and the Oscilloscope
OBJECTIVE
To learn the fundamentals of using the function generator and the digital oscilloscope.
THEORY:
The Function Generator is a voltage source that can produce time varying voltages (waveforms).
There are four standard waveforms: sine, square, triangle and ramp (sawtooth) as shown in Figure 1.
The function generator also allows us to control the amplitude and the frequency of the waveform.
Figure 2 shows some characteristics of the waveforms: the voltage of one peak (V p) and the peak-to-
peak voltage (Vp-p), which is twice of Vp for symmetric waveforms. The period (T) is also shown which
is related to the frequency as f=1/T.
Figure 2: some characteristics of the waveforms
The oscilloscope is basically a graph-displaying device - it draws a graph of an electrical signal. In
most applications the graph shows how signals change over time: the vertical (Y) axis represents
voltage and the horizontal (X) axis represents time. This simple graph can tell you many things about a
signal. Here are a few:
You can determine the time and voltage values of a signal.
You can calculate the frequency of an oscillating signal.
You can see the "moving parts" of a circuit represented by the signal.
Refer to Appendix I or II for the details of the Oscilloscope you are using.
Document Page
PROCEDURE:
1. Generate a sine wave of 5 volts peak-to-peak and 1.5 kHz frequency. Display this wave on the
oscilloscope and save it on disk and draw a 1 cycle sketch in figure 3.
(Use 2 Volt/ div and 200us/div)
Figure 3
Vp-p = 5 volts Vp = 2.5 volts Vrms= 1.76 volts-rms Period (T) = 6.67x10^-4 s
Document Page
2. Using the above sine wave as v s(t), connect the circuit shown in Figure 4 and display v s(t)
and vo(t) on the oscilloscope. Save them on disk and draw a 2 cycle and sketch below.
(Use 2 Volt/ div and 200us/div)
Vp ( source) = 2.5 volts Vp ( output) = 1.5 volts Period (T) = 6.67x10^-4 s
Fig. 4
tabler-icon-diamond-filled.svg

Paraphrase This Document

Need a fresh take? Get an instant paraphrase of this document with our AI Paraphraser
Document Page
3. Repeat step 2 for a square wave of 10 volts peak-to-peak and 15 kHz. frequency.
Draw a 2 cycle output in Figure 5 (Use 2 Volt/ div and 10us/div)
Vp ( source) = 5 volts Vp ( output) = 3 volts Period (T) = 6.67x10^-5 s
Document Page
4. Repeat step 2 for a triangular wave of 10 volts peak-to-peak and 15 kHz. frequency.
Draw a 2 cycle output below (Use 2 Volt/ div and 10us/div)
Vp ( output) = 3 volts
Document Page
RESULTS:
1. For steps 1 to 4: plot all the waveforms recorded in the lab. State the amplitude and the frequency
for each waveform on these plots
2. To show that the voltage divider rule is applicable for time-varying voltages:
a. Calculate vo(t)=0.6vs(t) (by VDR).
b. Plot the calculated and measured vo(t).
c. Compare the two plots.
tabler-icon-diamond-filled.svg

Paraphrase This Document

Need a fresh take? Get an instant paraphrase of this document with our AI Paraphraser
Document Page
Glossary:
Waveform The path traced by a quantity, plotted as a function of some variable such as
position, time, temperature, and so on.
Periodic Waveform A waveform that continually repeats itself after a defined time
interval.
Frequency (f) is the number of cycles of a periodic waveform that occur in 1 second. The unit of
frequency is Hertz.
Cycle A portion of the waveform contained in one period.
Period (T) the time interval between successive repetitions of a periodic waveform.
Effective Value The Equivalent DC value of any alternating voltage or current. This is also
called RMS or the Root –Mean-Square.
Vrms = Vp / (√2) = 0.707 Vp
Peak Amplitude (Peak Value) The maximum value of a waveform as measured as
measure from its average, or mean. For Voltage, it is denoted
by (Vpeak or simply Vp)
Peak to Peak Value The magnitude of the total swing of the signal from positive to
negative peaks. The sum of the absolute value of the positive and
negative peak values. For voltage, it is denoted byVp-p.
Document Page
chevron_up_icon
1 out of 9
circle_padding
hide_on_mobile
zoom_out_icon
[object Object]