Fin6806: Cisco Investment Decision Based on Financial Analysis
VerifiedAdded on 2022/08/13
|10
|3221
|17
Case Study
AI Summary
This assignment analyzes Cisco Systems, Inc.'s financial statements to guide an investment decision for Mr. Stark. It examines Cisco's historical income statements, time series data, and performs ratio analysis (gross profit margin, current, quick, and debt-to-equity ratios) to assess the company's financial health and predict future cash flow. The analysis includes regression analysis, estimated cash flow projections, and Free Cash Flow to Firm (FCFF) calculations. The study considers market risks, evaluates Cisco's performance in key sectors like cloud computing and security, and assesses the impact of fluctuations in product sales. The ultimate goal is to determine if Cisco stock is an attractive investment opportunity, considering factors like dividend payments, revenue trends, and debt levels. The analysis concludes with recommendations for Mr. Stark based on the financial data and market conditions.

1Running head: FIN6806
Fin6806
Author’s Name
Institutional Affiliation
Fin6806
Author’s Name
Institutional Affiliation
Paraphrase This Document
Need a fresh take? Get an instant paraphrase of this document with our AI Paraphraser
2FIN6806
Fin6806
Analysis of Cisco’s Financial Statement to Make an Investment Decision
This assignment mainly focuses on supporting Stark to make a proper investment
decision in the organization named Cisco Systems, Inc. by evaluating its financial statements
and determining future performance. Primarily, this organization manufactures network
associated products and services. In 2019, the company earned $51.9 billion revenue, which
can be considered as a huge success within the respective market/industry wherein it
operates. With regards to profit margin, the company generated 62.9% gross profit margin
and 27.4% operating margin in the year 2019 (See Appendices 1 & 2). Hence, the current
financial performance of the company within the global market is strong enough to attract
any new investment. The company has provided 1.36% dividends in this similar year (See
Appendix 3) (Cisco, 2019). Even though the figures depict strong monetary success of Cisco
in recent years, similar trend might get decreased in the future. For this reason, the historical
income statements of the organization have been evaluated in this particular assignment.
Additionally, time series analysis has also been conducted so that Mr. Stark can take required
decision for making investment in Cisco. Various calculations and ratio analysis have also
been performed so as to verify the actual financial position of the company. Moreover, an
analytical process has been developed through this assignment, which might assist Mr. Stark
to receive desired return on investment from the company. Overall, a critical evaluation has
been made herein so that the future cash flow of Cisco can be predicted. Though market risk
exists, wherein the company may face major issue in financial operations, proper market
analysis can help Cisco’s to assume an adequate decision for the organizational operation
during the period of monetary crisis.
In the year 2011, the board of members of Cisco took the decision of expanding its
business into new markets. This year was a transitional period for Cisco, as the company
decided to make an entry into new business markets for increasing profit percentage.
Moreover, the company succeeded to break the expectations and the prediction of Wall Street
Journal in Q4, 2011. This clearly indicated that the company is highly capable to conduct
profitable business within the global market. In any condition, the company can control its
operations to stabilize its profit and attain long-term success (Duffy, 2011). Thus, it can be
recommended that Mr. Stark can make investments on Cisco in order to gain sure return on
investment. On the other hand, the company earned revenue of $12.8 billion in Q4, 2015,
revealing 4% increment than the year 2014. In total, the company earned $49.2 billion in the
year 2015, wherein the value of earning per share (EPS) increased from $0.55 to $0.57. In
addition, the company was able to provide 0.80 dividends in the year 2015, which was 0.72 in
the year 2014. The growth of the company is clearly visible herein. Hence, Mr. Stark may
invest in this company, because its growth trend has been significantly good. In 2015, the
share price of the company was in peak i.e. $27.22 per share, which decreased to $24.52 in
the year 2020. This might discourage Mr. Stark to make the decision of investment in Cisco.
Cisco has been able to earn $250 million in the first quarter of 2020, which is
expected to be $350 million in the 2nd Quarter. Global recognition and acceptance of the
network related products are found as the reason behind this progression. Now, the company
wants to invest in cloud computing and security sectors, which are the main profitable sectors
in the current time (Cisco, 2015). This decision of the company may provide desired return
on investment to Mr. Stark by a certain level. On the other hand, the company witnessed
decline in its product sales within the global operational market i.e. 23% in China and 13% in
Brazil among others. Though Cisco is viewed to be one of the largest companies in the world,

3FIN6806
the prevailing market conditions supporting the company are not found as good. Therefore, a
dilemma associated with the investment has been created herein. In one side, the company
has the ability to bounce back within the market and on the other hand, it faces extreme
struggle within the operating markets during the period of 2019-2020. Mr. Stark needs to
evaluate company’s history as well as financial position in order invest and predict the future
cash flow. For this reason, the history of the organization along with ratios has been analyzed
properly in the next section.
Cisco was founded in the year 1984. During 2020, the market capital of the company
accounted to $145 billion, wherein the average quarterly value stood at $12 billion. It has
been observed that the company attained more success in cloud associated products and
software support services within the operational markets. Hence, the decision of investing on
cloud and security may be profitable for Mr. Stark. However, the regression analysis of the
income statement for the last six years provides different results. Each of the variables in
income statement has represented a value, which is higher than 0.05 (p-value). Significant
level has been taken as 95%, which represents that 5% mistake can be made possible in the
regression result. In any circumstance, if the value is lower than 0.05 (p-value) then it will be
treated as null hypothesis (McLeod, 2019). In most of the cases, the value has been found as
greater than 0.05, which means that the performance of the company can be considered as
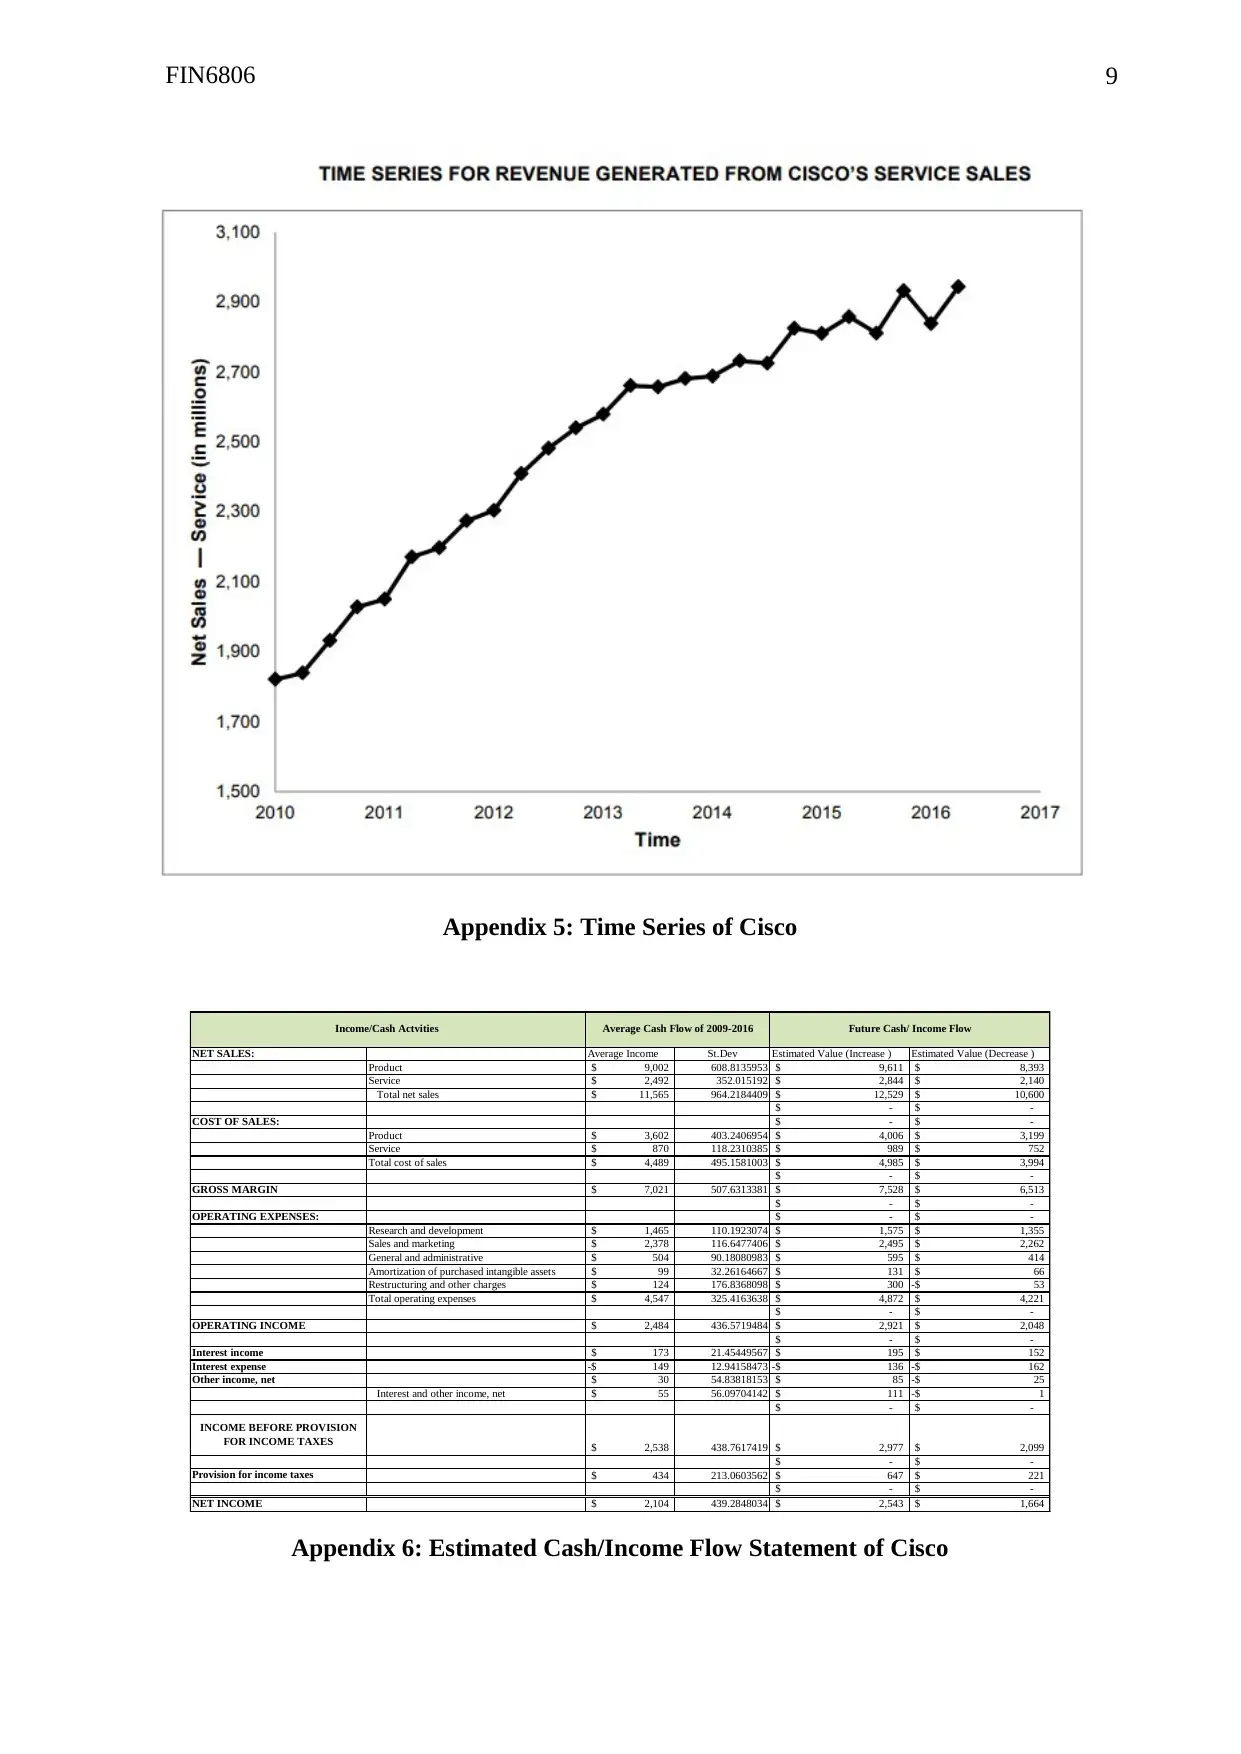
good enough to survive for a longer period (See Appendix 4). In relation to the time series
analysis, it is evident that Cisco has earned its position after each year decrement in the
global business. Moreover, the graph of the revenue or success in time series did not fell
down (See Appendix 5). Based on this trend, it can be predicted that the current situation of
the organization will develop in the year 2020 because every time the company changes its
strategy of business to survive properly within the global market. Hence, the investment of
Mr. Stark can be considered as a partially profitable decision, which may provide good return
on investment to him in the year 2020.
By considering all the data in the income statement for the period of 2009-2016, an
average cash flow and standard deviation values have been determined. Based on these
values, an estimated cash flow or income statement has been created (See Appendix 6). As
per the estimated income statement, the company i.e. Cisco may increase or decrease product
sales at a unit of 608, whereas service will be 352 units. The company will able to make
product sale of highest $12529 million within the global market, whereas $10600 million is
accounted as the lowest amount of sales in one quarter. Based on this estimation, the
company can receive revenue of more than $50000 million within the market. This is the
highest amount, which the company can earn. In 2019, the company sold products of worth
$51900 million, which is higher than the estimation. Hence, there is a great chance of decline
in revenue can be observed. In the same year, the net income of the company stood at
$11,621 million. The estimated calculation reflects $2543 million to be earned by the
company in the first quarter of 2020 (See Appendix 6). Therefore, the difference between
estimated amount and the last year amount is ([2543x4=10172], 11621-10172=1449) $1449.
The standard deviation reflects that current revenue cannot be lower than $439 million;
therefore the company may not face loss in the upcoming year. Chance of profitability can be
considered as positive in any business condition. However, assurance of this profitability can
be measured as a dilemma, wherein Mr. Stark may not receive desired return on investment
due to any financial disaster.
Therefore, Mr. Stark must implement different strategies in order to determine the
cash flow of Cisco. For this reason, the company’s annual report of 2019 has been taken into
concern for calculating FCFF (Free Cash Flow to Firm) (See Appendix 7)
the prevailing market conditions supporting the company are not found as good. Therefore, a
dilemma associated with the investment has been created herein. In one side, the company
has the ability to bounce back within the market and on the other hand, it faces extreme
struggle within the operating markets during the period of 2019-2020. Mr. Stark needs to
evaluate company’s history as well as financial position in order invest and predict the future
cash flow. For this reason, the history of the organization along with ratios has been analyzed
properly in the next section.
Cisco was founded in the year 1984. During 2020, the market capital of the company
accounted to $145 billion, wherein the average quarterly value stood at $12 billion. It has
been observed that the company attained more success in cloud associated products and
software support services within the operational markets. Hence, the decision of investing on
cloud and security may be profitable for Mr. Stark. However, the regression analysis of the
income statement for the last six years provides different results. Each of the variables in
income statement has represented a value, which is higher than 0.05 (p-value). Significant
level has been taken as 95%, which represents that 5% mistake can be made possible in the
regression result. In any circumstance, if the value is lower than 0.05 (p-value) then it will be
treated as null hypothesis (McLeod, 2019). In most of the cases, the value has been found as
greater than 0.05, which means that the performance of the company can be considered as
good enough to survive for a longer period (See Appendix 4). In relation to the time series
analysis, it is evident that Cisco has earned its position after each year decrement in the
global business. Moreover, the graph of the revenue or success in time series did not fell
down (See Appendix 5). Based on this trend, it can be predicted that the current situation of
the organization will develop in the year 2020 because every time the company changes its
strategy of business to survive properly within the global market. Hence, the investment of
Mr. Stark can be considered as a partially profitable decision, which may provide good return
on investment to him in the year 2020.
By considering all the data in the income statement for the period of 2009-2016, an
average cash flow and standard deviation values have been determined. Based on these
values, an estimated cash flow or income statement has been created (See Appendix 6). As
per the estimated income statement, the company i.e. Cisco may increase or decrease product
sales at a unit of 608, whereas service will be 352 units. The company will able to make
product sale of highest $12529 million within the global market, whereas $10600 million is
accounted as the lowest amount of sales in one quarter. Based on this estimation, the
company can receive revenue of more than $50000 million within the market. This is the
highest amount, which the company can earn. In 2019, the company sold products of worth
$51900 million, which is higher than the estimation. Hence, there is a great chance of decline
in revenue can be observed. In the same year, the net income of the company stood at
$11,621 million. The estimated calculation reflects $2543 million to be earned by the
company in the first quarter of 2020 (See Appendix 6). Therefore, the difference between
estimated amount and the last year amount is ([2543x4=10172], 11621-10172=1449) $1449.
The standard deviation reflects that current revenue cannot be lower than $439 million;
therefore the company may not face loss in the upcoming year. Chance of profitability can be
considered as positive in any business condition. However, assurance of this profitability can
be measured as a dilemma, wherein Mr. Stark may not receive desired return on investment
due to any financial disaster.
Therefore, Mr. Stark must implement different strategies in order to determine the
cash flow of Cisco. For this reason, the company’s annual report of 2019 has been taken into
concern for calculating FCFF (Free Cash Flow to Firm) (See Appendix 7)
⊘ This is a preview!⊘
Do you want full access?
Subscribe today to unlock all pages.
Trusted by 1+ million students worldwide

4FIN6806
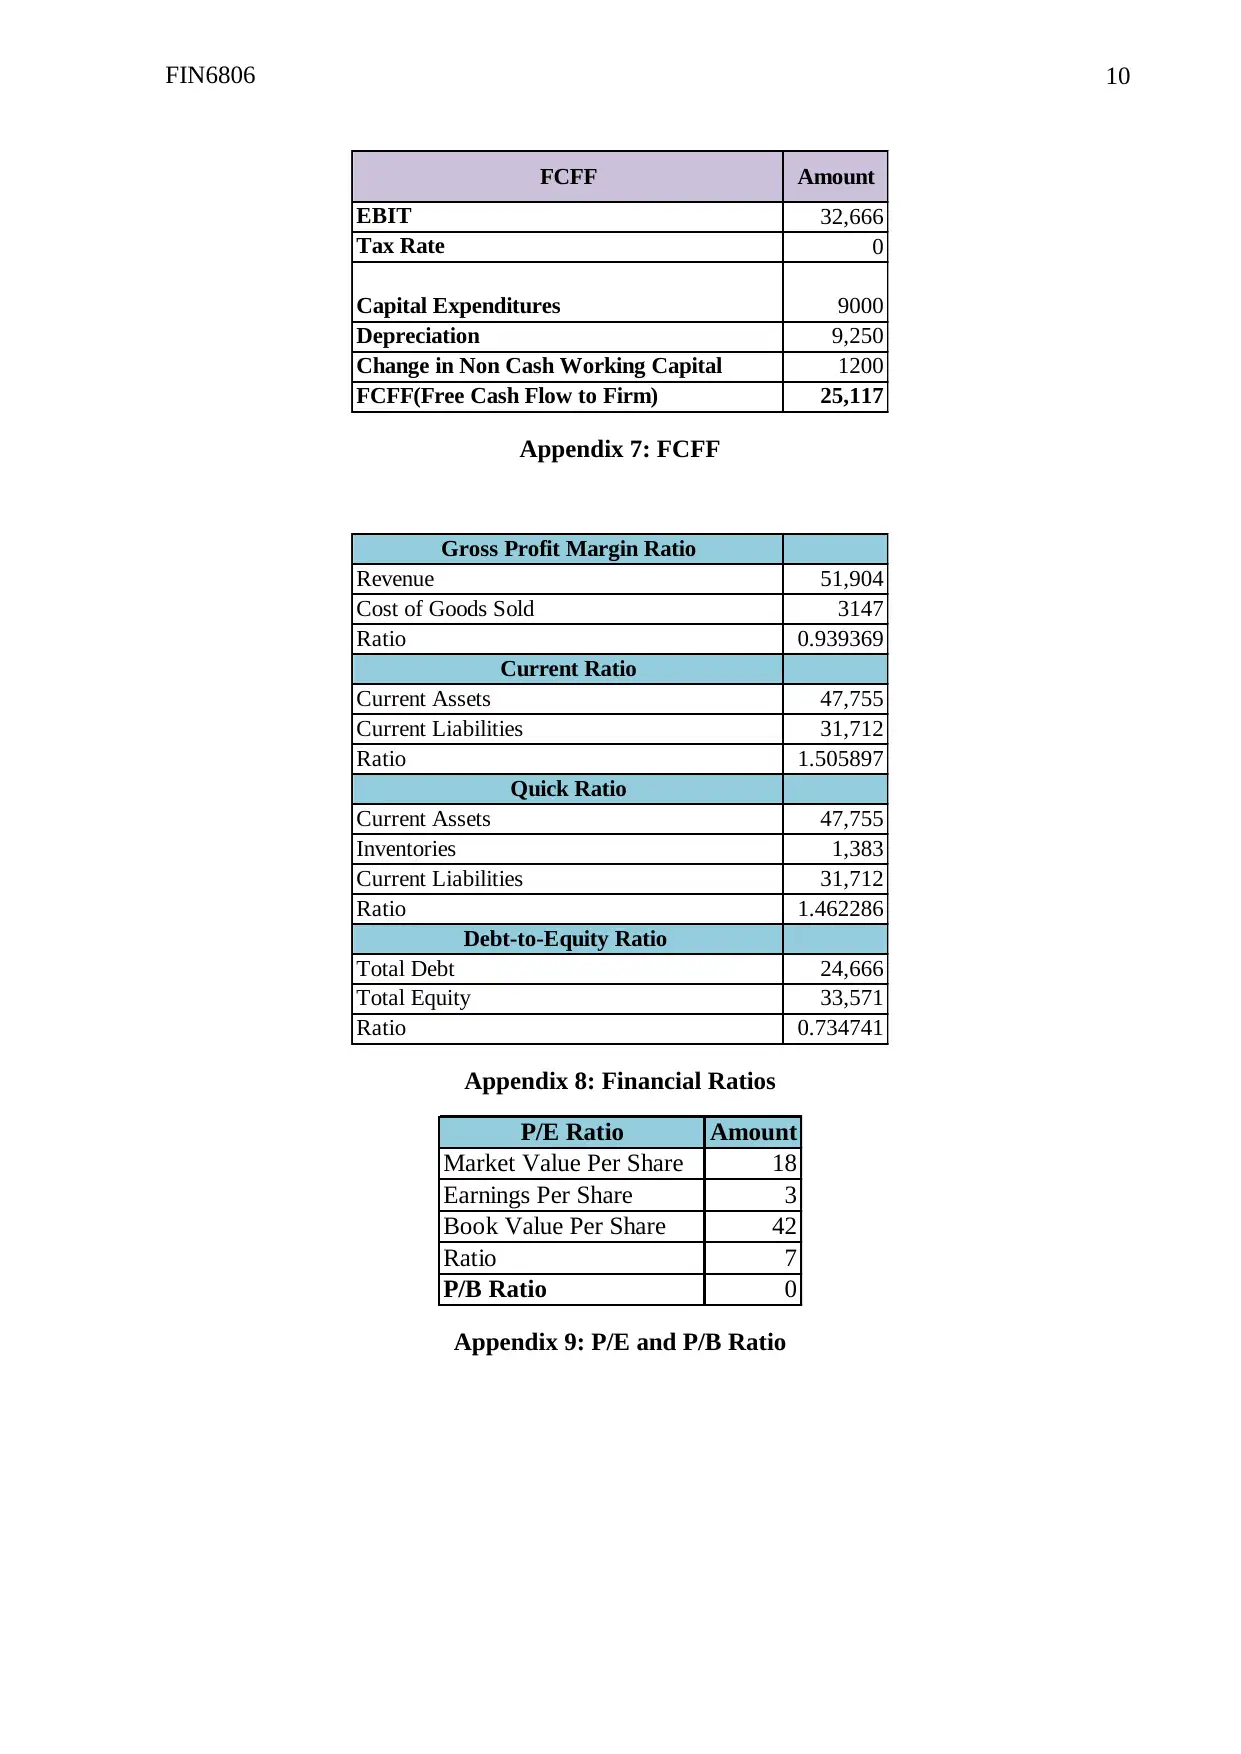
(InvestingAnswers, Inc, 2019). Based on this calculation, it has been apparent that FCFF will
be $25,117 million at the end of the year 2020. Hence, the company has the ability to earn
$25,117 million on the basis of its current business or operational strengths. In the year 2019,
the company earned $11,621 million of revenue, whereas the FCFF shows (25117-
11,621=13496) $13496 million, which is higher than its current earnings. Based on this
obtained values, Mr. Stark can invest money on the business operations of Cisco. A desired
income might appear in the future because the market strength of the company is good
enough to recover current business issues. However, the company did not face any loss in
2019, only business growth has been slowed down for a year. Mr. Stark can invest on the
company’s share due to its capacity to pay dividends to the stakeholders. Four major ratios
have been calculated for Mr. Stark i.e. Gross profit margin ratio, current ratio, quick ratio and
debt-to-equity ratio in order to evaluate Cisco’s monetary strength. Each of the ratios
represents the vital financial pillars of the company.
Gross Profit Margin Ratio represents the percentage of revenue, which becomes profit
in future or the current time. Through this ratio, an organization can understand the feasibility
of the revenue volume in the current time. With regards to Cisco, the Gross Profit Margin
Ratio has been calculated as 0.9%, which can be considered as a bad percentage within the
market. Any organization must have more than 30% Gross Profit Margin Ratio to develop the
business within the market. Hence, Cisco’s performance within the market associated with
profit earning is bad. The company needs to focus on product development and business
expansion to increase its profit margin. On the other hand, Current Ratio is another aspect,
which represents the balance between current assets and liabilities. A company must have
Current Ratio in between 1.5% to 3%. In the case of Cisco, the Current Ratio has been
calculated as 1.50%, which can be considered as a perfect balance between asset and
liabilities. The company does not have any issue associated with current assets. Despite Cisco
faced major issue in revenue management or enhancement, its assets and liabilities
management is deemed as perfect. Even though the company earned less profit in the year
2019, market risk can be considered as quite low. Thus, Mr. Stark can invest his money on
this company. The company may not provide huge amount of return but making investment
in it will not provide major loss to Mr. Stark. A safe investment can be done in Cisco based
on its assets and liability management (WallStreetMojo, 2020; Accounting Tools, 2018).
Besides, Quick Ratio is another major aspect of any organization, which reflects the
organizational power in working capital. Higher percentage of Quick Ratio means an
organization have excess cash in hand. The Quick Ratio must be higher than 1% and less than
1% can be considered as a risk for an organization. In relation to Cisco, Quick Ratio has been
calculated as 1.4%, which is higher than the minimum value. The company has 0.4% excess
cash to use in any kind of financial disaster. Therefore, Mr. Stark can invest on the company
due to low market risk factor. The company will pay the principal amount if any business
difficulty occurs in the future. Apart from this, Debt-to-Equity Ratio is also considered as
another factor, which reflects organizational debt and its effect within any
business/operational market. Lower than 1% Debt-to-Equity Ratio value represents that a
company has lower debts within the market. Investing on this type of company can be
considered as profitable for an investor because of less market risk. With respect to Cisco, the
Debt-to-Equity Ratio has been calculated as 0.73%, which is lower than 1%. It means that the
company has less debt within the operational market. Risks associated with credits and debt
is low; hence the company will definitely receive profit in the next fiscal year. Most
importantly, the company has enough cash to reduce market debts in an effective manner.
Mr. Stark can safely invest money on the organization because it will provide minimum
Paraphrase This Document
Need a fresh take? Get an instant paraphrase of this document with our AI Paraphraser

5FIN6806
return to him. Chance of loss can be considered as low herein (WallStreetMojo, 2020;
Accounting Tools, 2018).
Apart from the above discussed ratios, two more ratios need to be determined by Mr.
Stark in order to invest on Cisco. It has been found that Cisco is a part of S&P 500; hence the
P/E of S&P 500 is 14 to 30. An investor can receive proper return within this range of P/E. In
relation to Cisco, P/E is calculated as 7. Hence, this volume of P/E is very low, which needs
to be increased to at least 14 so as to provide adequate return to Mr. Stark. As per the values
retrieved from the financial ratios, it became clear that the company maintains a proper
stability in its business with the preservation of a strong financial background. Therefore, the
P/E of the company will definitely increase in upcoming time based on the current revenue
and business operations. In relation to the profit, Mr. Stark can receive more than 100%
earning from the market. In any circumstance, if the P/E value of Cisco gets reduced below 7,
the entire share market may face major financial disaster (See Appendix 9). Therefore, the
chance of P/E increment is too high because the company will receive more profit in
upcoming time. This is the prime moment, wherein Mr. Stark can invest money on Cisco and
he will not disappoint because 1% revenue increment will change the company’s graph in
share market. The current value 7 will definitely increase, which will provide desired return
to Mr. Stark’s investment. Additionally, the company will focus on revenue management
because the revenue percentage has been decreased badly in past two years i.e. 2018 and
2019.
To conclude, Cisco maintained a balanced business operation in the year 2019. The
financial background of the company has become properly stabilized in the recent years.
However, profit volume of Cisco turned to be low as compared to the performance in the year
2015. It certainly caused the company to reduce its P/E within the share market. Therefore,
the company will definitely focus on revenue development, which can be considered as a
prime moment for Mr. Stark to make significant investments. It will also provide good return
on investment. On the other hand, the company always tried to develop its business market
condition, when faced market issues in past decades. The time series analysis clearly
highlighted that Cisco witnessed approximately $1000 million growth within 7 years i.e.
2010 to 2017. Based on the current scenario, the company will surely gain profit in 2020 as
well as 2021. In order to make a decision, Mr. Stark should definitely invest money on this
organization because he is entitled to receive a huge profit in the future. Through the FCFF
calculation, the net profit is calculated as $25,117 million, which is way higher than the 2019
profit value. Overall, investing on Cisco is profitable for Mr. Stark. He needs to think about
the money volume. However, risk still exists due to any kind of financial crisis in the market
but the chance of profit is high on the basis of Cisco’s current financial condition and cash
flow.

6FIN6806
References
Cisco. (2019). Defining the future of the internet. 2019 Annual Report, 1-112.
Cisco. (2015). Cisco reports fourth quarter and fiscal year 2015 earning. The Network,
Cisco’s technology news site, 1-11.
McLeod, S. (2019). What a p-value tells you about statistical significance. Retrieve from
https://www.simplypsychology.org/p-value.html
InvestingAnswers, Inc. (2019). Free cash flow to the firm (FCFF). Retrieved from
https://investinganswers.com/dictionary/f/free-cash-flow-firm-fcff
Accounting Tools. (2018). Ratio analysis. Retrieved from
https://www.accountingtools.com/articles/ratio-analysis.html
WallStreetMojo. (2020). Ratio analysis. Retrieved from
https://www.wallstreetmojo.com/ratio-analysis/
Duffy, J. (2011). 30 Events that Shaped Cisco in 2011. CIO, 1-4.
⊘ This is a preview!⊘
Do you want full access?
Subscribe today to unlock all pages.
Trusted by 1+ million students worldwide

7FIN6806
Appendices
Appendix 1: Revenue Trend of Cisco
Appendix 2: Profit Margins and Operating Cash Flow
Appendices
Appendix 1: Revenue Trend of Cisco
Appendix 2: Profit Margins and Operating Cash Flow
Paraphrase This Document
Need a fresh take? Get an instant paraphrase of this document with our AI Paraphraser

8FIN6806
Appendix 3: Share Repurchases and Dividends paid per Share
You explain 50% of the variability
of Product sales with just 1
variable (time trend) - impressive!
F is a tool used to
see if Sept 2 figure
is statistically
significant
P is the chance you made a mistake in
inferring R2 is significant. Require P<0/05 to
infer significance (5% chance you make
mistake or 95% chance you did not make a
mistake
Step 5
(possible
mistake in
estimating the
slope)
Step 2 Step 3 Step 4 Intercept slope std error
0.499701516 23.97136267 5.41076E-05 -444096.4222 225.0721368 439.5044926
0.941284419 384.7501073 2.78263E-16 -357070.8615 178.6092308 87.05675426
0.72145255 62.16126275 4.08089E-08 -801167.2838 403.6813675 489.5158252
0.523875785 26.40701402 2.92566E-05 -303675.4325 152.637265 283.9807315
0.952251131 478.6297106 2.31558E-17 -120597.0274 60.33777778 26.3680146
0.67037951 48.81100763 3.18008E-07 -424272.4598 212.9750427 291.4457815
0.516023199 25.58915378 3.58372E-05 -376894.8239 190.7063248 360.4334432
0.528594201 26.9115502 2.58595E-05 -82880.92137 41.89811966 77.21703494
0.154741469 4.393679697 0.046795707 -45931.34017 23.99726496 109.4549725
0.016129618 0.393457148 0.536410243 12562.5641 -5.98974359 91.29509774
0.329769718 11.80858797 0.002155789 19603.52137 -9.688888889 26.95646485
0.041906037 1.049735137 0.315784813 48109.7688 -23.8277118 178.1100867
0.117946587 3.209236602 0.08584382 -113877.6906 58.82119658 313.9214073
0.333669016 12.01813602 0.002000291 -263017.1333 131.8851282 363.7183519
0.623375016 39.72386596 1.62646E-06 -17660.72479 8.858803419 13.43808107
0.060664778 1.549984128 0.225157573 -3505.165812 1.667008547 12.80153792
0.017132579 0.418349289 0.523900127 7586.846154 -3.753846154 55.48746682
0.051958635 1.315351096 0.262733753 -13579.04444 6.771965812 56.45232817
0.365142654 13.80376826 0.001078137 -276596.1778 138.657094 356.8052289
0.031186027 0.772557656 0.388142645 -39178.44786 19.67726496 214.0361986
0.268219412 8.796715825 0.006728078 -237417.7299 118.9798291 383.5314704
Appendix 4: Regression Analysis of Six Years Income Statement of Cisco
9FIN6806
Appendix 5: Time Series of Cisco
NET SALES: Average Income St.Dev Estimated Value (Increase ) Estimated Value (Decrease )
Product 9,002$ 608.8135953 9,611$ 8,393$
Service 2,492$ 352.015192 2,844$ 2,140$
Total net sales 11,565$ 964.2184409 12,529$ 10,600$
-$ -$
COST OF SALES: -$ -$
Product 3,602$ 403.2406954 4,006$ 3,199$
Service 870$ 118.2310385 989$ 752$
Total cost of sales 4,489$ 495.1581003 4,985$ 3,994$
-$ -$
GROSS MARGIN 7,021$ 507.6313381 7,528$ 6,513$
-$ -$
OPERATING EXPENSES: -$ -$
Research and development 1,465$ 110.1923074 1,575$ 1,355$
Sales and marketing 2,378$ 116.6477406 2,495$ 2,262$
General and administrative 504$ 90.18080983 595$ 414$
Amortization of purchased intangible assets 99$ 32.26164667 131$ 66$
Restructuring and other charges 124$ 176.8368098 300$ 53-$
Total operating expenses 4,547$ 325.4163638 4,872$ 4,221$
-$ -$
OPERATING INCOME 2,484$ 436.5719484 2,921$ 2,048$
-$ -$
Interest income 173$ 21.45449567 195$ 152$
Interest expense 149-$ 12.94158473 136-$ 162-$
Other income, net 30$ 54.83818153 85$ 25-$
Interest and other income, net 55$ 56.09704142 111$ 1-$
-$ -$
INCOME BEFORE PROVISION
FOR INCOME TAXES 2,538$ 438.7617419 2,977$ 2,099$
-$ -$
Provision for income taxes 434$ 213.0603562 647$ 221$
-$ -$
NET INCOME 2,104$ 439.2848034 2,543$ 1,664$
Future Cash/ Income FlowAverage Cash Flow of 2009-2016Income/Cash Actvities
Appendix 6: Estimated Cash/Income Flow Statement of Cisco
⊘ This is a preview!⊘
Do you want full access?
Subscribe today to unlock all pages.
Trusted by 1+ million students worldwide
10FIN6806
FCFF Amount
EBIT 32,666
Tax Rate 0
Capital Expenditures 9000
Depreciation 9,250
Change in Non Cash Working Capital 1200
FCFF(Free Cash Flow to Firm) 25,117
Appendix 7: FCFF
Gross Profit Margin Ratio
Revenue 51,904
Cost of Goods Sold 3147
Ratio 0.939369
Current Ratio
Current Assets 47,755
Current Liabilities 31,712
Ratio 1.505897
Quick Ratio
Current Assets 47,755
Inventories 1,383
Current Liabilities 31,712
Ratio 1.462286
Debt-to-Equity Ratio
Total Debt 24,666
Total Equity 33,571
Ratio 0.734741
Appendix 8: Financial Ratios
P/E Ratio Amount
Market Value Per Share 18
Earnings Per Share 3
Book Value Per Share 42
Ratio 7
P/B Ratio 0
Appendix 9: P/E and P/B Ratio
1 out of 10
Related Documents


Your All-in-One AI-Powered Toolkit for Academic Success.
+13062052269
info@desklib.com
Available 24*7 on WhatsApp / Email
![[object Object]](/_next/static/media/star-bottom.7253800d.svg)
Unlock your academic potential
Copyright © 2020–2026 A2Z Services. All Rights Reserved. Developed and managed by ZUCOL.