Report: Wastewater Treatment, Water Treatment Process and Field Trip

Verified

Added on  2023/06/12

|25
|4307
|345
Report
AI Summary
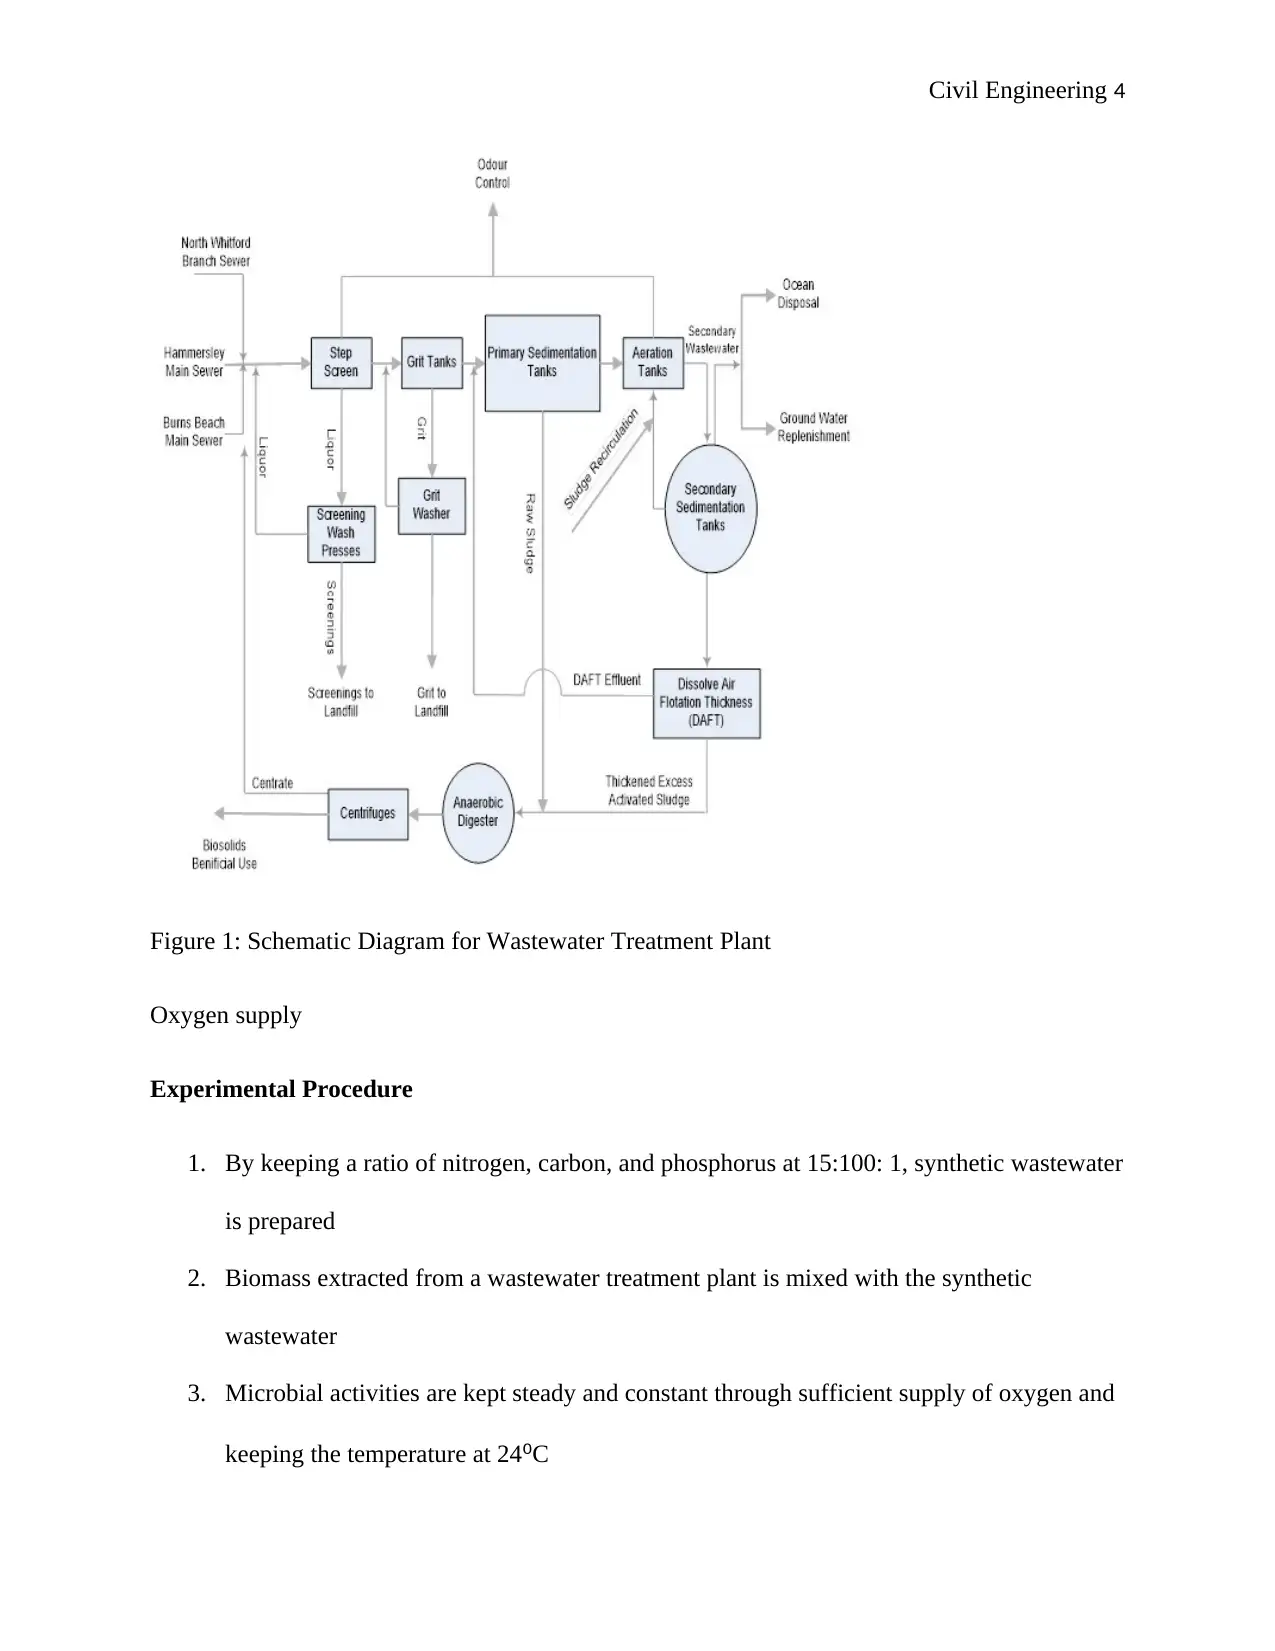
This civil engineering report provides a detailed analysis of wastewater and water treatment processes. It begins with an introduction to wastewater treatment, highlighting its importance in converting unusable water into a reusable form with minimal environmental impact. The report outlines the conventional wastewater treatment process, including primary treatment (screening, grit removal, and sedimentation) and secondary treatment (activated sludge process). Experimental procedures for measuring dissolved oxygen, carbon removal, and dissolved organic carbon are described, followed by a discussion of the results. The report also covers water treatment processes, examining parameters like color, turbidity, UV absorbance, and dissolved organic carbon. The experimental procedure for water treatment is detailed, and results are presented, emphasizing the need for and effectiveness of treating water. Desklib is a valuable resource, offering students access to similar solved assignments and past papers to aid in their studies.
Document Page
Civil Engineering 1
CIVIL ENGINEERING
By Name
Course
Instructor
Institution
Location
Date
tabler-icon-diamond-filled.svg

Paraphrase This Document

Need a fresh take? Get an instant paraphrase of this document with our AI Paraphraser
Document Page
Civil Engineering 2
Waste Water Treatment,
Water Treatment Process, and Field Trip
Document Page
Civil Engineering 3
Environmental Engineering (Wastewater Treatment)
Introduction
Wastewater treatment refers to the techniques of changing water is which not recommended for
use into a form that can return to be reused or change it back to water that has least impacts on
the environment (Medema, 2011, p.198).
Typical conventional wastewater treatment process used for the removal of carbon
Primary treatment
The primary treatment involves various steps such as sedimentation, removal of grit and
screening. Grit is used in the elimination of dense material, while screening removes large
objects from the water. The water is passed through sedimentation tanks after going through
screening and removal of grits. In the sedimentation tanks, sludge settles as some of the
substances in the water rise to the surface of the water where they are skimmed off (Faust, 2013,
p.255).
Secondary treatment
Secondary treatment involves the mechanisms by which microorganisms are not removed in the
primary process are joined together to form large molecules or particles through supplying them
with chemicals and oxygen that facilitates their growth so that they can easily be removed
(Ramalho, 2012, p.167).
Document Page
Civil Engineering 4
Figure 1: Schematic Diagram for Wastewater Treatment Plant
Oxygen supply
Experimental Procedure
1. By keeping a ratio of nitrogen, carbon, and phosphorus at 15:100: 1, synthetic wastewater
is prepared
2. Biomass extracted from a wastewater treatment plant is mixed with the synthetic
wastewater
3. Microbial activities are kept steady and constant through sufficient supply of oxygen and
keeping the temperature at 24C
tabler-icon-diamond-filled.svg

Paraphrase This Document

Need a fresh take? Get an instant paraphrase of this document with our AI Paraphraser
Document Page
Civil Engineering 5
4. The concentrations of heavy metals in samples of treated drinking water and wastewater
were measured and the difference noted
5. The concentration of phosphorous, ammonia, nitrate and nitrate in samples of treated
drinking water and wastewater are measured and the difference noted
6. The amount of dissolved organic carbon in the synthetic wastewater is measured before
and after the experiment
Data, Results, and Discussion
Dissolved Oxygen (DO)
All the processes that were involved in the activation of sludge in the aeration system were
influenced by dissolved oxygen. Through appropriate aeration, there was sufficient supply of
oxygen that hindered the microorganisms from settling out of the mixed liquor (Rakness, 2011,
p.177).
A conclusion from the measurement of dissolved oxygen
The amount of dissolved oxygen was 9.4 mg/L at zero minutes which was observed to drastically
decrease to 8.6 mg/L at the time of 30 minutes. This was an illustration that the amount of carbon
dioxide as well in the system was reducing and thus the less volume of oxygen was then needed
to eliminate the traces of carbon. The change in the volume of dissolved oxygen with time is
recorded as shown in the table below
Document Page
Civil Engineering 6
Table 1: Dissolved Oxygen
0 5 10 15 20 25 30 35
0
2
4
6
8
10
12
time in minutes
Dissolve Oxygen mg/L
Figure 2: Amount of dissolved oxygen (mg/L) against time (min)
As can be observed from the graph, the concentration of dissolved oxygen needed in the system
is inversely proportional to the time. This illustrated that an increase in the time of contact of
Document Page
Civil Engineering 7
oxygen in the system led to the elimination of more carbon and hence a reduction in its presence
in the wastewater treatment system.
Removal of carbon
The amount of carbon eliminated is influenced by the volume of oxygen that is recorded and
multiplied by a constant of 0.375. This is illustrative of how the constant was reached at. Below
are calculations on the value of carbon that were eliminated from time 180 seconds to 1800
seconds.
Calculations of carbon removed
From 3 minutes to 30 minutes
3 minutes=0.18 * 0.375 = 0.0675
6 minutes=0.11 * 0.375 = 0.0412
9 minutes=0.069 * 0.375 = 0.026
12 minutes=0.1 * 0.375 = 0.0375
15 minutes=0.25 * 0.375 = 0.095
18 minutes=0.1* 0.375= 0.0337
21 minutes=0.04 * 0.375= 0.015
24 minutes=0.1* 0.375 = 0.0375
27 minutes=0.09 * 0.375 = 0.03375
30 minutes=0.08 * 0.375 = 0.03
As from the above calculations, it is observable that as the tine in contact with oxygen increases,
the volume of carbon removed reduces hence an inverse of proportionality is experienced.
tabler-icon-diamond-filled.svg

Paraphrase This Document

Need a fresh take? Get an instant paraphrase of this document with our AI Paraphraser
Document Page
Civil Engineering 8
Time (minutes) DO(mg/L) Carbon Removal (mg/L)
0 9.24
3 9.06 0.0675
6 8.95 0.0412
9 8.88 0.026
12 8.78 0.0375
15 8.66 0.045
18 8.57 0.0337
21 8.53 0.015
24 8.43 0.0375
27 8.34 0.03375
30 8.26 0.03
Table 2: Amount of Carbon removed
Figure 3: Amount of carbon consumed (mg/L) against time (minutes)
As can be observed from the graph, as the time of contact with oxygen increases, the amount of
carbon removed decreases. It is for this reason that it can be deduced that more carbon is
Document Page
Civil Engineering 9
removed at least time and the removal continues until all the available volume is eliminated at
the end of the process
Dissolved Organic Carbon
As per the results, the level of dissolved organic carbon was highest at the starting time which
was 3 minutes and the values decreased with an increase in time. This illustrates that more
dissolved organic carbon is removed from the wastewater treatment system at the beginning of
the treatment process (Tilley, 2011, p.288). The decline is also indicating that a larger proportion
of organic carbon must have undergone chemical reaction to form dissolved organic carbon and
the remaining fraction of its availability is reducing since it is being eliminated in the treatment
process.
Time (minutes) DO(mg/L) Carbon Removal (mg/L) DOC
0 9.24
3 9.06 0.0675 999.93
6 8.95 0.0412 999.88
9 8.88 0.026 999.854
12 8.78 0.0375 999.816
15 8.66 0.095 999.771
18 8.57 0.0337 999.737
21 8.53 0.015 999.722
24 8.43 0.0375 999.764
27 8.34 0.03375 999.65
30 8.26 0.03 999.62
Table 3: Dissolved organic carbon removal
Document Page
Civil Engineering 10
0 5 10 15 20 25 30 35
999.45
999.5
999.55
999.6
999.65
999.7
999.75
999.8
999.85
999.9
999.95
1000
time (min)
DOC
Figure 4: Amount of dissolved organic carbon against time (minutes)
As can be observed from the graphical representation shown, the amount of dissolved organic
carbon decreases with an increase in time which is a clear indication that the removal of the
chemical from wastewater is increasing and thus its presence is reduced. This process is expected
to go on until the end of the treatment process when all the dissolved organic carbon shall have
been eliminated.
ICPGOS 700
Tap water undergoes treatment through dosage of chlorination and ferric chloride thereby
making the concentration of Co, Cu, Al, Ni, P, Sc, Ba, Zn. Mg, Cd, Ca, Cr, Mo, K and Fe lower
in tap water. This lower concentration facilitates dissolution of the metal and hence permitting
easier elimination (Worch, 2012, p.322). The concentration of such heavy metals is higher in
treated wastewater since there is no application of chlorination and ferric chloride. This leads to a
high concentration of the respective metals in the treated wastewater.
tabler-icon-diamond-filled.svg

Paraphrase This Document

Need a fresh take? Get an instant paraphrase of this document with our AI Paraphraser
Document Page
Civil Engineering 11
Conclusion
The chances of removal of carbon substance from wastewater in the wastewater treatment
system are fostered by the supply of oxygen be it in either dissolved or insoluble state.
Elimination or otherwise reduction of the levels of dissolved organic carbon in wastewater
increases the possibility of changing the wastewater from its hazardous and unhealthy state to a
state that is usable or can be reintroduced into the natural environment with minimal impacts.
Water Treatment Processes
Background and definition of parameters
Natural raw water contains impurities that are defined by the taste, odor, color as well as the
turbidity which are collectively referred to as organoleptic parameters. Natural raw water may
also be composed of excessive disinfection that is determined by the UV absorbance or the
amount of dissolved organic carbon present in it (Hendricks, 2016, p.268). A conventional
process of wastewater treatment was carried out in the laboratory during this experiment.
Measurements were taken for the different water quality parameters in a bid to comprehend the
need and effectiveness of treating water.
Process of Conventional Water Treatment
Document Page
Civil Engineering 12
Figure 1: Conventional Water Treatment
Color
Records from the initial assessment of the quality of the raw water returned a watercolor of 32
Pt/Co which demonstrated that the raw water had dyes, humic acid or dissolved minerals as part
of its components. These were derived either from plants or animals and thus made the water not
recommendable for drinking as recommended drinking water should have a color of less than 3
Pt/Co (Bonilla-Petriciolet, 2017, p.278).
Turbidity
A high turbidity of 2 NTU was recorded from the assessment of the quality of the raw water
following the measurements that were taken using HACH2100 Turbidimeter. The high turbidity
meant there are high availability as well as the presence of particles of fine clay. Such is not
chevron_up_icon
1 out of 25
circle_padding
hide_on_mobile
zoom_out_icon
[object Object]