Civil Service Fast Stream: Cloud Computing Data Storage System Project
VerifiedAdded on 2021/05/31
|18
|1961
|74
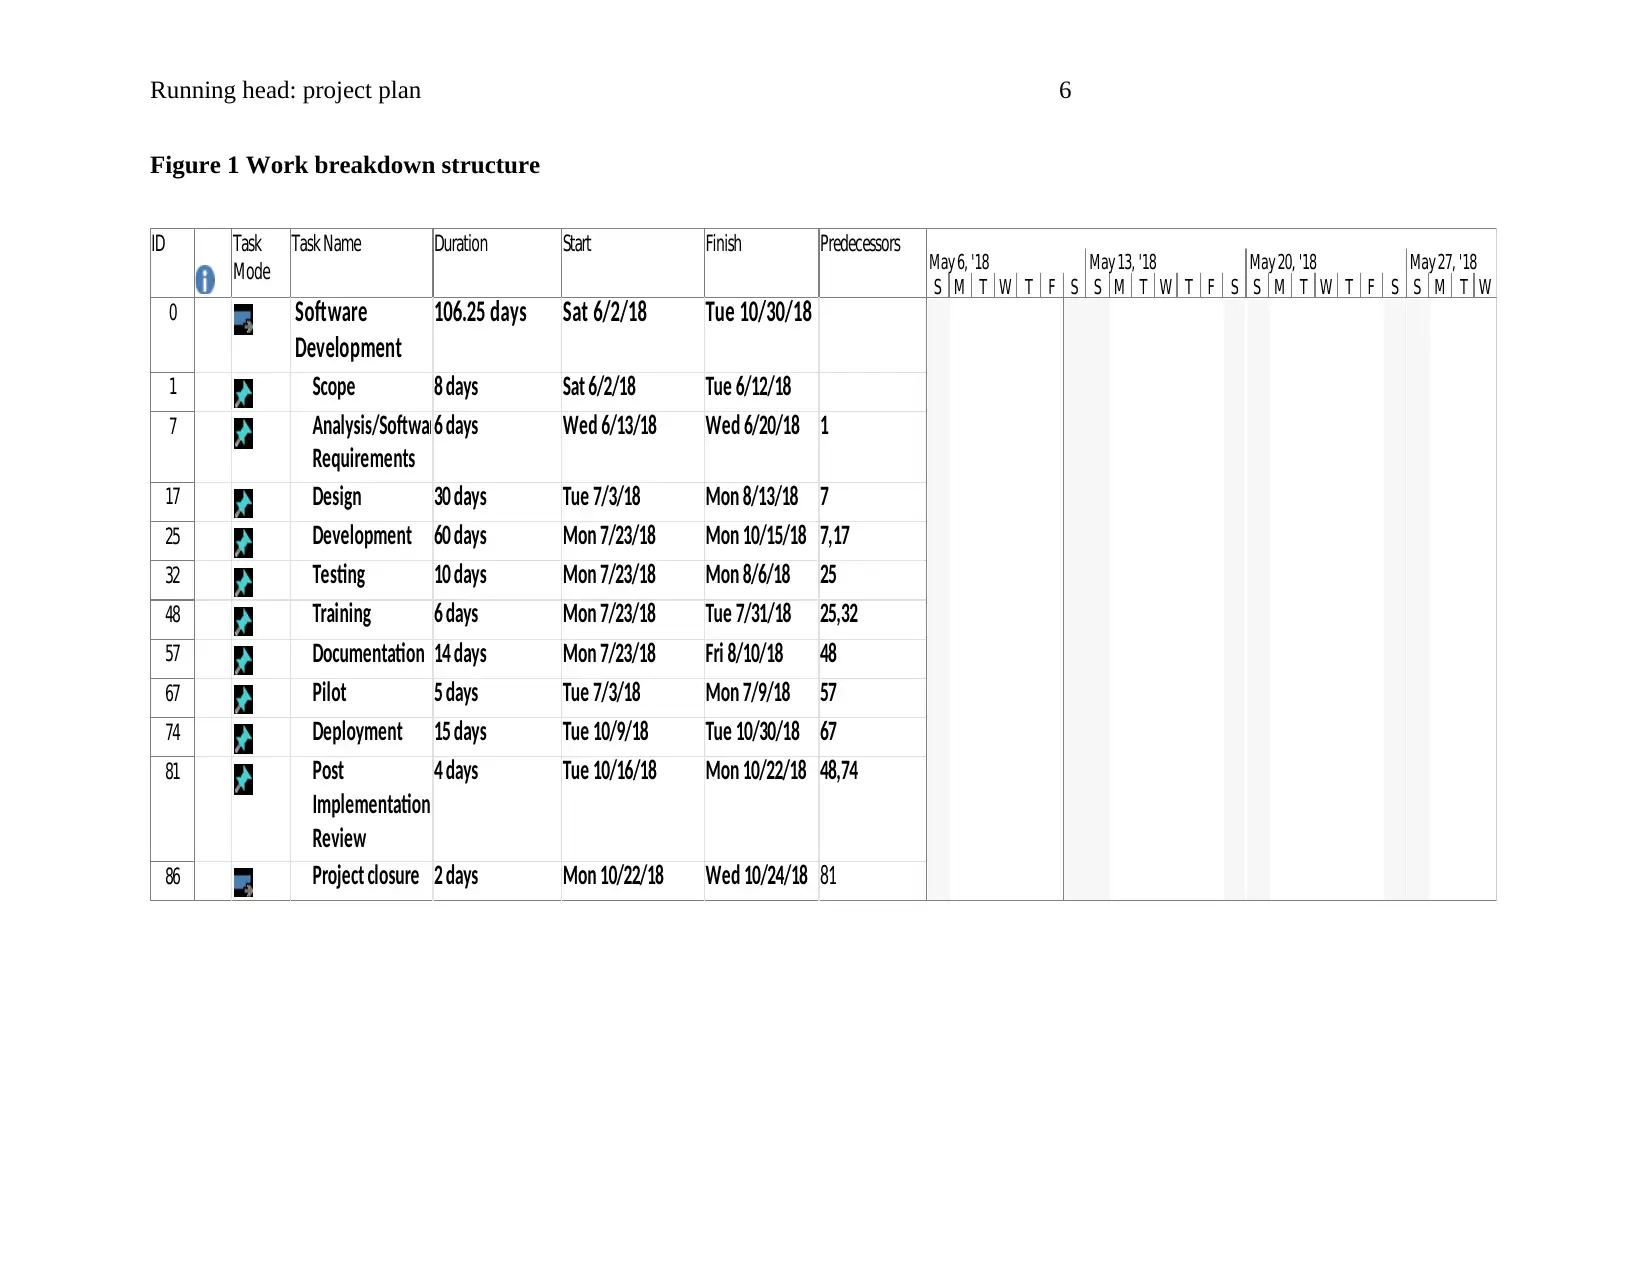
Project
AI Summary
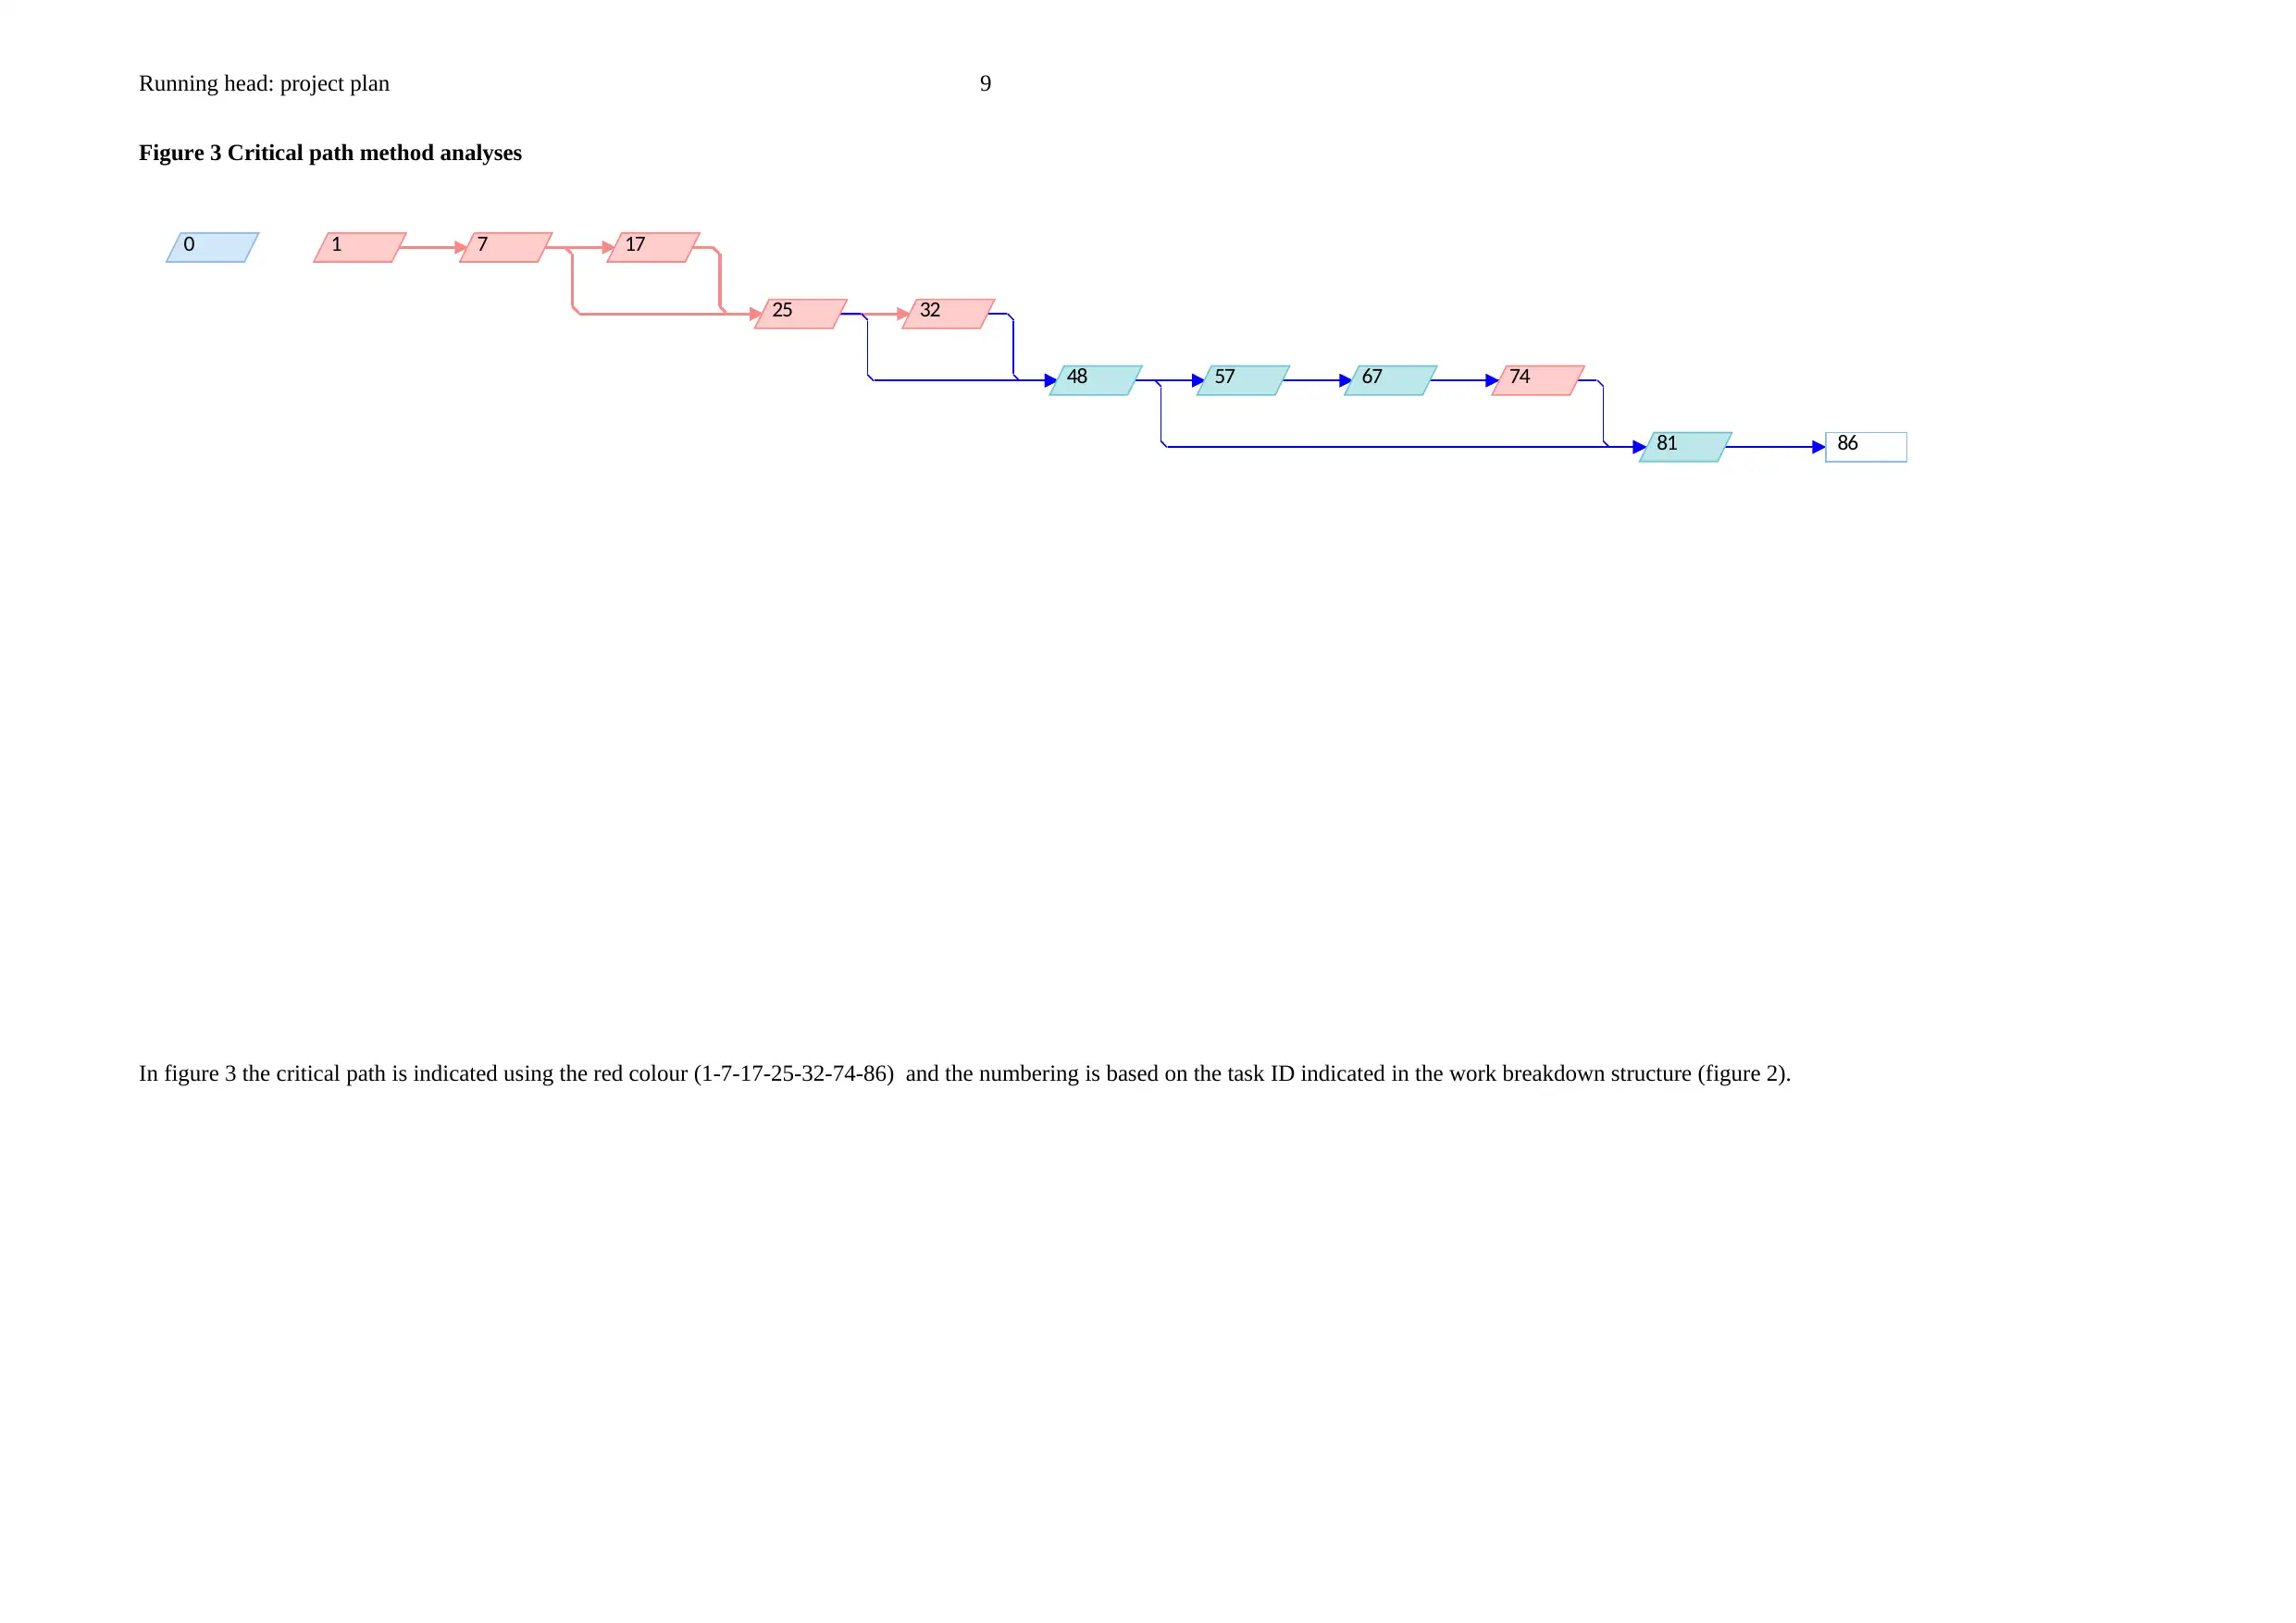
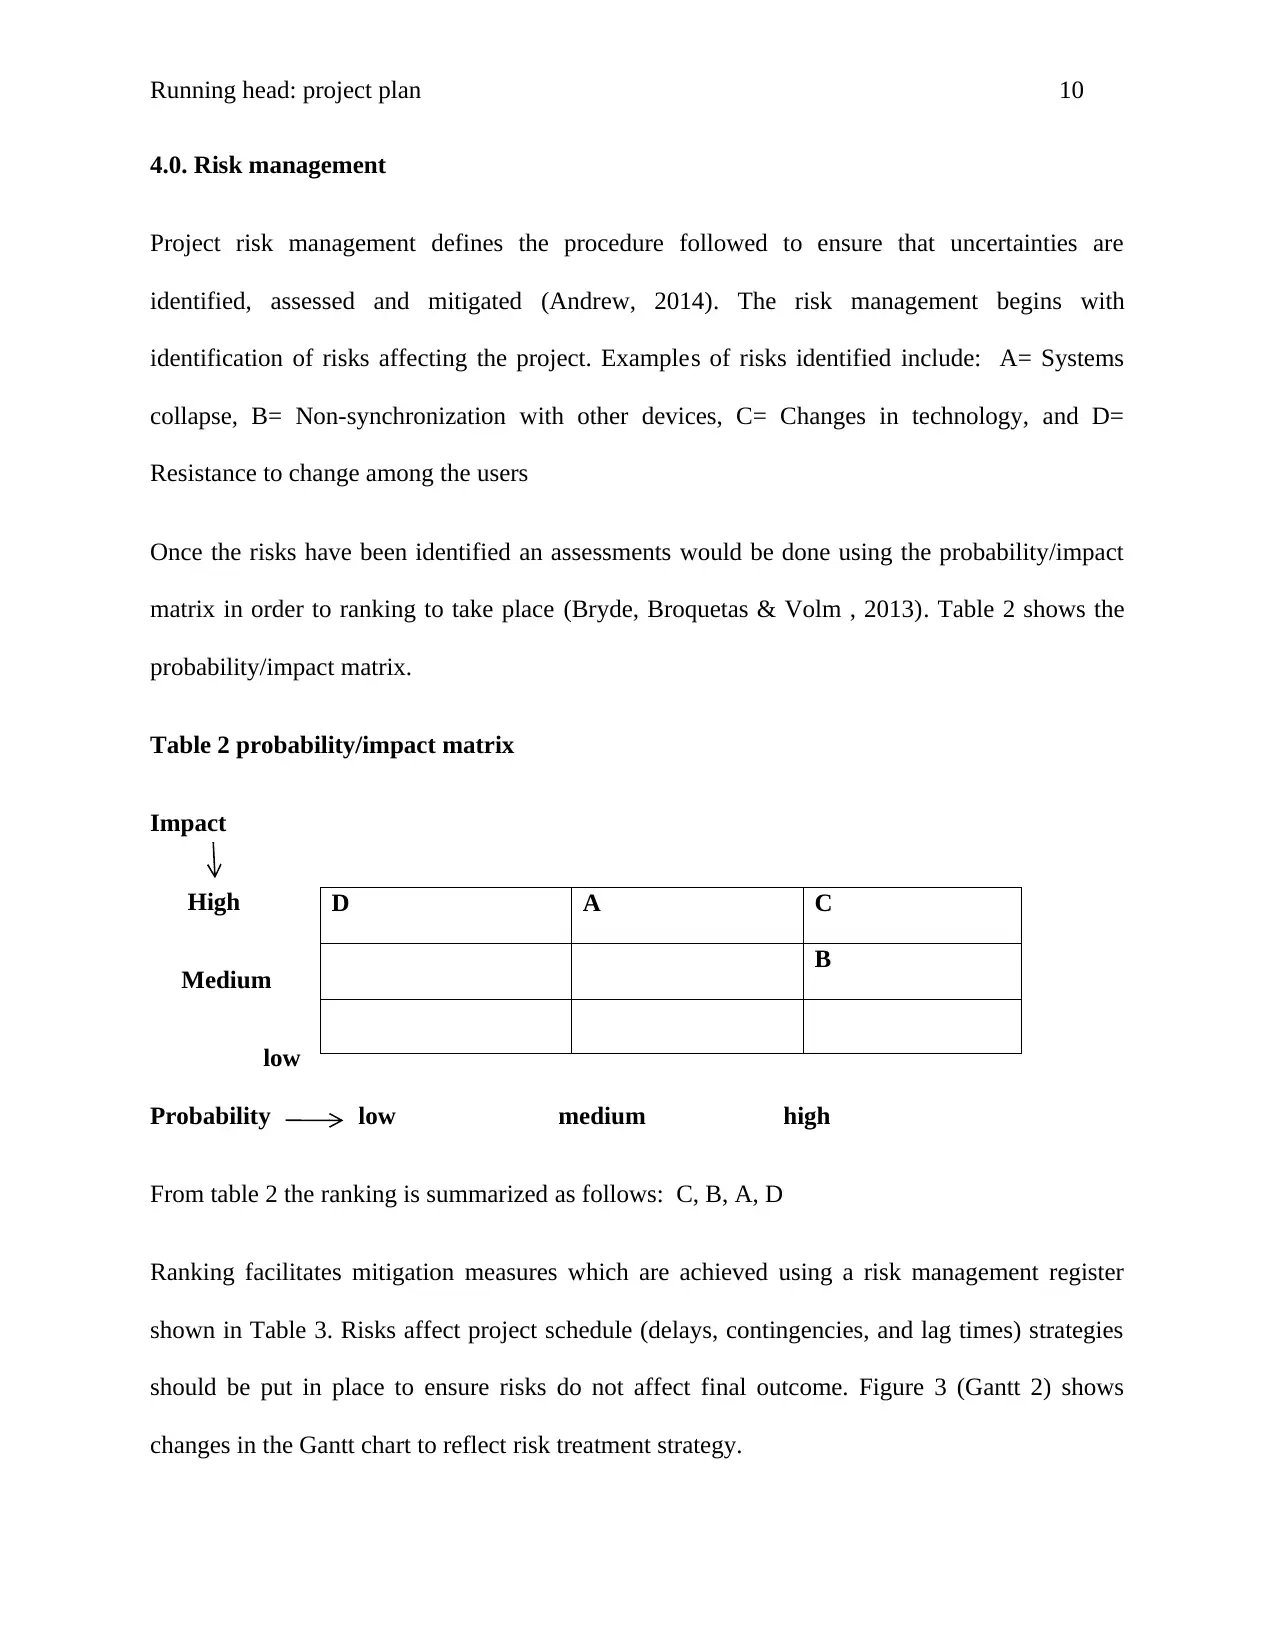
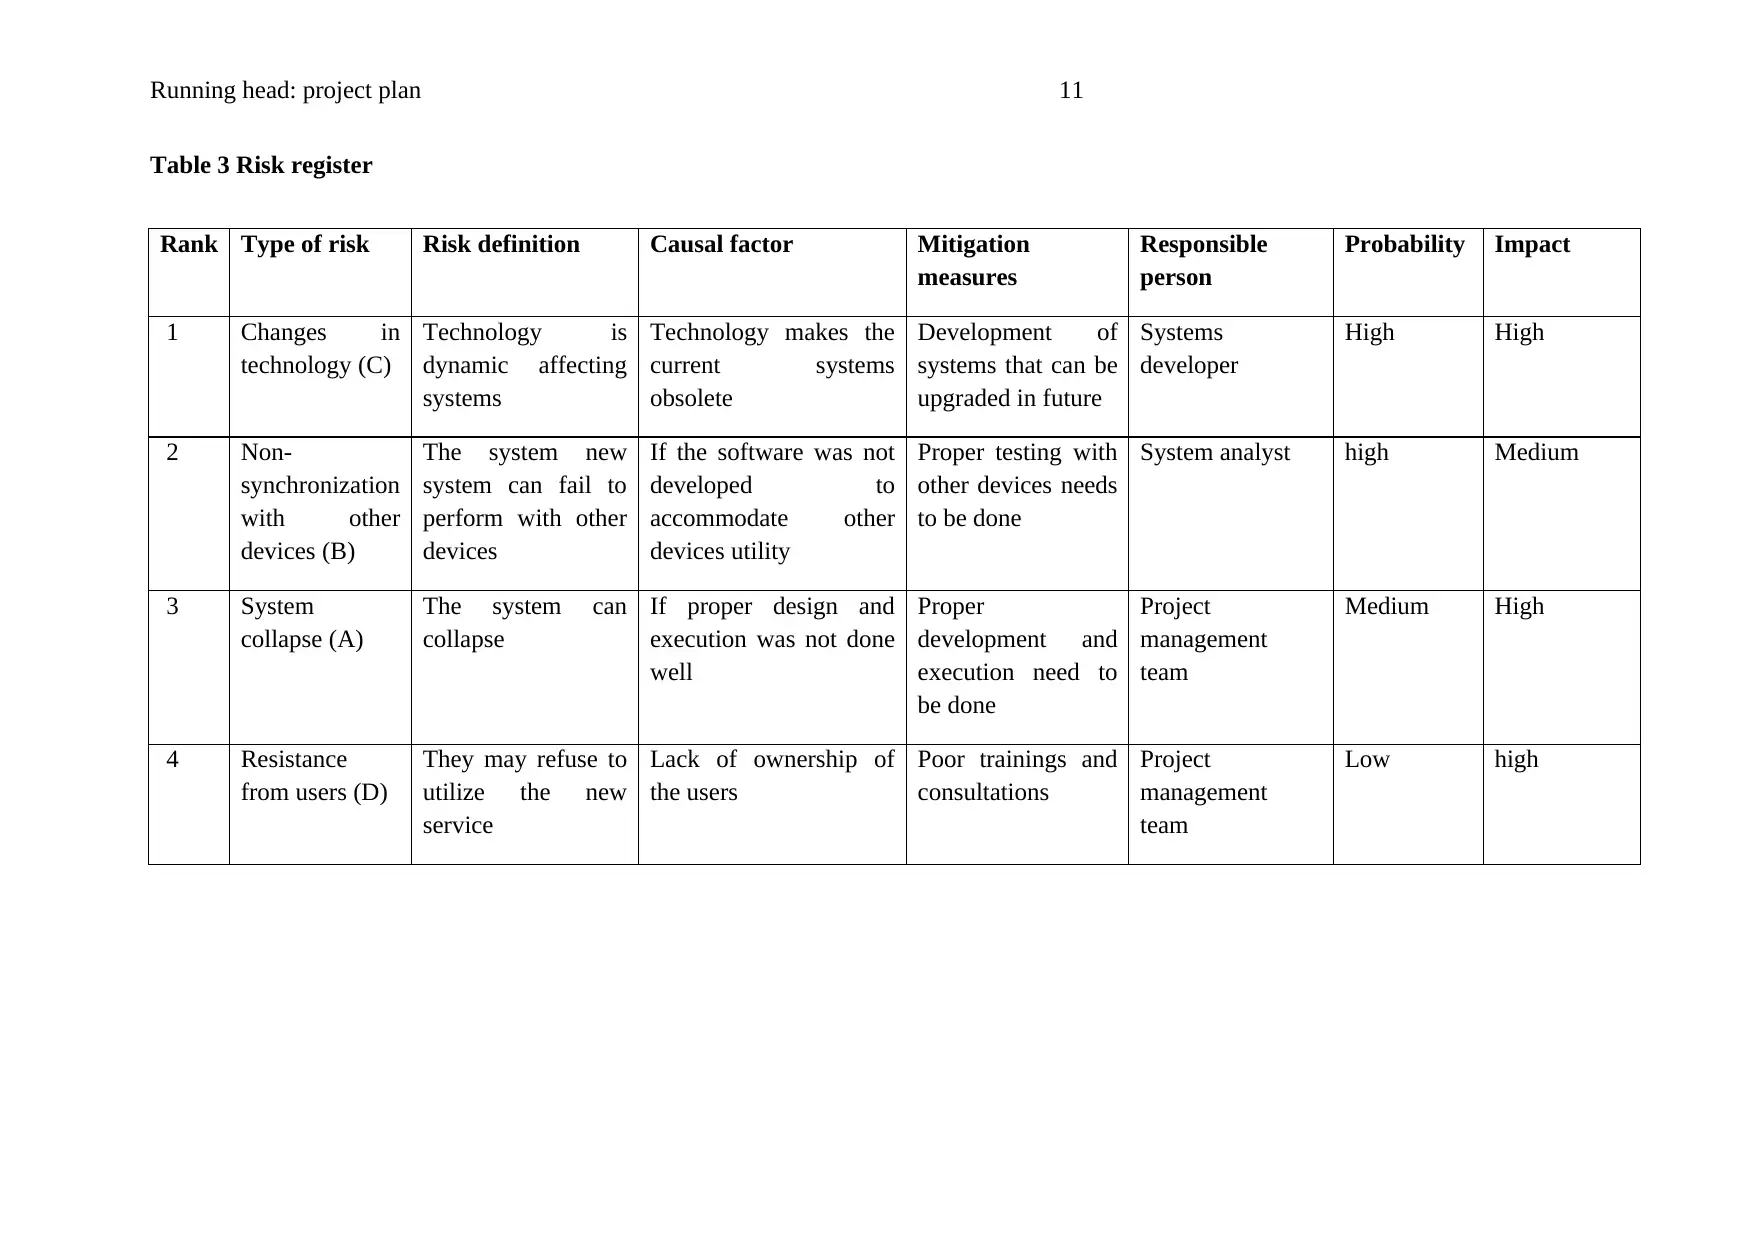
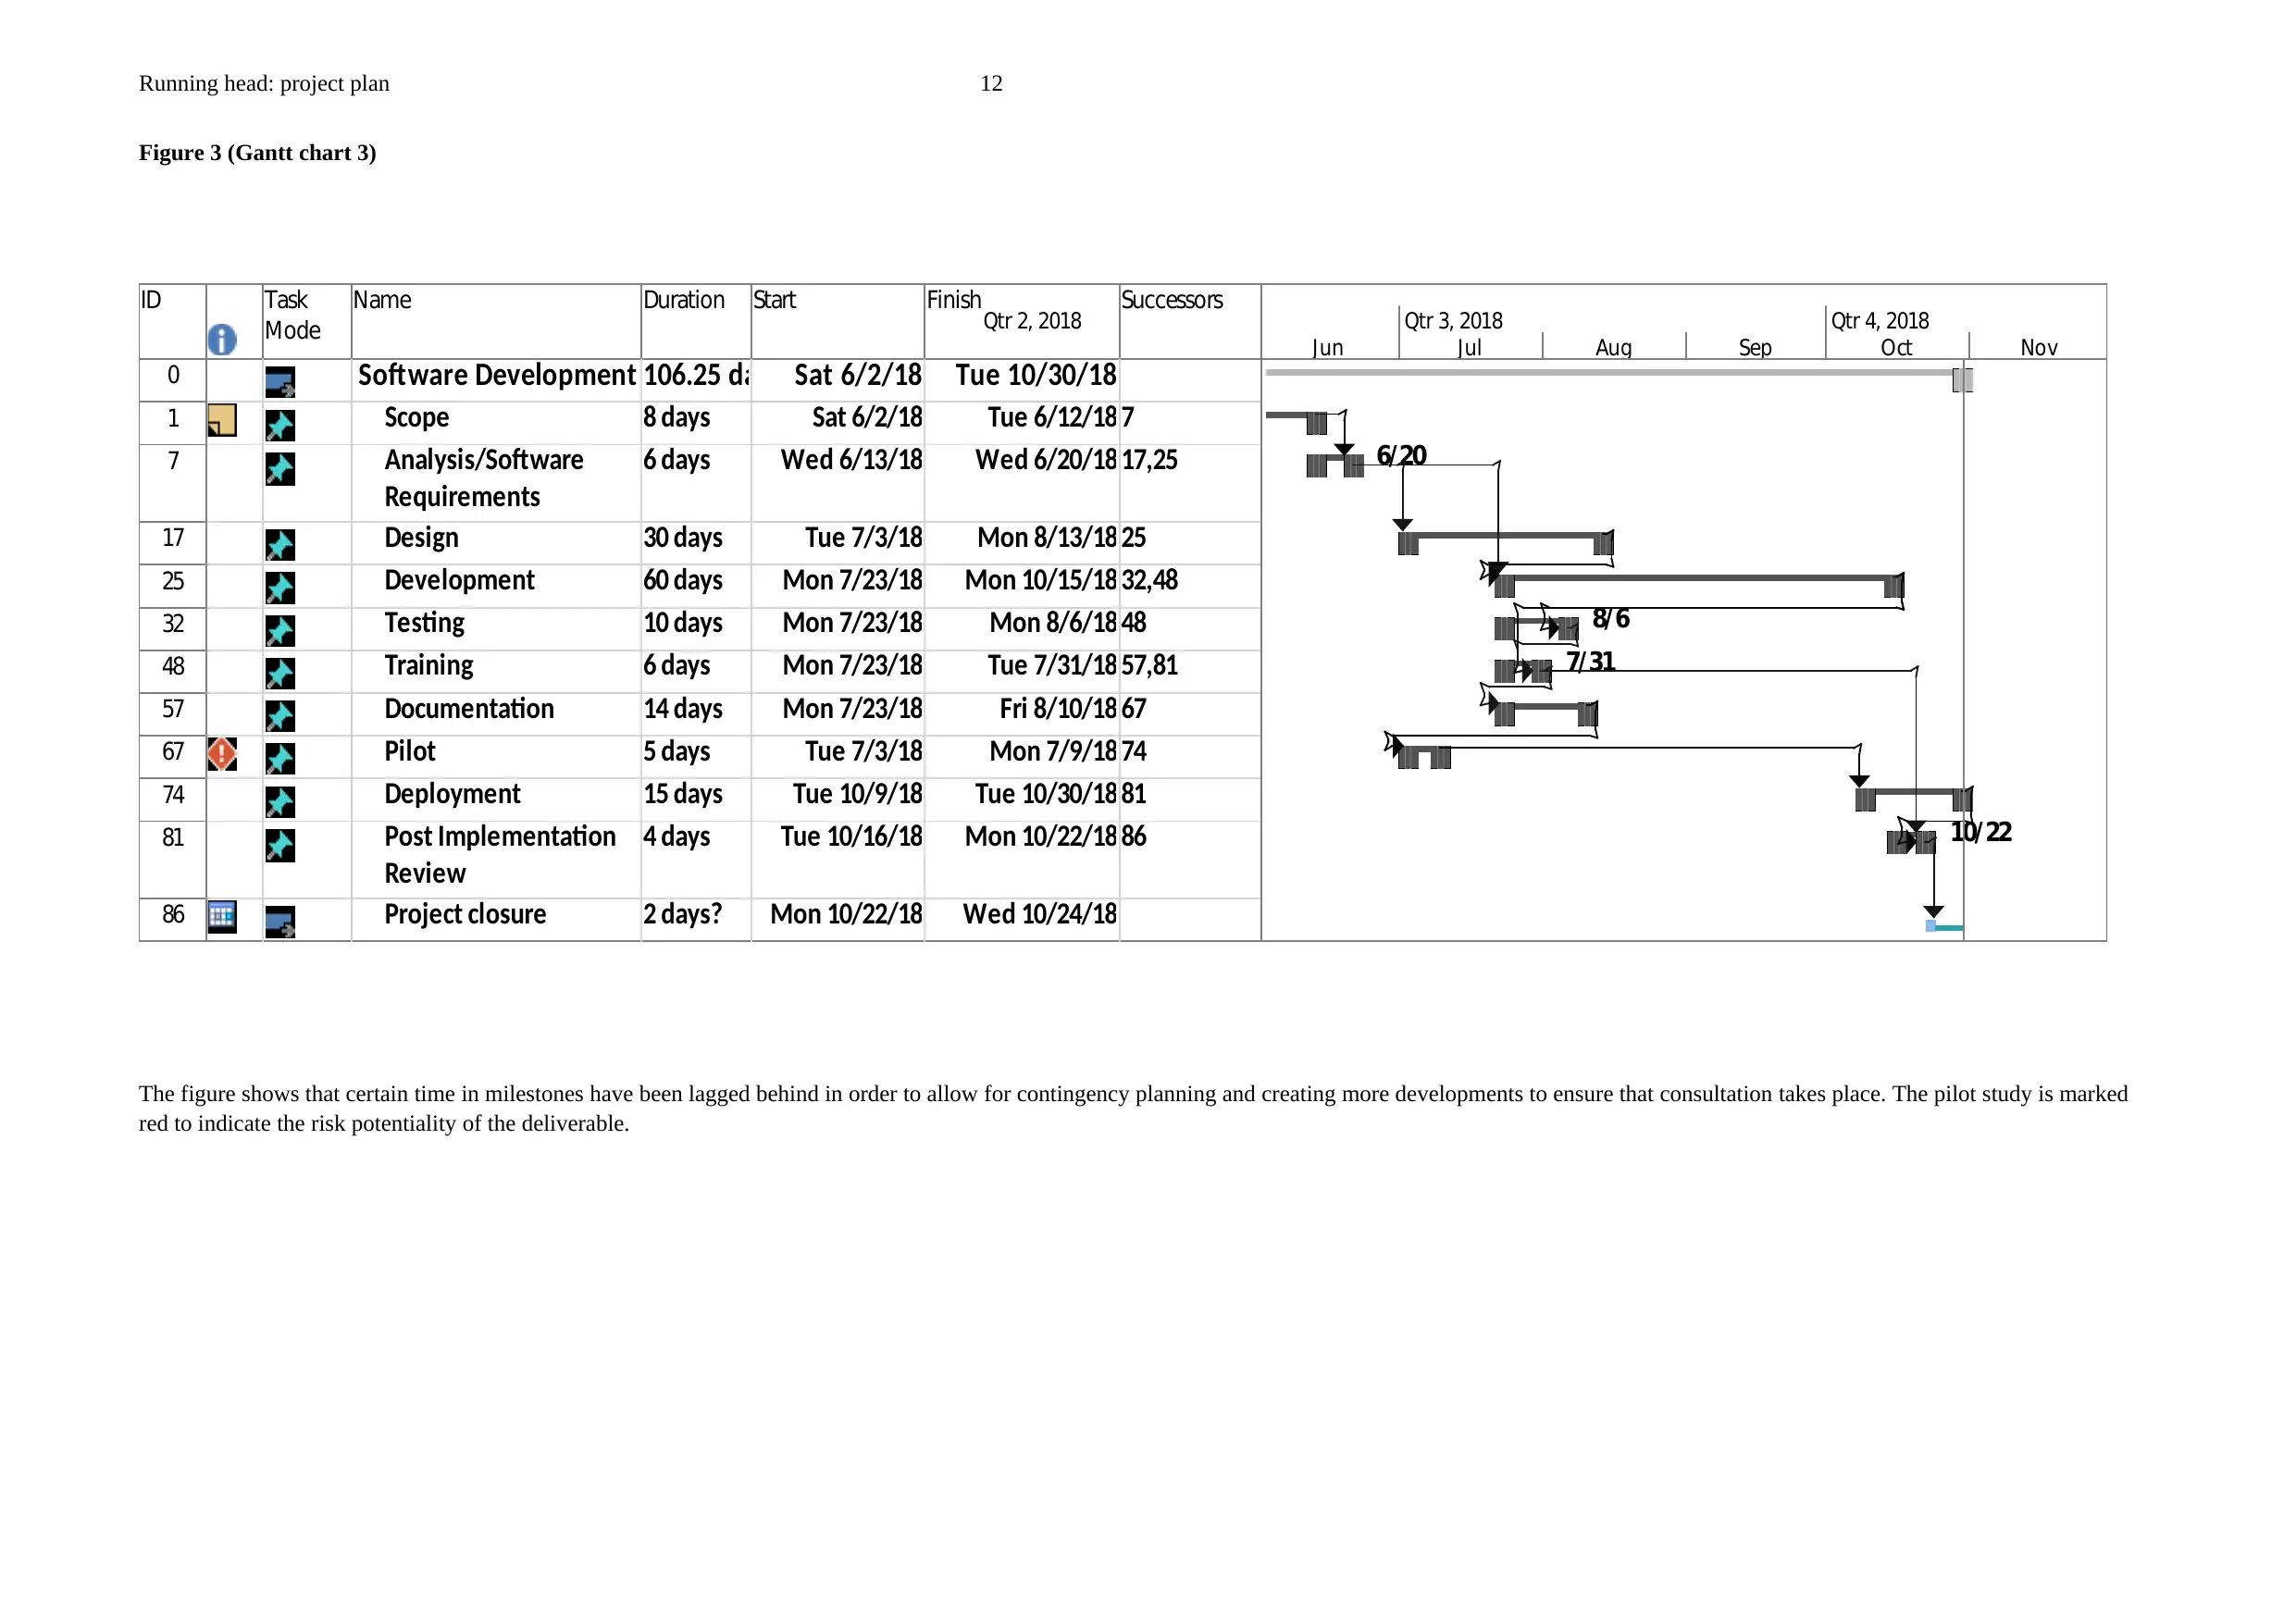
This project plan outlines the design and development of a cloud computing data storage system for the civil service fast stream in the United Kingdom. The project aims to improve data storage capacity, security, and accessibility for applicants. It includes a detailed scope statement, business case, and project objectives. The plan covers deliverables, project priorities, milestones, technical requirements, and risk management strategies. A work breakdown structure (WBS), Gantt chart, and critical path analysis are provided to illustrate project timelines and dependencies. The risk management section identifies potential risks such as system collapse and technology changes, along with mitigation measures. The project also includes a comprehensive budget and communication plan to ensure effective stakeholder management and project execution.
1 out of 18
Related Documents


Your All-in-One AI-Powered Toolkit for Academic Success.
+13062052269
info@desklib.com
Available 24*7 on WhatsApp / Email
![[object Object]](/_next/static/media/star-bottom.7253800d.svg)
Copyright © 2020–2026 A2Z Services. All Rights Reserved. Developed and managed by ZUCOL.