Data Analytics for Cyber Security: Classifier Performance Analysis
VerifiedAdded on 2022/08/15
|34
|4614
|24
Report
AI Summary
This report presents a comparative analysis of five different classifiers: Naïve Bayes, Decision Trees, Logistic Regression, Neural Nets, and K-Nearest Neighbors, using a Twitter dataset to classify tweets as spam or not spam. The study utilizes five performance metrics: accuracy, specificity, precision, recall, and the F1 score to evaluate the effectiveness of each classifier. The methodology involves training and testing each classifier on the provided dataset, with two testing datasets, one representing an ideal scenario and the other reflecting a more realistic distribution of spam tweets. The report includes a literature review of the classifiers and metrics, technical demonstrations of the implementation in R, and a detailed performance evaluation of the classifiers. The Neural Nets classifier is identified as the best performing model across the chosen metrics. The report concludes with insights into the strengths and weaknesses of each classifier, offering valuable information for data analytics and machine learning applications, particularly in cyber security contexts.

Comparison of Classifiers Using Different Performance Evaluation Metrics
Paraphrase This Document
Need a fresh take? Get an instant paraphrase of this document with our AI Paraphraser
Comparison of Classifiers Using Different Performance Evaluation Metrics
Executive Summary
This report presents the results from the investigation of the performance of different classifiers
using the same data. The classifiers selected for evaluation are Naïve Bayes Classifier, Decision
Trees, Logistic Regression, Neural Nets and K-Nearest Neighbors. Each of these classifiers is
trained and tested on twitter data, where the response is whether a tweet is a spam or not. Five
performance metrics are used to evaluate the performance of the models: accuracy, specificity,
precision, recall and the F1 score. The Neural Nets classifier presents the best model for the
classification of tweets with the best performance across three performance metrics on the real
world like testing dataset.
2
Comparison of Classifiers Using Different Performance Evaluation Metrics
Table of Contents
Introduction.................................................................................................................................................4
Literature Review........................................................................................................................................5
Classifiers................................................................................................................................................5
Performance Metrics...............................................................................................................................7
Technical Demonstration.............................................................................................................................8
Performance Evaluation............................................................................................................................16
Conclusion.................................................................................................................................................20
References.................................................................................................................................................21
Appendix: Source File...............................................................................................................................23
3
⊘ This is a preview!⊘
Do you want full access?
Subscribe today to unlock all pages.
Trusted by 1+ million students worldwide
Comparison of Classifiers Using Different Performance Evaluation Metrics
Introduction
Different classifiers are available for the grouping of items in machine learning and big data in
general. Classifiers are machine-learning algorithms that are used in prediction of the group that
an item is likely to fall under (Shaffer, 2011; Vicenc, 2017). This study is interested in evaluating
the performance of different classifiers on the same dataset. The following classifiers are going
to be applied and their performance evaluated in the study: Naïve Bayes Classifier, Decision
Trees, Logistic Regression, Neural Nets and K-Nearest Neighbors. In order to evaluate the
performance of these classifiers, the following performance evaluation metrics are going to be
going to be used; accuracy, specificity, precision, recall and the F1 score.
A dataset on tweets is going to be used as the data for both training the classifiers and testing
their performances. Social media presents the modern platform for both informing and
communicating, making it perfect for the application of machine learning (Witten, 2011). It also
makes it the best source for data from which meaningful and useful inferences can be drawn. The
power of social media in the current societal setup makes its data important for social, political
as well as economic purposes (Agozzino, 2012). The target aspect for this study is determining
how well each of the classifiers can identify whether a tweet is a spam or not.
The features of interest in the classifications in the study are the age of the twitter account,
number of lists that the account is in, number of accounts that the account follows, the number of
accounts that follow that account, the number of tweets published by the account and number of
favorites for the tweets published by the account. For the specific tweet, interest will be on
number of hashtags included, number of retweets, number of URLS included, number of
favorites, number of mentions, number of characters and number of digits.
4
Paraphrase This Document
Need a fresh take? Get an instant paraphrase of this document with our AI Paraphraser
Comparison of Classifiers Using Different Performance Evaluation Metrics
This study will review literature on both the classifiers and the performance metrics of interest
followed by the presentation of the analysis process using each of the classifiers. The
performance of each of the classifiers will then be evaluated using the metrics, finally
conclusions will be drawn, and inferences made.
Literature Review
Classifiers
A number of researches have been done in the application of classifiers in data mining
approaches. Cheolhwan and Stanislaw (2010) explores the application of artificial neural
networks in image recognition. The article argues that Generalized Brain-State-in-a-Box Neural
Networks provide the best neural network approach for the case of image recognition in large-
scale data. Neural networks are classification and prediction models that work is ways similar to
the human brain and is similarly composed of nodes and links (Cheolhwan & Stanislaw, 2010). The
study concludes that for the case of image recognition, which may find application in security,
the neural nets provide the best classification algorithm and specifically the Generalized Brain-
State-in-a-Box Neural Networks.
The research in Alberto, Alfons and Enrique (2012) considers speech recognition and confidence
estimation as an area of possible application of machine learning. The study evaluates the
applicability of the Naïve Bayes classifier for the confidence estimation of words in speech
recognition. Determination of truthfulness in presented information is key in informing the level
of seriousness a statement will be given especially in security related instances, making speech
5
Comparison of Classifiers Using Different Performance Evaluation Metrics
recognition and confidence estimation vital. Alberto, Alfons and Enrique (2012) describes the
Naïve Bayes classifier as a classification model based on the Bayes Theorem and using the
principles of conditional probability provided in the theorem. Alberto, Alfons and Enrique
(2012) conclude that the application of the generalized and specific Naïve Bayes models together
for the statistical language modelling yield a better performing model for speech recognition and
confidence estimation.
Ibrahim et al. (2016) discusses the application of machine learning in identification of abnormal
behavior on online platforms. Detection of abnormal online behavior is a key security interest
especially with the increased reliance on cloud technology and online based services. The
research proposes the application of decision trees to real-time data as a means of identifying
activities as either abnormal or normal. According to Ibrahim et al. (2016), decision trees are
classification algorithms that use the concept of trees and branches to conduct recursive
partitioning of data from its complete form down to groups by following rules based on the
features of interest. The study by Ibrahim et al. (2016) concludes that although modifications are
necessary to avoid overfitting of the decision trees, the decision trees form a viable classifier for
detection of online anomalies.
Guarding against insider attacks is paramount in cloud technology (Subrahmanya, et al., 2017).
The research in Subrahmanya et al. (2017) notes that the best way to void insider attacks in cloud
technology is in being able detect whether the individual accessing the cloud is legitimate or not.
In order to achieve this, Subrahmanya et al. (2017) suggests the use of K-Nearest Neighbors
classifier for the classification of individuals accessing the cloud. The study describes the K-
Nearest Neighbors classifier as a classification model that observes k neighbors of a new item as
well as their classes and use this information to assign the new item to the predominant class
6
⊘ This is a preview!⊘
Do you want full access?
Subscribe today to unlock all pages.
Trusted by 1+ million students worldwide
Comparison of Classifiers Using Different Performance Evaluation Metrics
among the neighbors. Subrahmanya et al. (2017) finds that the K-Nearest Neighbor classifier
provides for a sufficient machine learning approach to threat detection in clouds.
The research in Tao and Longtao (2018) is interested in presenting a model for countering
website vulnerability. Web vulnerability represents a security challenge for website owners and
identifying abnormal website activities is necessary. Tao and Longtao (2018) proposes a logistic
regression model for the identification of web traffic as either an anomaly or normal. Logistic
regression is a predictive and classification regression approach that is applied specifically for
instances when the target variable is categorical (Tao & Longtao, 2018). In their conclusion Tao
and Longtao (2018) suggest that model accuracy can be improved by having the loss function as
the LBFGS algorithm. The study also indicate the logistic regression is efficient in detection of
abnormal web traffic even if it is recently generated.
Performance Metrics
In Cheng & Xiongwei (2010), the study considers different measures for the performance of
classifiers. According to the study, recall refers to the ability of a classifier to identify as many
positives as possible. The study in Amasyali and Ersoy (2011) focuses on comparing different
classifiers based on accuracy. The study defines accuracy as the measure of the true outcomes
among all outcomes. Amasyali and Ersoy (2011) describe accuracy as quintessential and fit for
two grouped cases as well as multi-grouped cases.
Dell et al. (2015) explores the Bayesian reasoning to enable the F1 Score to be a better metrics
for the performance of classifiers. The research in Dell et al. (2015) explains F1 Score as a
measure that assumes a balance between the recall and precision of a classifier. The research in
7
Paraphrase This Document
Need a fresh take? Get an instant paraphrase of this document with our AI Paraphraser
Comparison of Classifiers Using Different Performance Evaluation Metrics
Farideh, Abbas and Shahram (2017) is concerned with ways of improving the precision of the K-
Nearest Neighbors classifiers. Farideh, Abbas and Shahram (2017) define precision as the
measure of the true positives predicted by a classifier. Mubeen (2018) aims at determining the
specificity of a biometric based algorithm as a way of countering instances of fraud. According
to Mubeen (2018), specificity refers to the ability of a classifier to correctly detect the true
negative entries.
Technical Demonstration
The data on the tweets was divided into a training dataset and two testing datasets. The training
set and one of the testing datasets, testing dataset 1, had equal numbers of spammer and non-
spammer tweets, while testing dataset 2 had the ratio of spammer to non-spammer tweets at 1:19.
Testing dataset 1 represents an ideal dataset while testing dataset 2 represents a more real-world
dataset.
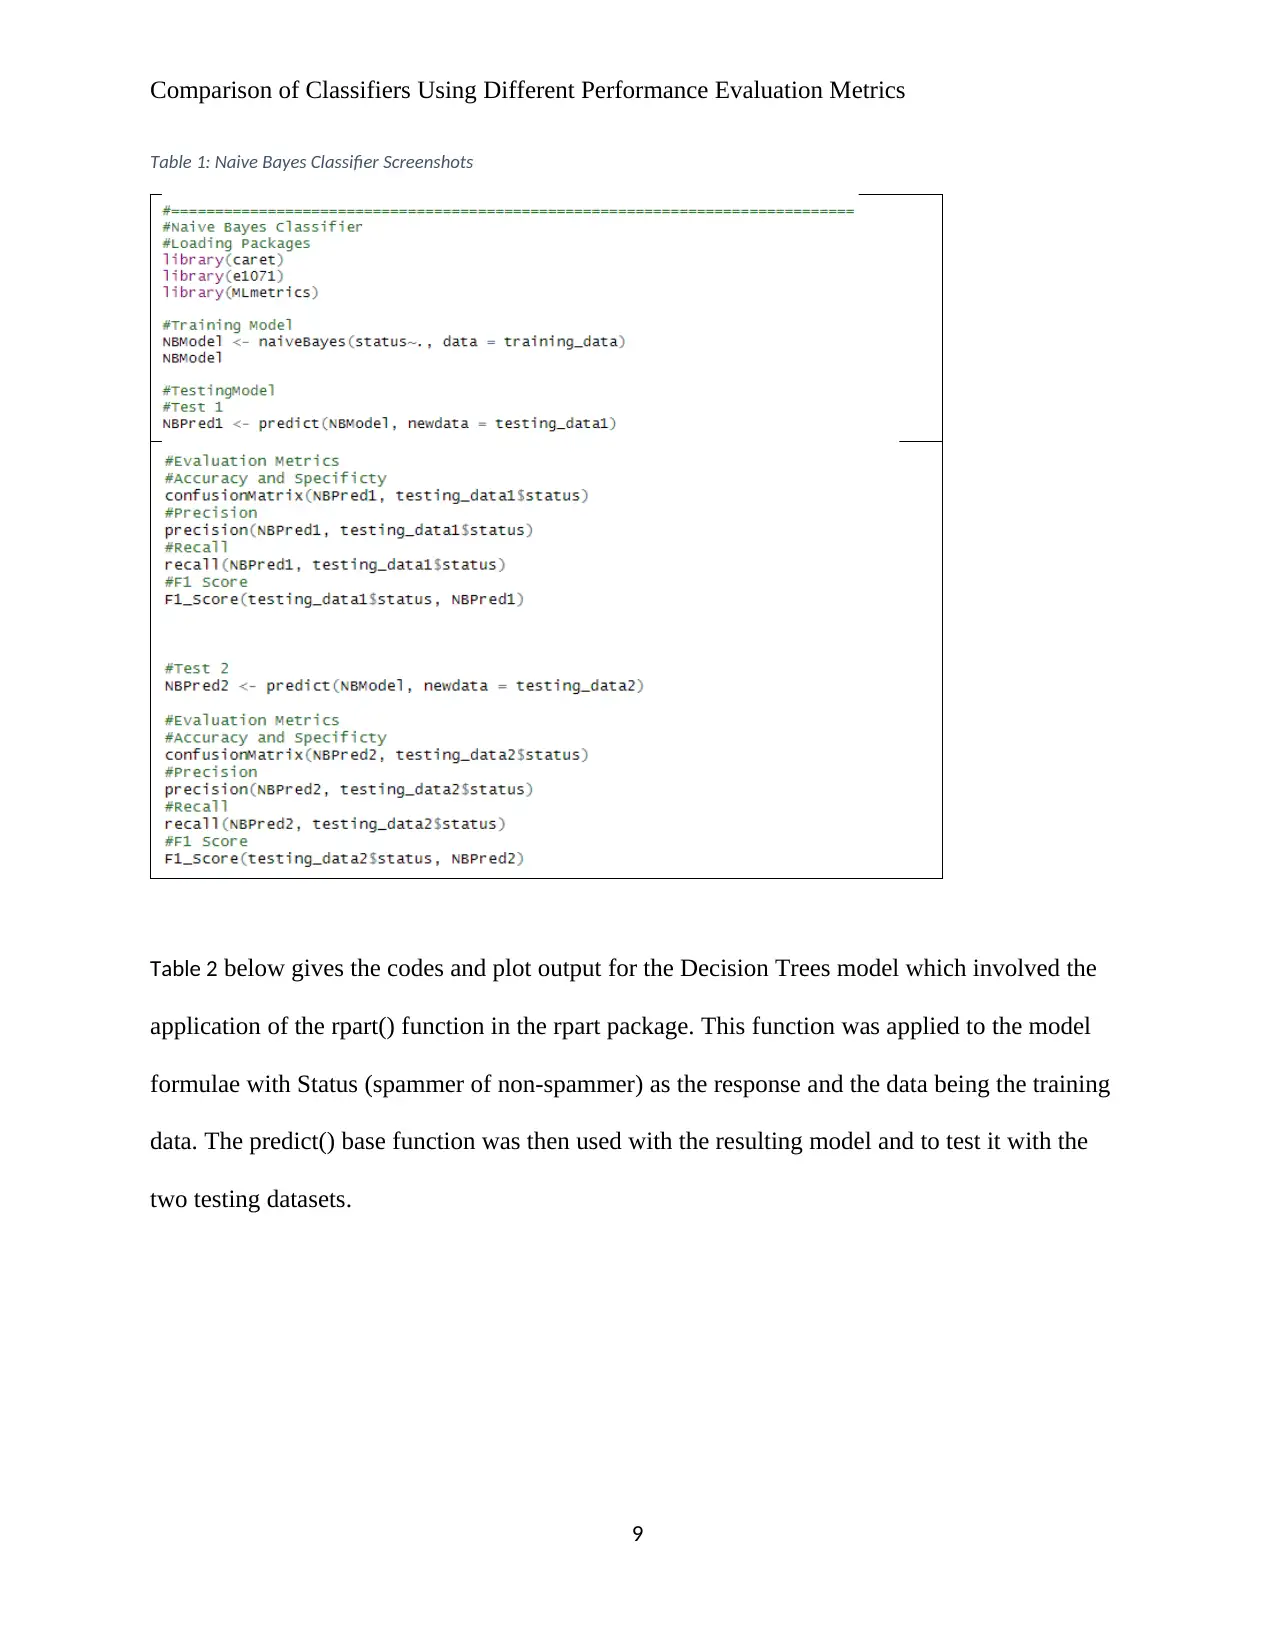
For all the classifiers the confusionmatrix(), precision() and recall() functions in the caret
package were used to get the accuracy and specificity, precision and recall metrics respectively.
The F1_Score() function in the MLmetrics package was used to get the F1 Score metrics.
Table 1: Naive Bayes Classifier below gives the codes for the Naïve Bayes model which involved
the application of the naiveBayes() function in the e1071 package. This function was applied to
the model formulae with Status (spammer of non-spammer) as the response and the data being
the training data. The predict() base function was then used with the resulting model and to test it
with the two testing datasets.
8
Farideh, Abbas and Shahram (2017) is concerned with ways of improving the precision of the K-
Nearest Neighbors classifiers. Farideh, Abbas and Shahram (2017) define precision as the
measure of the true positives predicted by a classifier. Mubeen (2018) aims at determining the
specificity of a biometric based algorithm as a way of countering instances of fraud. According
to Mubeen (2018), specificity refers to the ability of a classifier to correctly detect the true
negative entries.
Technical Demonstration
The data on the tweets was divided into a training dataset and two testing datasets. The training
set and one of the testing datasets, testing dataset 1, had equal numbers of spammer and non-
spammer tweets, while testing dataset 2 had the ratio of spammer to non-spammer tweets at 1:19.
Testing dataset 1 represents an ideal dataset while testing dataset 2 represents a more real-world
dataset.
For all the classifiers the confusionmatrix(), precision() and recall() functions in the caret
package were used to get the accuracy and specificity, precision and recall metrics respectively.
The F1_Score() function in the MLmetrics package was used to get the F1 Score metrics.
Table 1: Naive Bayes Classifier below gives the codes for the Naïve Bayes model which involved
the application of the naiveBayes() function in the e1071 package. This function was applied to
the model formulae with Status (spammer of non-spammer) as the response and the data being
the training data. The predict() base function was then used with the resulting model and to test it
with the two testing datasets.
8
Comparison of Classifiers Using Different Performance Evaluation Metrics
Table 1: Naive Bayes Classifier Screenshots
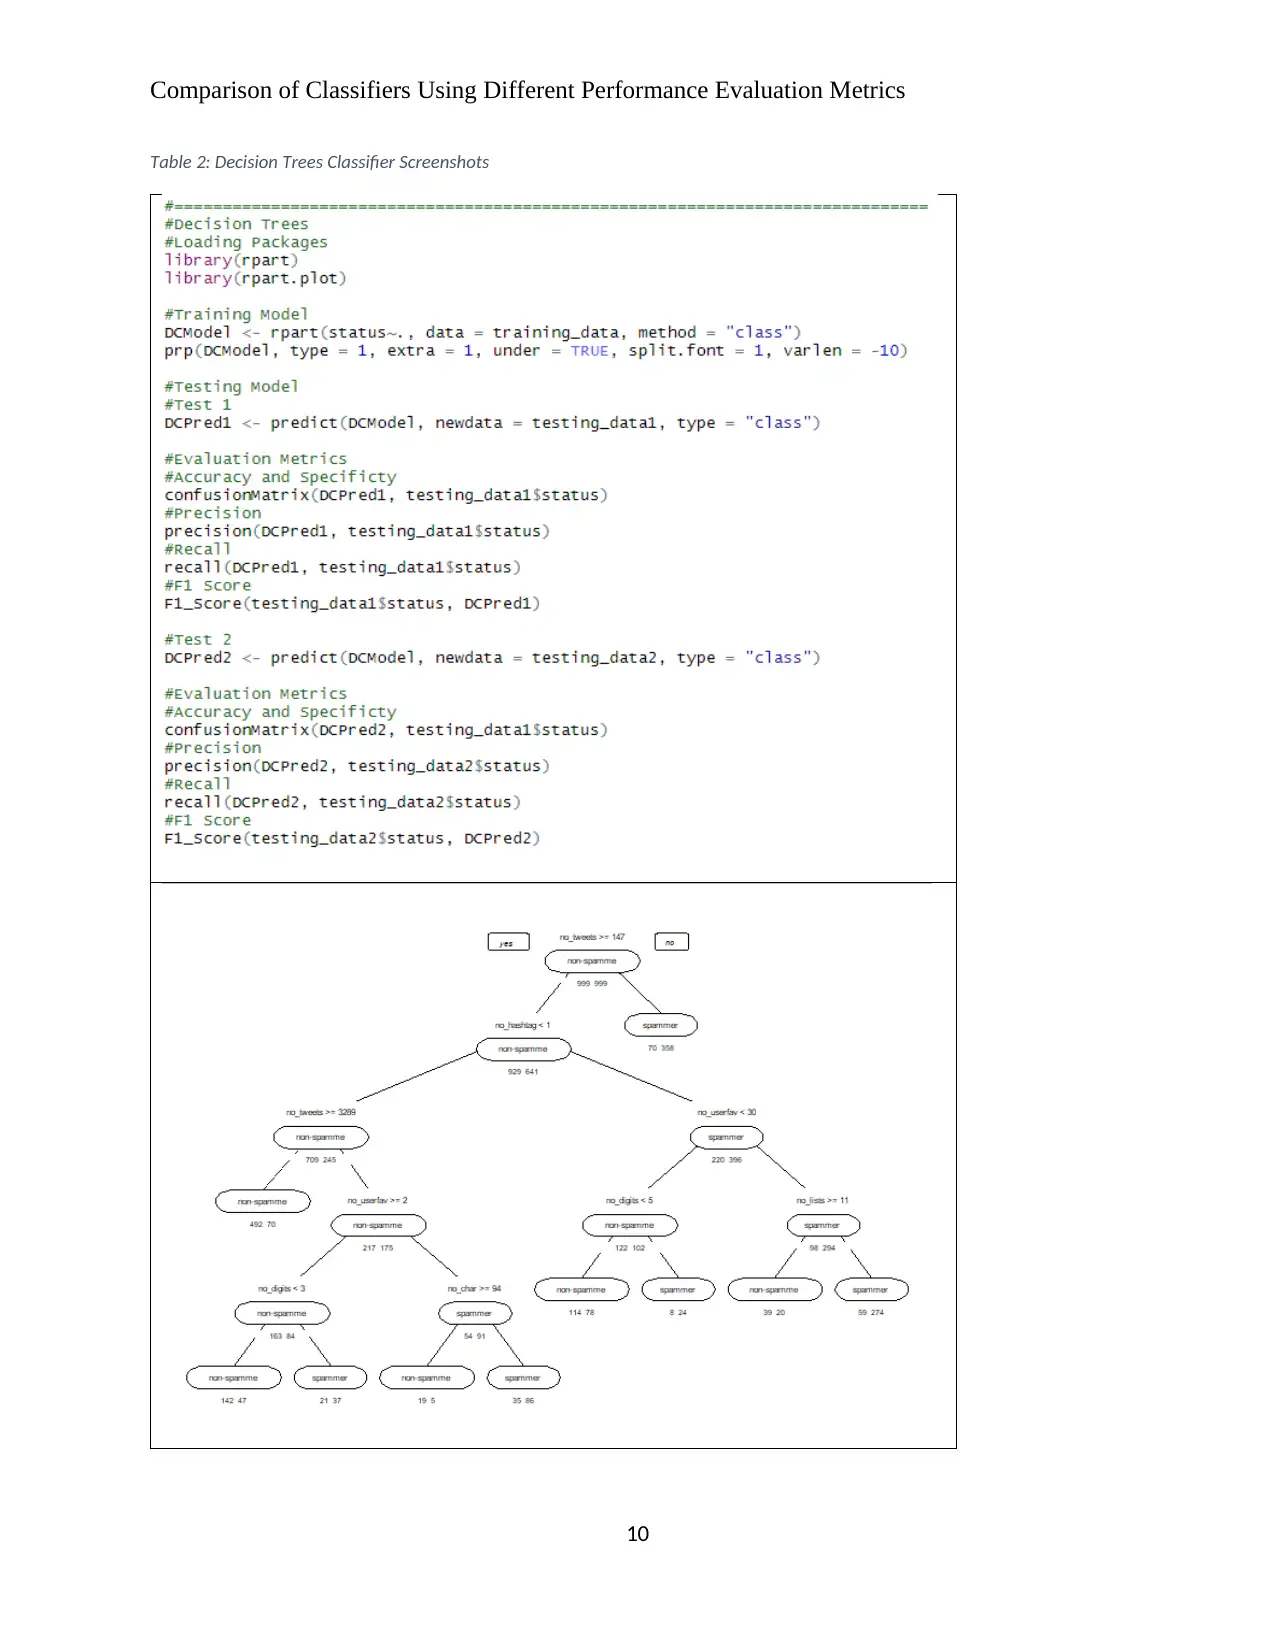
Table 2 below gives the codes and plot output for the Decision Trees model which involved the
application of the rpart() function in the rpart package. This function was applied to the model
formulae with Status (spammer of non-spammer) as the response and the data being the training
data. The predict() base function was then used with the resulting model and to test it with the
two testing datasets.
9
Table 1: Naive Bayes Classifier Screenshots
Table 2 below gives the codes and plot output for the Decision Trees model which involved the
application of the rpart() function in the rpart package. This function was applied to the model
formulae with Status (spammer of non-spammer) as the response and the data being the training
data. The predict() base function was then used with the resulting model and to test it with the
two testing datasets.
9
⊘ This is a preview!⊘
Do you want full access?
Subscribe today to unlock all pages.
Trusted by 1+ million students worldwide
Comparison of Classifiers Using Different Performance Evaluation Metrics
Table 2: Decision Trees Classifier Screenshots
10
Table 2: Decision Trees Classifier Screenshots
10
Paraphrase This Document
Need a fresh take? Get an instant paraphrase of this document with our AI Paraphraser
Comparison of Classifiers Using Different Performance Evaluation Metrics
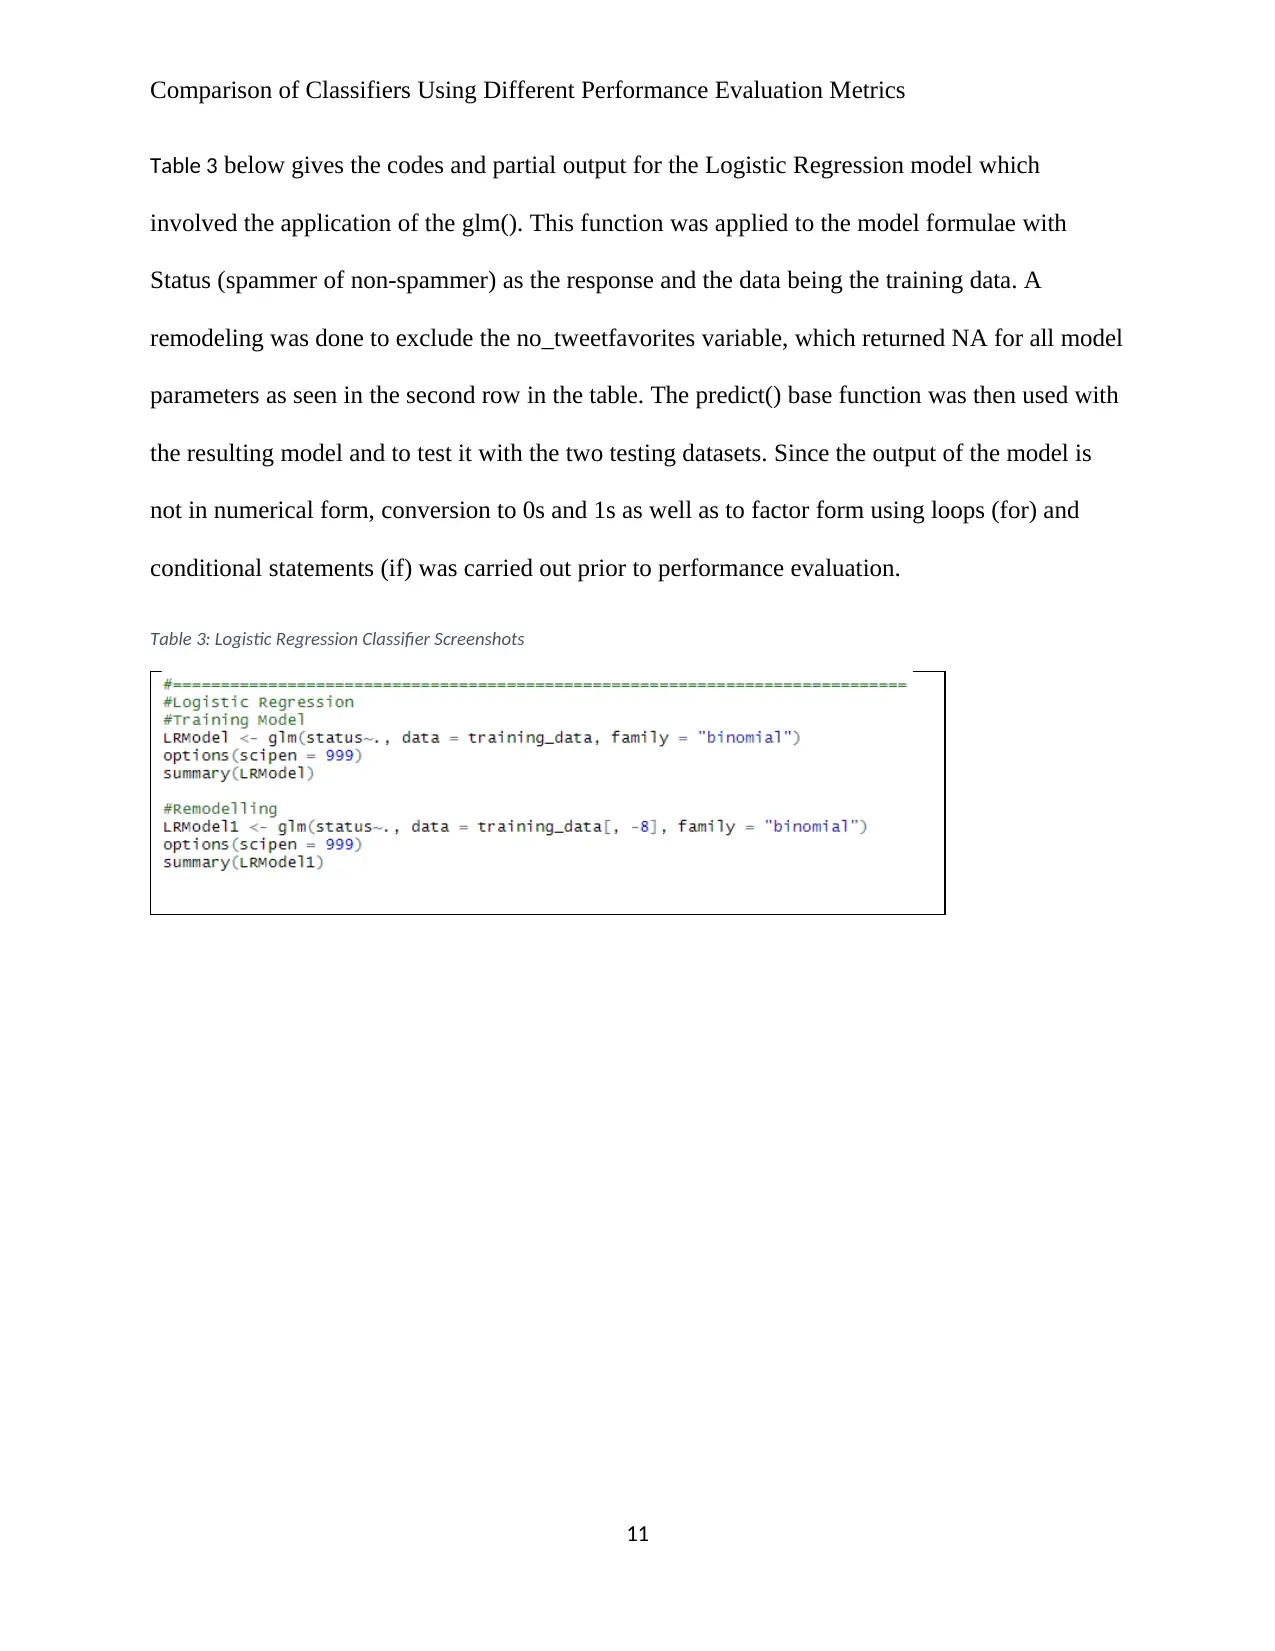
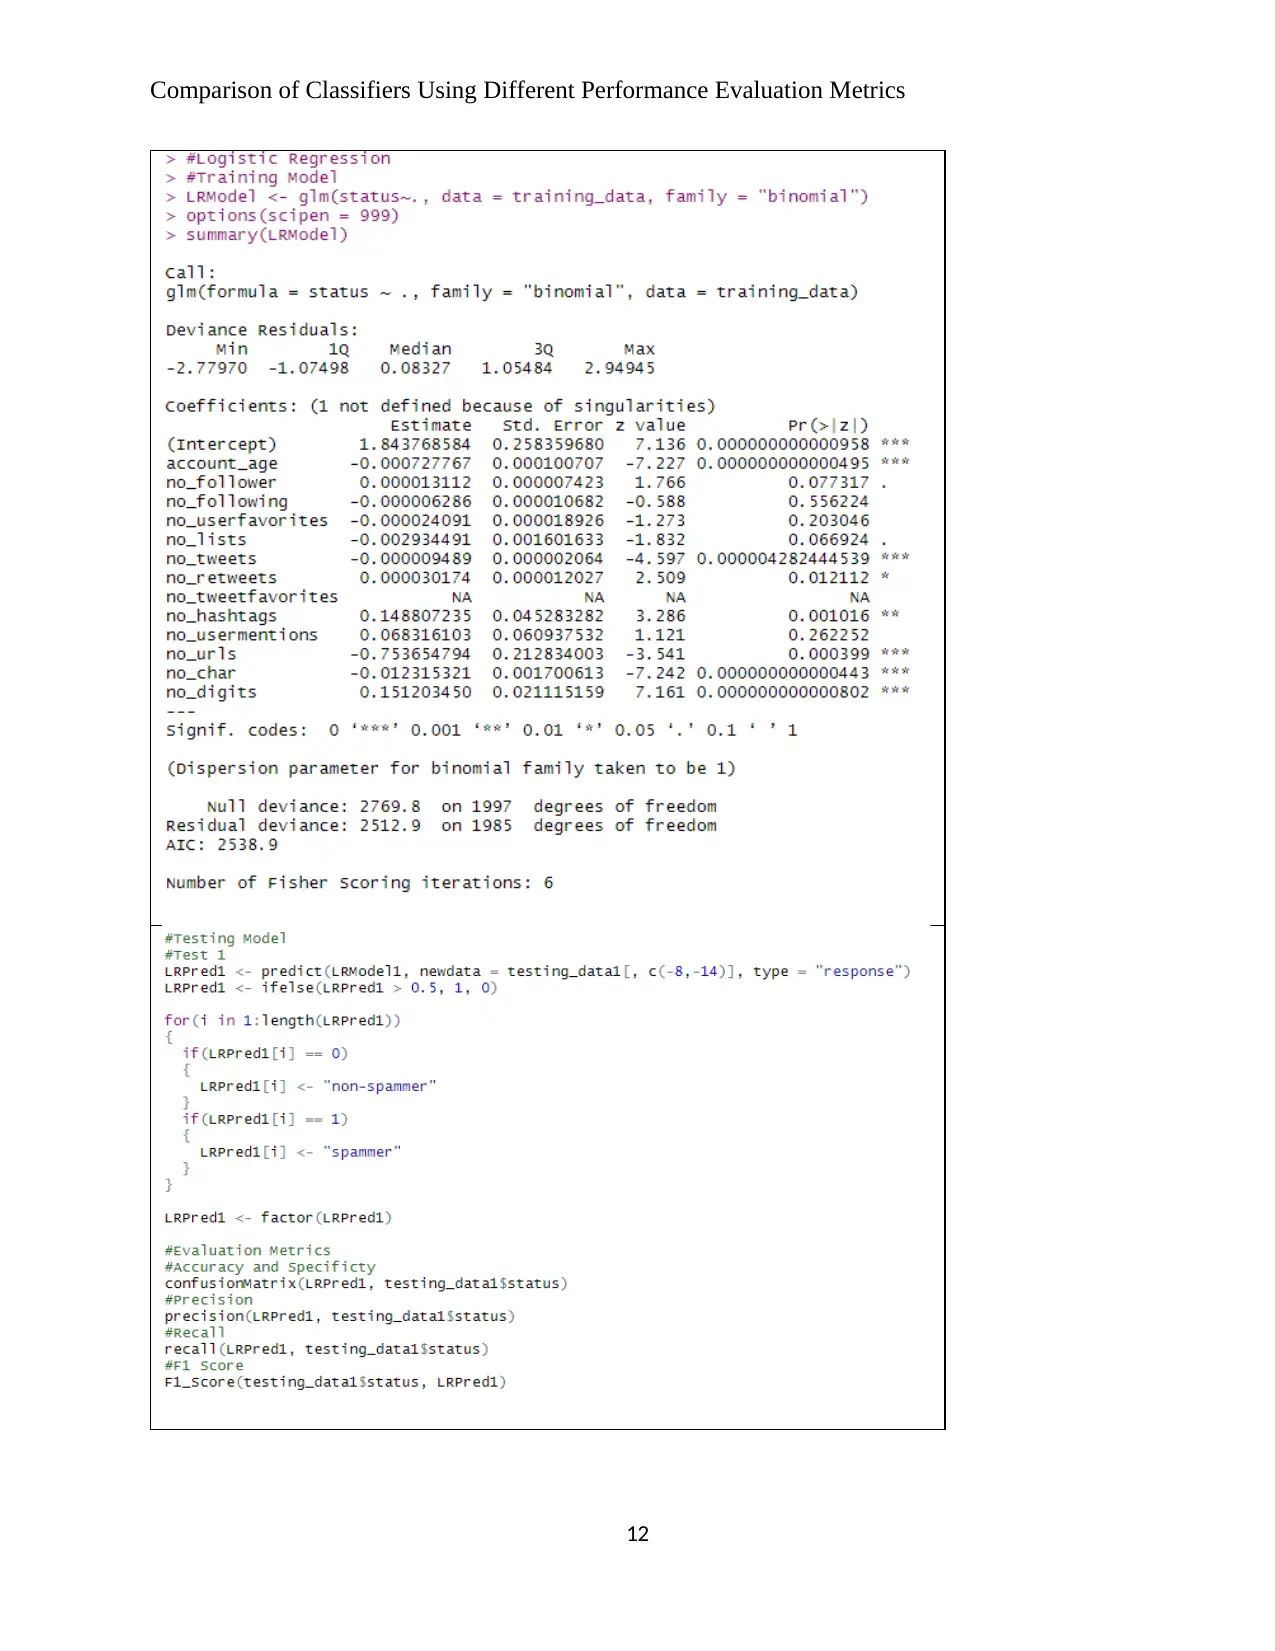
Table 3 below gives the codes and partial output for the Logistic Regression model which
involved the application of the glm(). This function was applied to the model formulae with
Status (spammer of non-spammer) as the response and the data being the training data. A
remodeling was done to exclude the no_tweetfavorites variable, which returned NA for all model
parameters as seen in the second row in the table. The predict() base function was then used with
the resulting model and to test it with the two testing datasets. Since the output of the model is
not in numerical form, conversion to 0s and 1s as well as to factor form using loops (for) and
conditional statements (if) was carried out prior to performance evaluation.
Table 3: Logistic Regression Classifier Screenshots
11
Comparison of Classifiers Using Different Performance Evaluation Metrics
12
12
⊘ This is a preview!⊘
Do you want full access?
Subscribe today to unlock all pages.
Trusted by 1+ million students worldwide
1 out of 34


Your All-in-One AI-Powered Toolkit for Academic Success.
+13062052269
info@desklib.com
Available 24*7 on WhatsApp / Email
![[object Object]](/_next/static/media/star-bottom.7253800d.svg)
Unlock your academic potential
Copyright © 2020–2026 A2Z Services. All Rights Reserved. Developed and managed by ZUCOL.