Financial Analysis of Cleanaway Waste Management: A Detailed Report
VerifiedAdded on 2023/03/31
|16
|2679
|459
Report
AI Summary
This report presents a financial ratio analysis of Cleanaway Waste Management, examining its performance from 2014 to 2018. The analysis focuses on capital structure ratios, including the debt-to-equity ratio, and profitability ratios like return on assets and return on equity. The report compares Cleanaway's ratios with industry averages, highlighting trends and assessing the company's financial health, debt management, and profitability. It also delves into the cash conversion cycle and bond valuation, offering insights into the company's efficiency and investment potential. The study concludes with recommendations for improving financial performance, such as debt restructuring and inventory management, offering practical advice for financial managers. The report also explores the company's ability to meet its financial obligations and optimize its capital structure for improved shareholder value.

FINANCIAL MANAGEMENT 1
FINANCIAL MANAGEMENT
FINANCIAL MANAGEMENT
Paraphrase This Document
Need a fresh take? Get an instant paraphrase of this document with our AI Paraphraser
FINANCIAL MANAGEMENT 2
Answer a:
Debt to equity ratio:
The first ratio to be calculated is the debt to equity ratio which is the leverage ratio that helps
in the calculation of the total weight of the total amount of the debt and the total amount of
the financial liabilities as against the equity from the shareholders. Debt to assets ratio is the
ratio that uses the total assets of the company as denominator but this is the ratio that uses the
amount of the shareholders equity as its denominator. This ratio helps in the highlighting of
the capital structure of the company and shows the tilt towards the debt or the equity
financing of the company (Bhandari, 2019).
A higher ratio shows riskiness of the company. Hence, the lower this ratio, the better it is for
the company. This ratio could be seen to have been increasing with the each passing year.
This shows that the company is exposed to risks. Hence, the company must look for the ways
through which the same could be reduced. The debt to equity ratio of the company has
undergone a change due to the reason that both the debt as well as the equity have increased
when compared over the period of 5 years. The company should look for the ways through
which either the debt could be reduced or equity could be increased.
Interest coverage ratio:
This is the ratio which is the financial ratio of the company and it helps in the measurement
of the ability of the company to make the payments for interests on the debt. This ratio shows
if the company would be able to make the timely payments of its debt along with its interest
payments. This is the ratio which is very much different from the debt service coverage ratio
which is the liquidity ratio of the company and this has got nothing to do with the company
making the principal payments on the debt all by itself. This is the ratio that helps in the
calculation of the interest on the debt.
FINANCIAL MANAGEMENT 3
The creditors and the investors use this calculation for the purposes of understanding the
profitability and the risk that the company is exposed to. In order to illustrate, an investor
would be interested in understanding of his investment would grow in the future or not. An
integral and a major part of the company is associated with the profits and the operational
efficiencies of the company. Hence, the investors would want to know if it is able to pay its
bills on time without the need to think about stopping the operations and the working capital.
(Dothan, 2019).
A higher ratio for the company indicates an increase in the ability of the company to pay off
its debt and the interest on the debt. The calculated ratio shows an improvement from year
2014 to year 2016 but then it shows a downfall. This ratio of the company undergone a
change due to the reason that though the amount of the interest expense has increased with
each passing year but the years have also witnessed a lesser increase in the amount of the
earnings before interest and taxes.
Return on assets:
This is the ratio which shows the profitability position of the company which helps in the
measurement of the net income of the company which has been generated by the total amount
of the asset during the time when the net income is being compared with the average amounts
of the total assets. Since the main motive of the company is the generation of profits, hence
this ratio is of an utmost importance for the company along with for the investors, since they
would want to see their investment increase in value. This could be seen as a return on the
investment for the company since the capital assets are the assets that form the major
investment for the companies (Burton, 2002).
This is the ratio which should be high for the companies since a higher ratio indicates a
higher return on the total amount of the assets that have been employed by the company. The
⊘ This is a preview!⊘
Do you want full access?
Subscribe today to unlock all pages.
Trusted by 1+ million students worldwide
FINANCIAL MANAGEMENT 4
calculated ratio shows an increase which is good for the company. But still, this ratio should
be improved further so that the profitability could improve even more for the company. This
ratio has undergone a change due to the fact that though the net income that was being earned
by the company has increased when compared over the period of 5 years but the increase was
no so that it was able to cover the increase in the amount of the assets that were employed
into the business.
Return on equity:
This is the ratio which is again a profitability ratio that helps in the measurement of the
ability of the company to generate profits from the investments of the shareholders in the
company. This is the ratio that shows the amount of the profit on each dollar of the funds of
the shareholders (Arditti, 2019).
This is the ratio which should be high for the companies since a higher ratio indicates a
higher return on the total amount of the assets that have been employed by the company. The
calculated ratio shows an increase which is good for the company. But still, this ratio should
be improved further so that the profitability could improve even more for the company. This
ratio has undergone a change due to the fact that though the net income that was being earned
by the company has increased when compared over the period of 5 years but the increase was
no so that it was able to cover the increase in the amount of the funds that were employed
into the business.
The companies must necessarily takes all the steps that are required to reduce and also
improve the debt to capital ratios. The company could achieve this by the way of increasing
the profitability, by the way of better management of the inventory and also through the
restructuring of the debt. Both the capital structure ratios and the profitability ratios goes
hand in hand and must be used with one another for the purposes of improving them. In case,
calculated ratio shows an increase which is good for the company. But still, this ratio should
be improved further so that the profitability could improve even more for the company. This
ratio has undergone a change due to the fact that though the net income that was being earned
by the company has increased when compared over the period of 5 years but the increase was
no so that it was able to cover the increase in the amount of the assets that were employed
into the business.
Return on equity:
This is the ratio which is again a profitability ratio that helps in the measurement of the
ability of the company to generate profits from the investments of the shareholders in the
company. This is the ratio that shows the amount of the profit on each dollar of the funds of
the shareholders (Arditti, 2019).
This is the ratio which should be high for the companies since a higher ratio indicates a
higher return on the total amount of the assets that have been employed by the company. The
calculated ratio shows an increase which is good for the company. But still, this ratio should
be improved further so that the profitability could improve even more for the company. This
ratio has undergone a change due to the fact that though the net income that was being earned
by the company has increased when compared over the period of 5 years but the increase was
no so that it was able to cover the increase in the amount of the funds that were employed
into the business.
The companies must necessarily takes all the steps that are required to reduce and also
improve the debt to capital ratios. The company could achieve this by the way of increasing
the profitability, by the way of better management of the inventory and also through the
restructuring of the debt. Both the capital structure ratios and the profitability ratios goes
hand in hand and must be used with one another for the purposes of improving them. In case,
Paraphrase This Document
Need a fresh take? Get an instant paraphrase of this document with our AI Paraphraser
FINANCIAL MANAGEMENT 5
the timing of the market is right, then the same could be helpful in pricing of the goods and
the services (E finance management, 2019).
The company must go for the increase in the amount of the sales revenue and also the profits.
This could be done through the way of increasing the prices of the goods or the services, by
the way of reducing the costs. An extra amount of cash could be used by the company to pay
off the debt that the company has in its financial accounts.
There is yet another way through which the company could improve these ratios. The
company would manage its inventory in a much better way. This is in light of the fact that the
working capital of the company consumes a great deal of size of the company. The
maintenance of higher level of inventory would go in for wastage since it would just consume
space. Hence, the companies must examine and understand the day’s sales of the inventory
ratio which forms the part of the cash conversion cycle for the determination of the way in
which the inventory could be managed efficiently (E finance management, 2019).
The amount of debt of the company could also be restructured. In case, the company is a
large company that is exposed to a higher rate of interest on its loans and it is also exposed to
lower rate of interests, the company could go in for the refinancing of the debt which is in
existence. This is the way through which the amount of the interest expenses could be
reduced along with the monthly payments. This could improve the profitability of the
company along with its cash flows and would also increase the stores of the capital.
In the nutshell, it would be apt to say that the companies today could use the tools like debt
restructuring and the management of inventory through which the management could lower
down its debt to capital ratio.
(Clean way, investor’s relations, 2019).
Answer b:
FINANCIAL MANAGEMENT 6
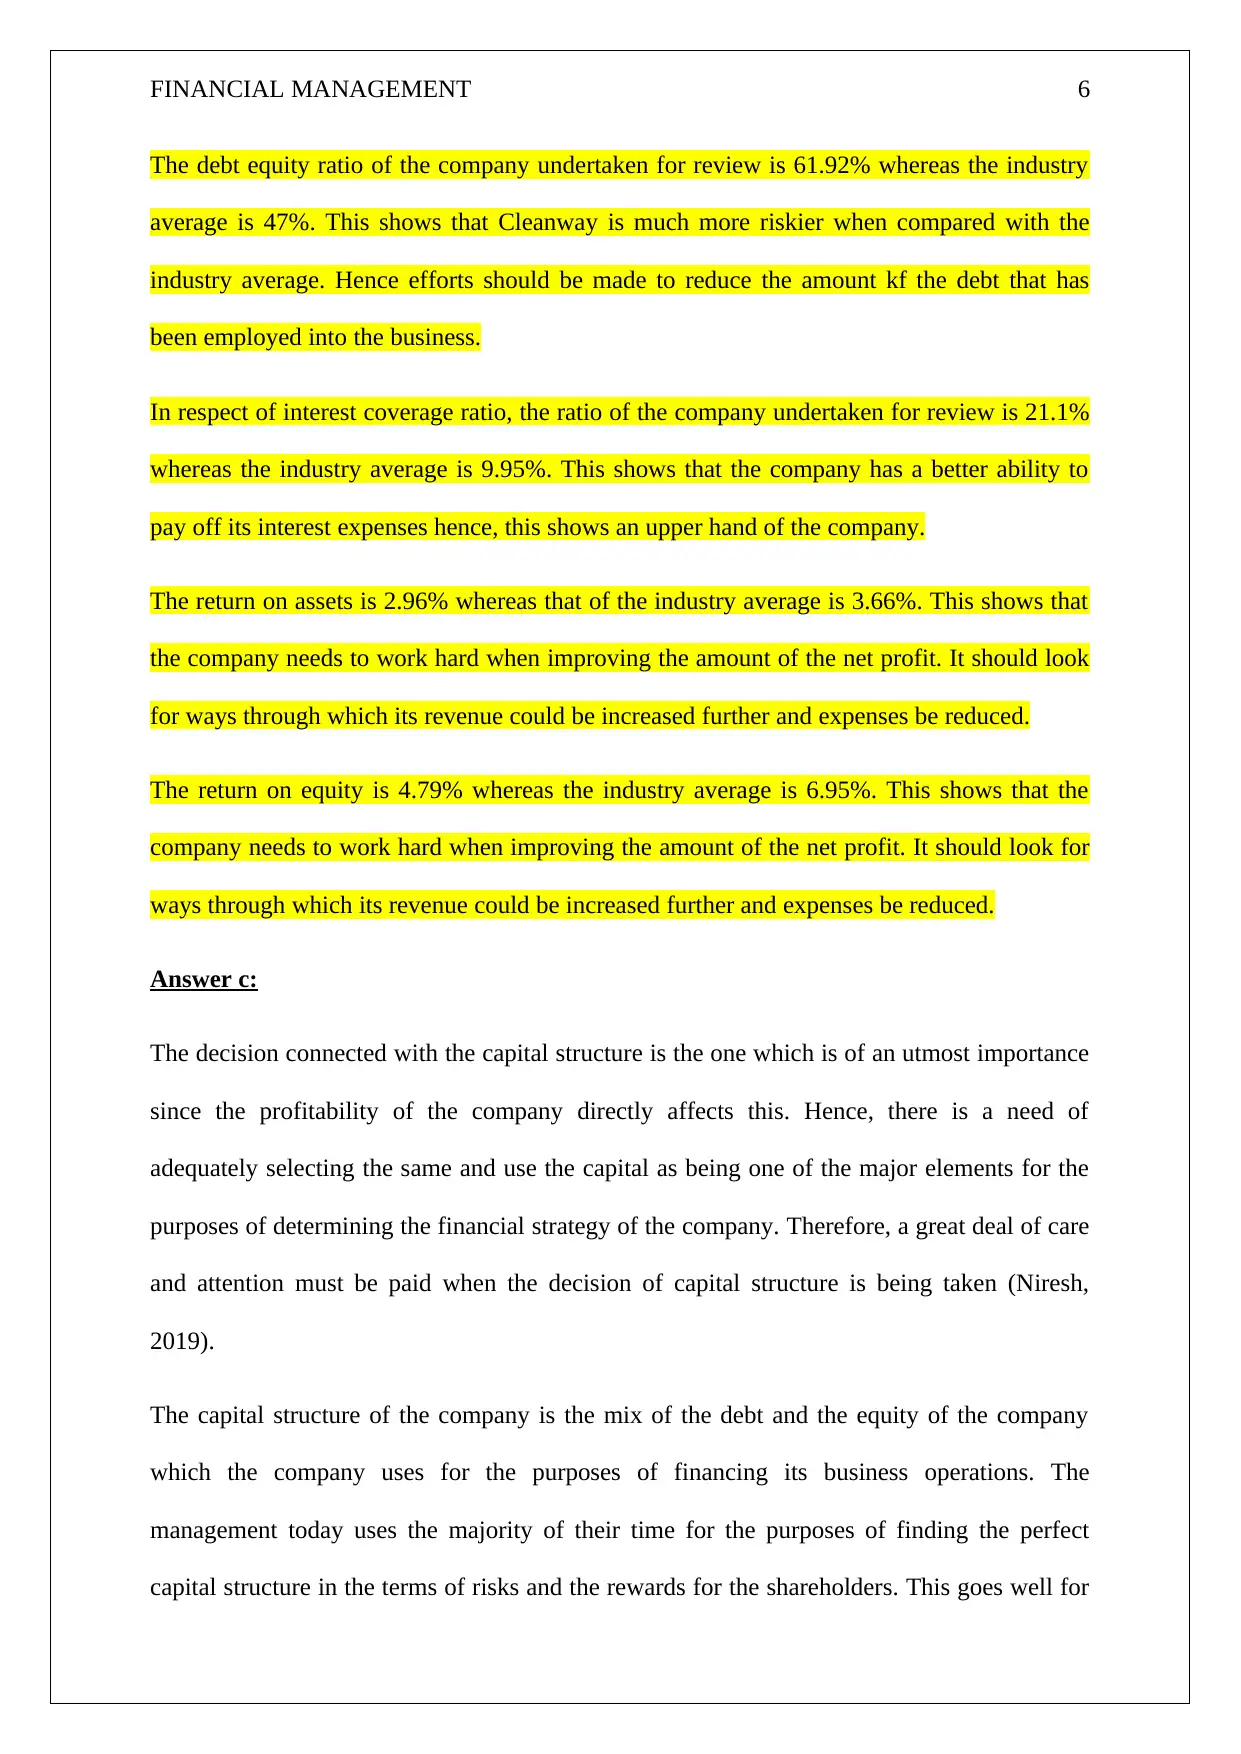
The debt equity ratio of the company undertaken for review is 61.92% whereas the industry
average is 47%. This shows that Cleanway is much more riskier when compared with the
industry average. Hence efforts should be made to reduce the amount kf the debt that has
been employed into the business.
In respect of interest coverage ratio, the ratio of the company undertaken for review is 21.1%
whereas the industry average is 9.95%. This shows that the company has a better ability to
pay off its interest expenses hence, this shows an upper hand of the company.
The return on assets is 2.96% whereas that of the industry average is 3.66%. This shows that
the company needs to work hard when improving the amount of the net profit. It should look
for ways through which its revenue could be increased further and expenses be reduced.
The return on equity is 4.79% whereas the industry average is 6.95%. This shows that the
company needs to work hard when improving the amount of the net profit. It should look for
ways through which its revenue could be increased further and expenses be reduced.
Answer c:
The decision connected with the capital structure is the one which is of an utmost importance
since the profitability of the company directly affects this. Hence, there is a need of
adequately selecting the same and use the capital as being one of the major elements for the
purposes of determining the financial strategy of the company. Therefore, a great deal of care
and attention must be paid when the decision of capital structure is being taken (Niresh,
2019).
The capital structure of the company is the mix of the debt and the equity of the company
which the company uses for the purposes of financing its business operations. The
management today uses the majority of their time for the purposes of finding the perfect
capital structure in the terms of risks and the rewards for the shareholders. This goes well for
⊘ This is a preview!⊘
Do you want full access?
Subscribe today to unlock all pages.
Trusted by 1+ million students worldwide
FINANCIAL MANAGEMENT 7
both the smaller and the larger companies since it helps in the strategizing the way in which
the equity and the dent could be used without putting the business at risk.
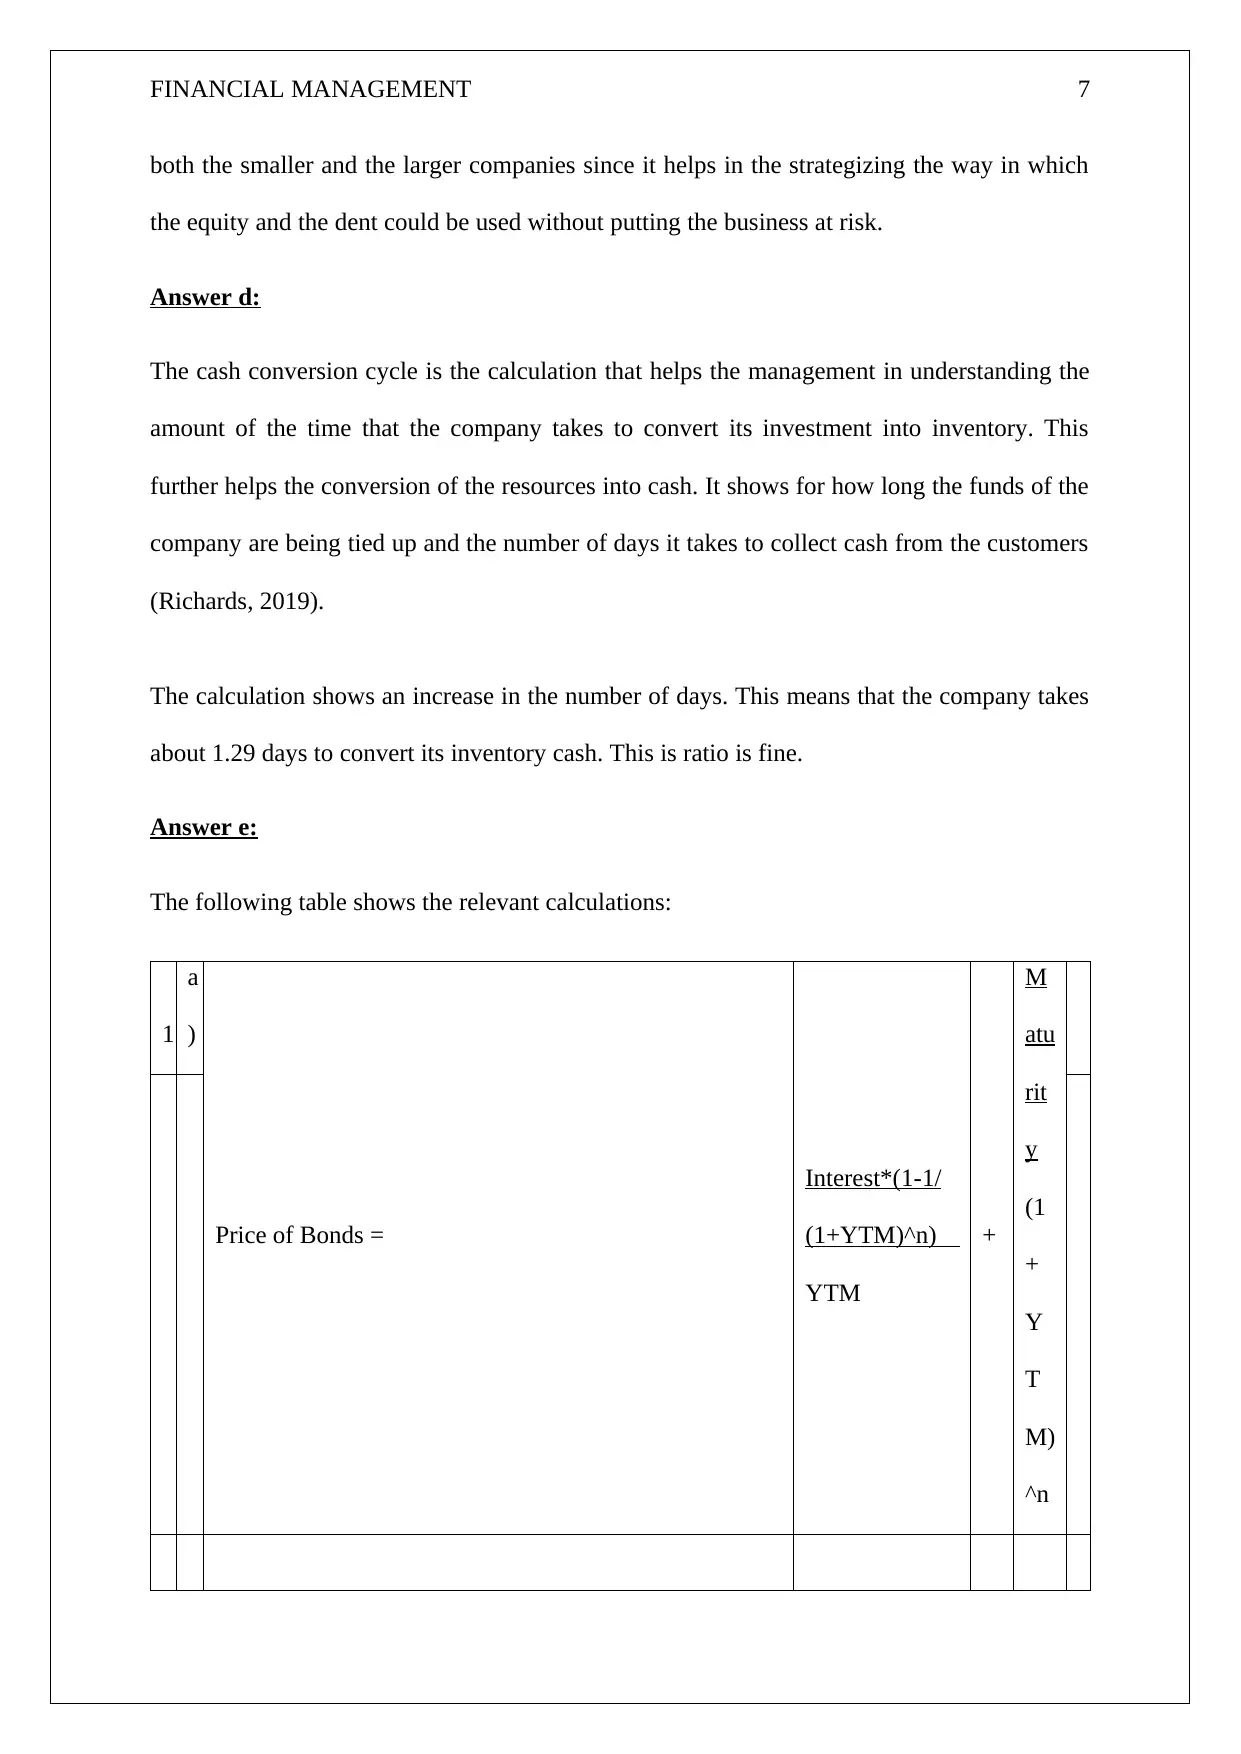
Answer d:
The cash conversion cycle is the calculation that helps the management in understanding the
amount of the time that the company takes to convert its investment into inventory. This
further helps the conversion of the resources into cash. It shows for how long the funds of the
company are being tied up and the number of days it takes to collect cash from the customers
(Richards, 2019).
The calculation shows an increase in the number of days. This means that the company takes
about 1.29 days to convert its inventory cash. This is ratio is fine.
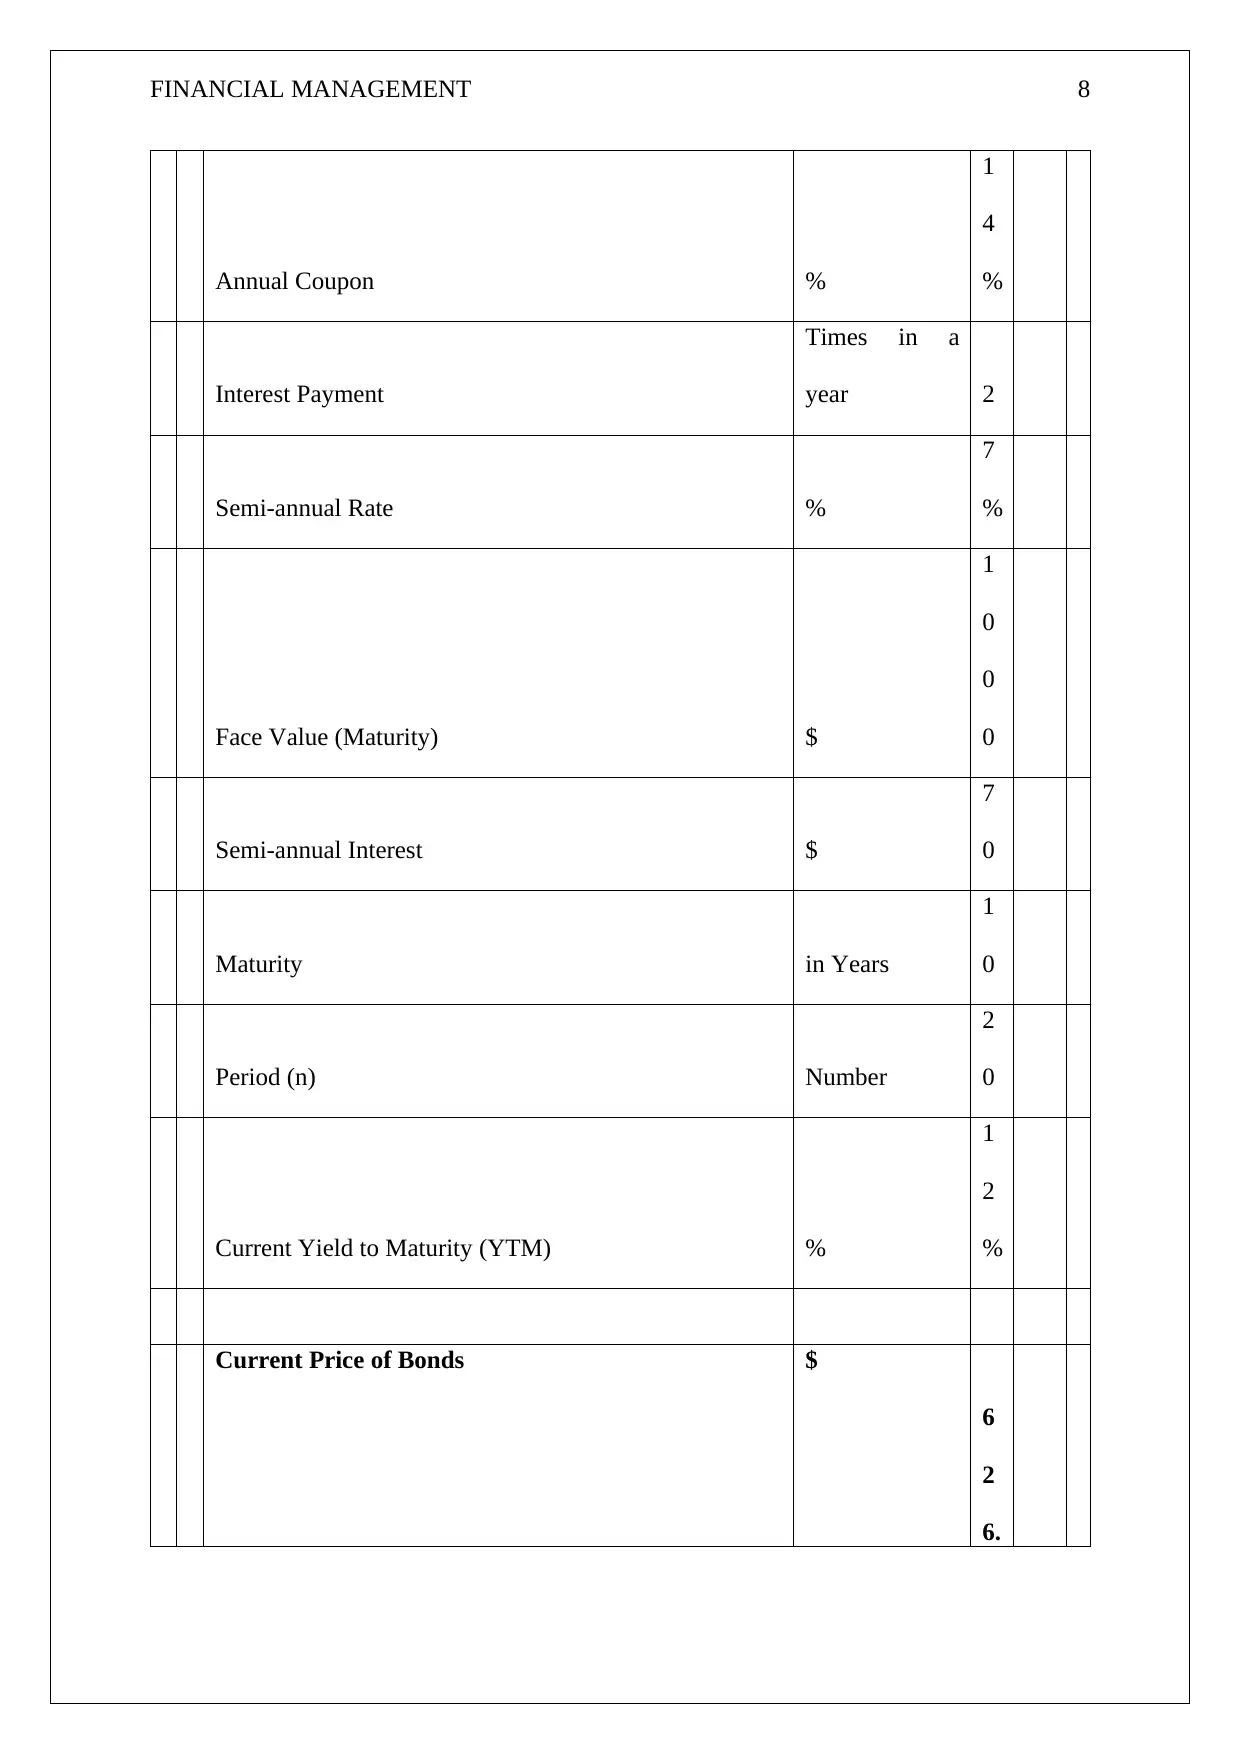
Answer e:
The following table shows the relevant calculations:
1
a
)
Price of Bonds =
Interest*(1-1/
(1+YTM)^n)
YTM
+
M
atu
rit
y
(1
+
Y
T
M)
^n
both the smaller and the larger companies since it helps in the strategizing the way in which
the equity and the dent could be used without putting the business at risk.
Answer d:
The cash conversion cycle is the calculation that helps the management in understanding the
amount of the time that the company takes to convert its investment into inventory. This
further helps the conversion of the resources into cash. It shows for how long the funds of the
company are being tied up and the number of days it takes to collect cash from the customers
(Richards, 2019).
The calculation shows an increase in the number of days. This means that the company takes
about 1.29 days to convert its inventory cash. This is ratio is fine.
Answer e:
The following table shows the relevant calculations:
1
a
)
Price of Bonds =
Interest*(1-1/
(1+YTM)^n)
YTM
+
M
atu
rit
y
(1
+
Y
T
M)
^n
Paraphrase This Document
Need a fresh take? Get an instant paraphrase of this document with our AI Paraphraser
FINANCIAL MANAGEMENT 8
Annual Coupon %
1
4
%
Interest Payment
Times in a
year 2
Semi-annual Rate %
7
%
Face Value (Maturity) $
1
0
0
0
Semi-annual Interest $
7
0
Maturity in Years
1
0
Period (n) Number
2
0
Current Yield to Maturity (YTM) %
1
2
%
Current Price of Bonds $
6
2
6.
Annual Coupon %
1
4
%
Interest Payment
Times in a
year 2
Semi-annual Rate %
7
%
Face Value (Maturity) $
1
0
0
0
Semi-annual Interest $
7
0
Maturity in Years
1
0
Period (n) Number
2
0
Current Yield to Maturity (YTM) %
1
2
%
Current Price of Bonds $
6
2
6.
FINANCIAL MANAGEMENT 9
5
3
b
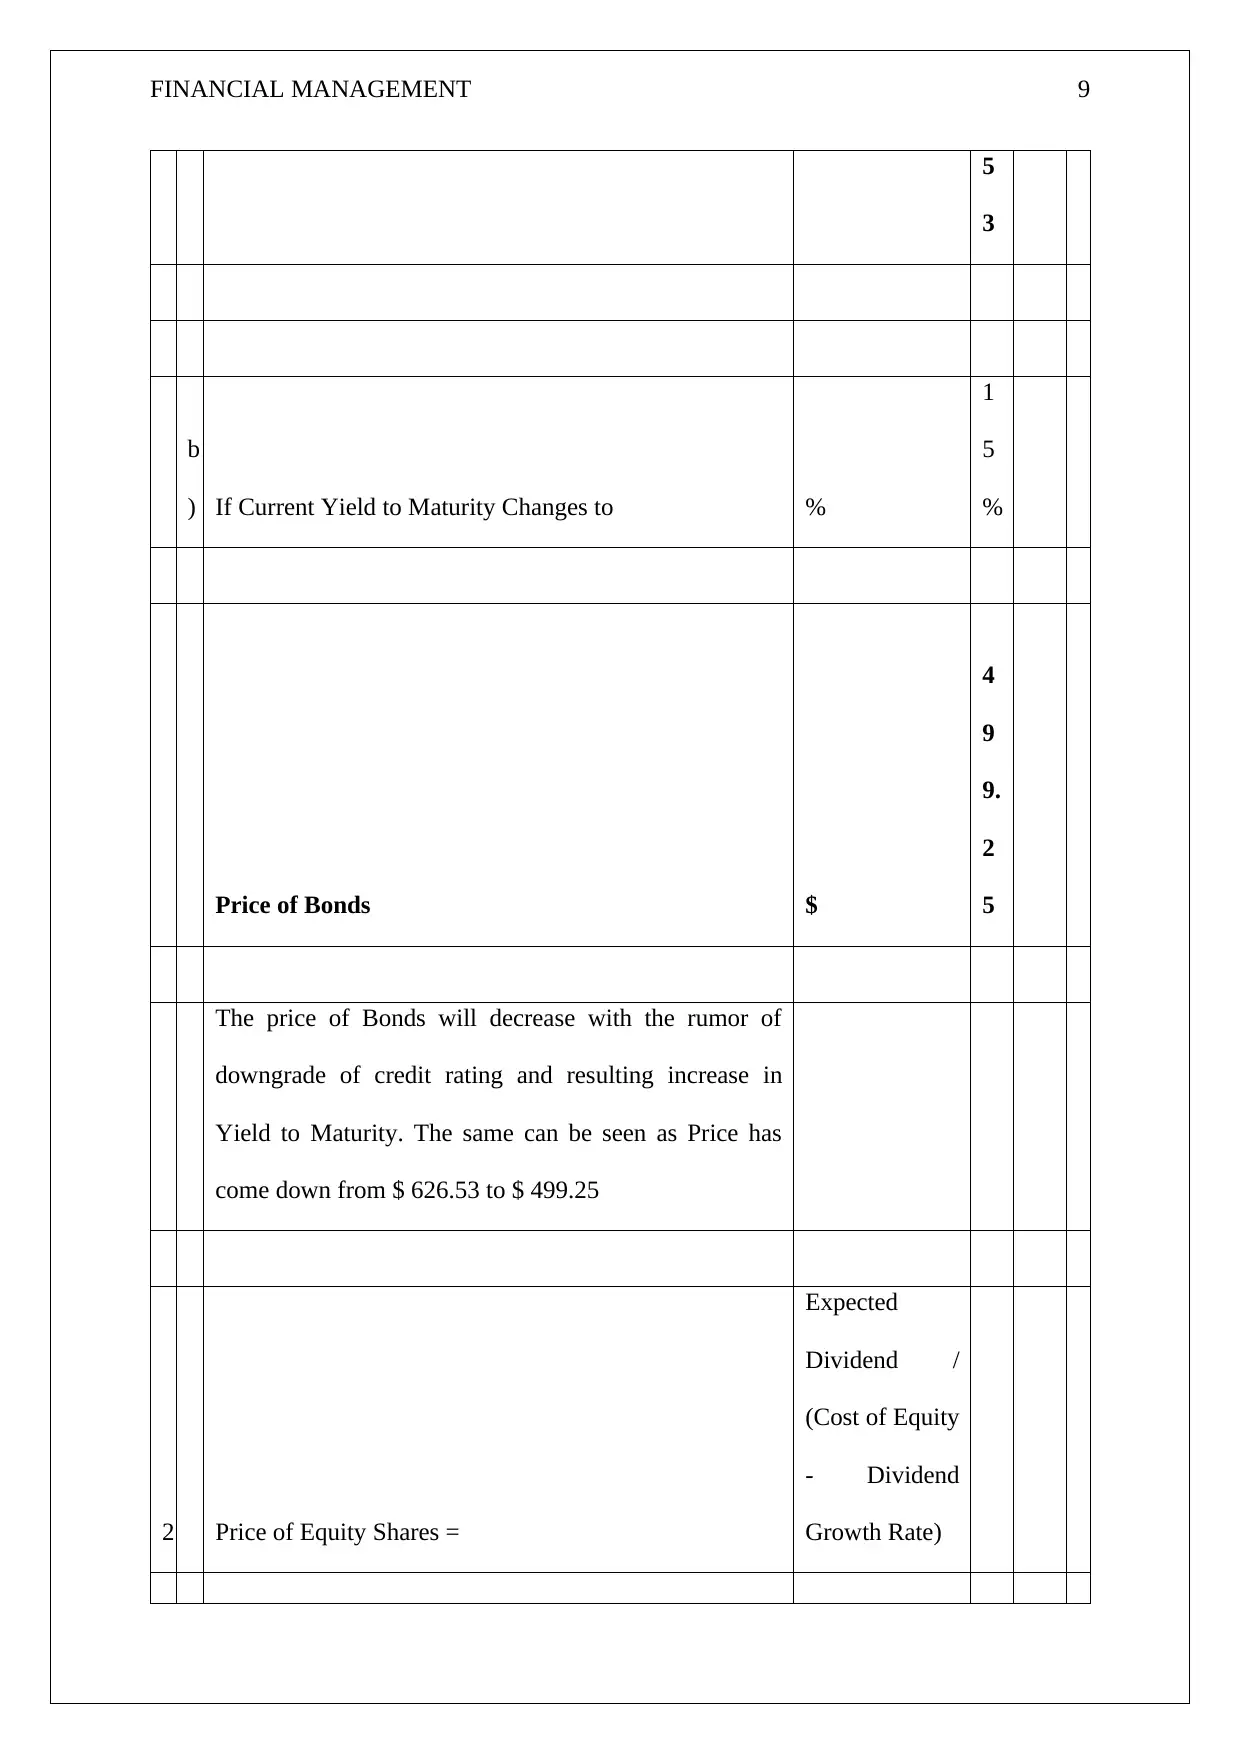
) If Current Yield to Maturity Changes to %
1
5
%
Price of Bonds $
4
9
9.
2
5
The price of Bonds will decrease with the rumor of
downgrade of credit rating and resulting increase in
Yield to Maturity. The same can be seen as Price has
come down from $ 626.53 to $ 499.25
2 Price of Equity Shares =
Expected
Dividend /
(Cost of Equity
- Dividend
Growth Rate)
5
3
b
) If Current Yield to Maturity Changes to %
1
5
%
Price of Bonds $
4
9
9.
2
5
The price of Bonds will decrease with the rumor of
downgrade of credit rating and resulting increase in
Yield to Maturity. The same can be seen as Price has
come down from $ 626.53 to $ 499.25
2 Price of Equity Shares =
Expected
Dividend /
(Cost of Equity
- Dividend
Growth Rate)
⊘ This is a preview!⊘
Do you want full access?
Subscribe today to unlock all pages.
Trusted by 1+ million students worldwide
FINANCIAL MANAGEMENT 10
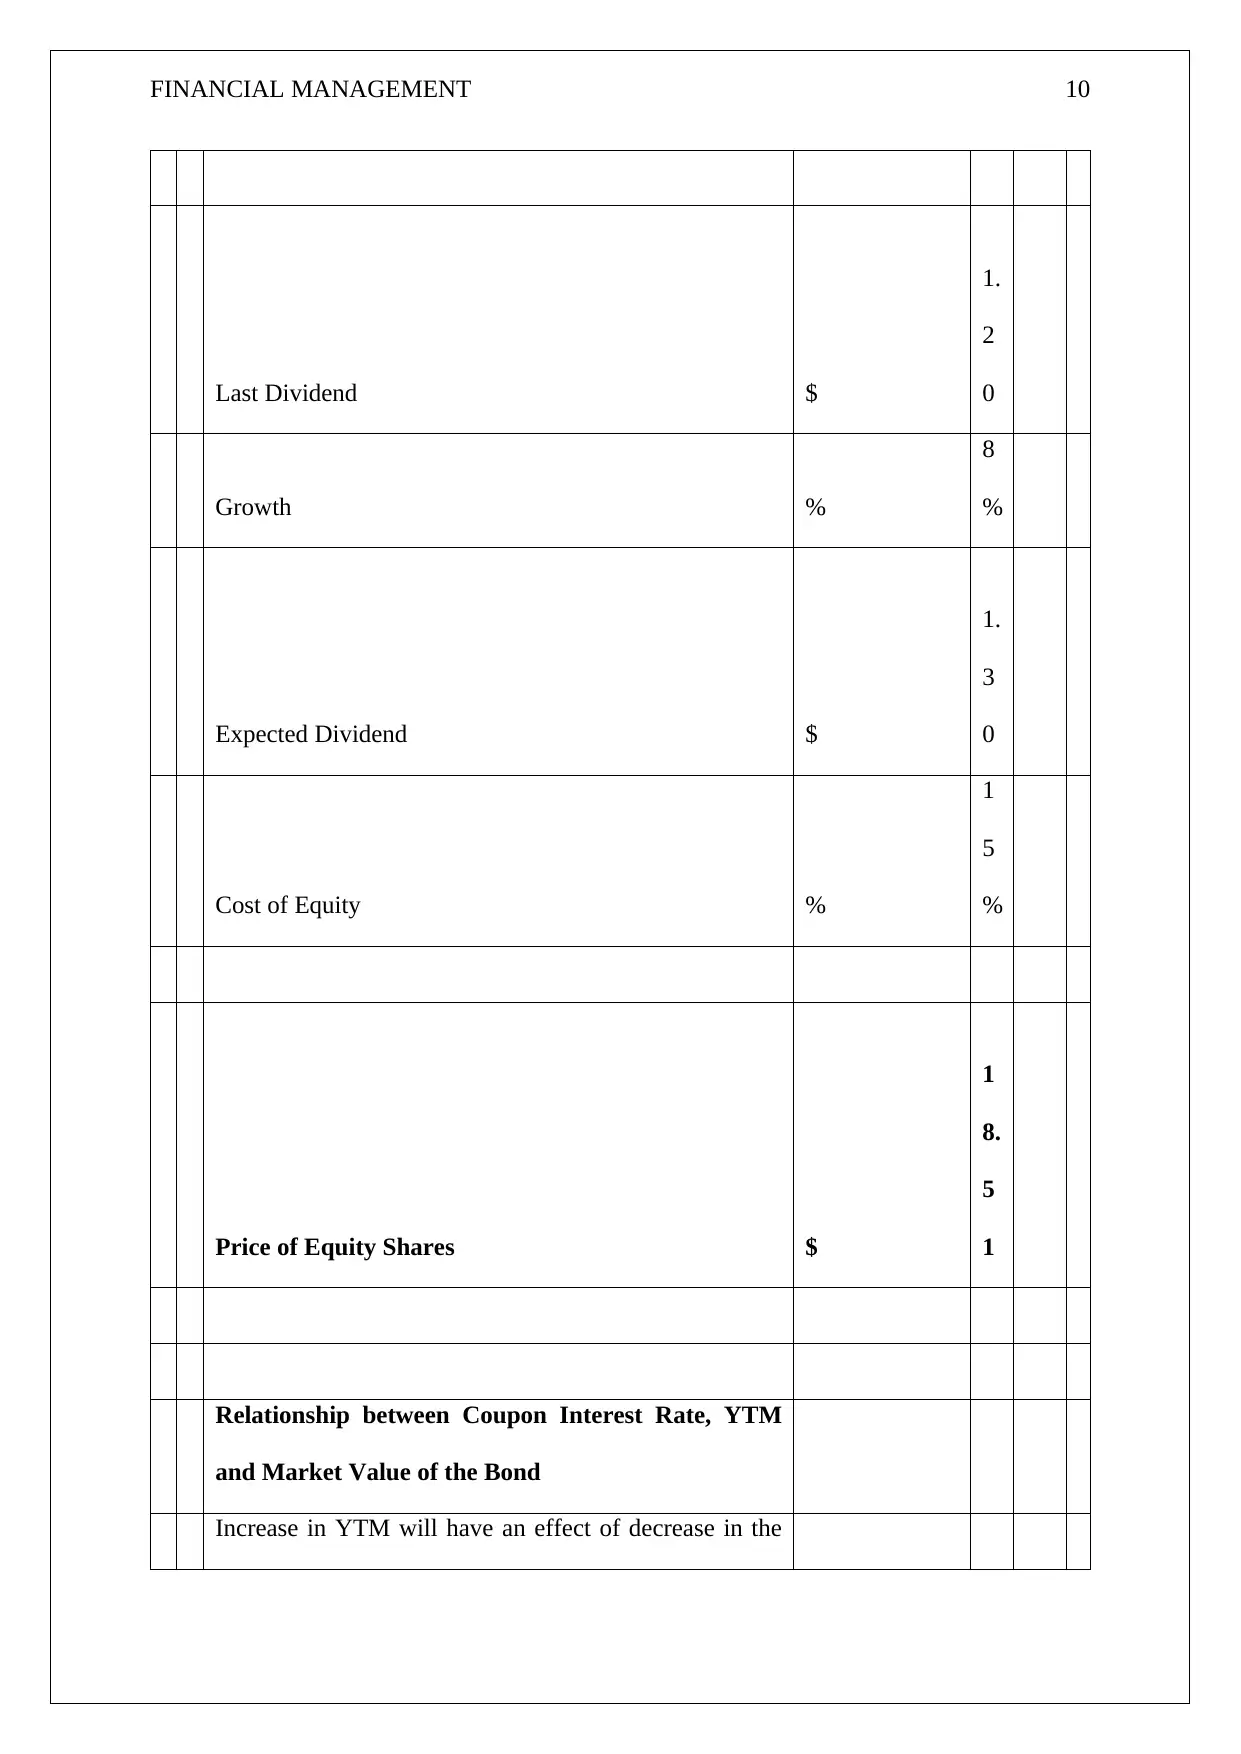
Last Dividend $
1.
2
0
Growth %
8
%
Expected Dividend $
1.
3
0
Cost of Equity %
1
5
%
Price of Equity Shares $
1
8.
5
1
Relationship between Coupon Interest Rate, YTM
and Market Value of the Bond
Increase in YTM will have an effect of decrease in the
Last Dividend $
1.
2
0
Growth %
8
%
Expected Dividend $
1.
3
0
Cost of Equity %
1
5
%
Price of Equity Shares $
1
8.
5
1
Relationship between Coupon Interest Rate, YTM
and Market Value of the Bond
Increase in YTM will have an effect of decrease in the
Paraphrase This Document
Need a fresh take? Get an instant paraphrase of this document with our AI Paraphraser
FINANCIAL MANAGEMENT 11
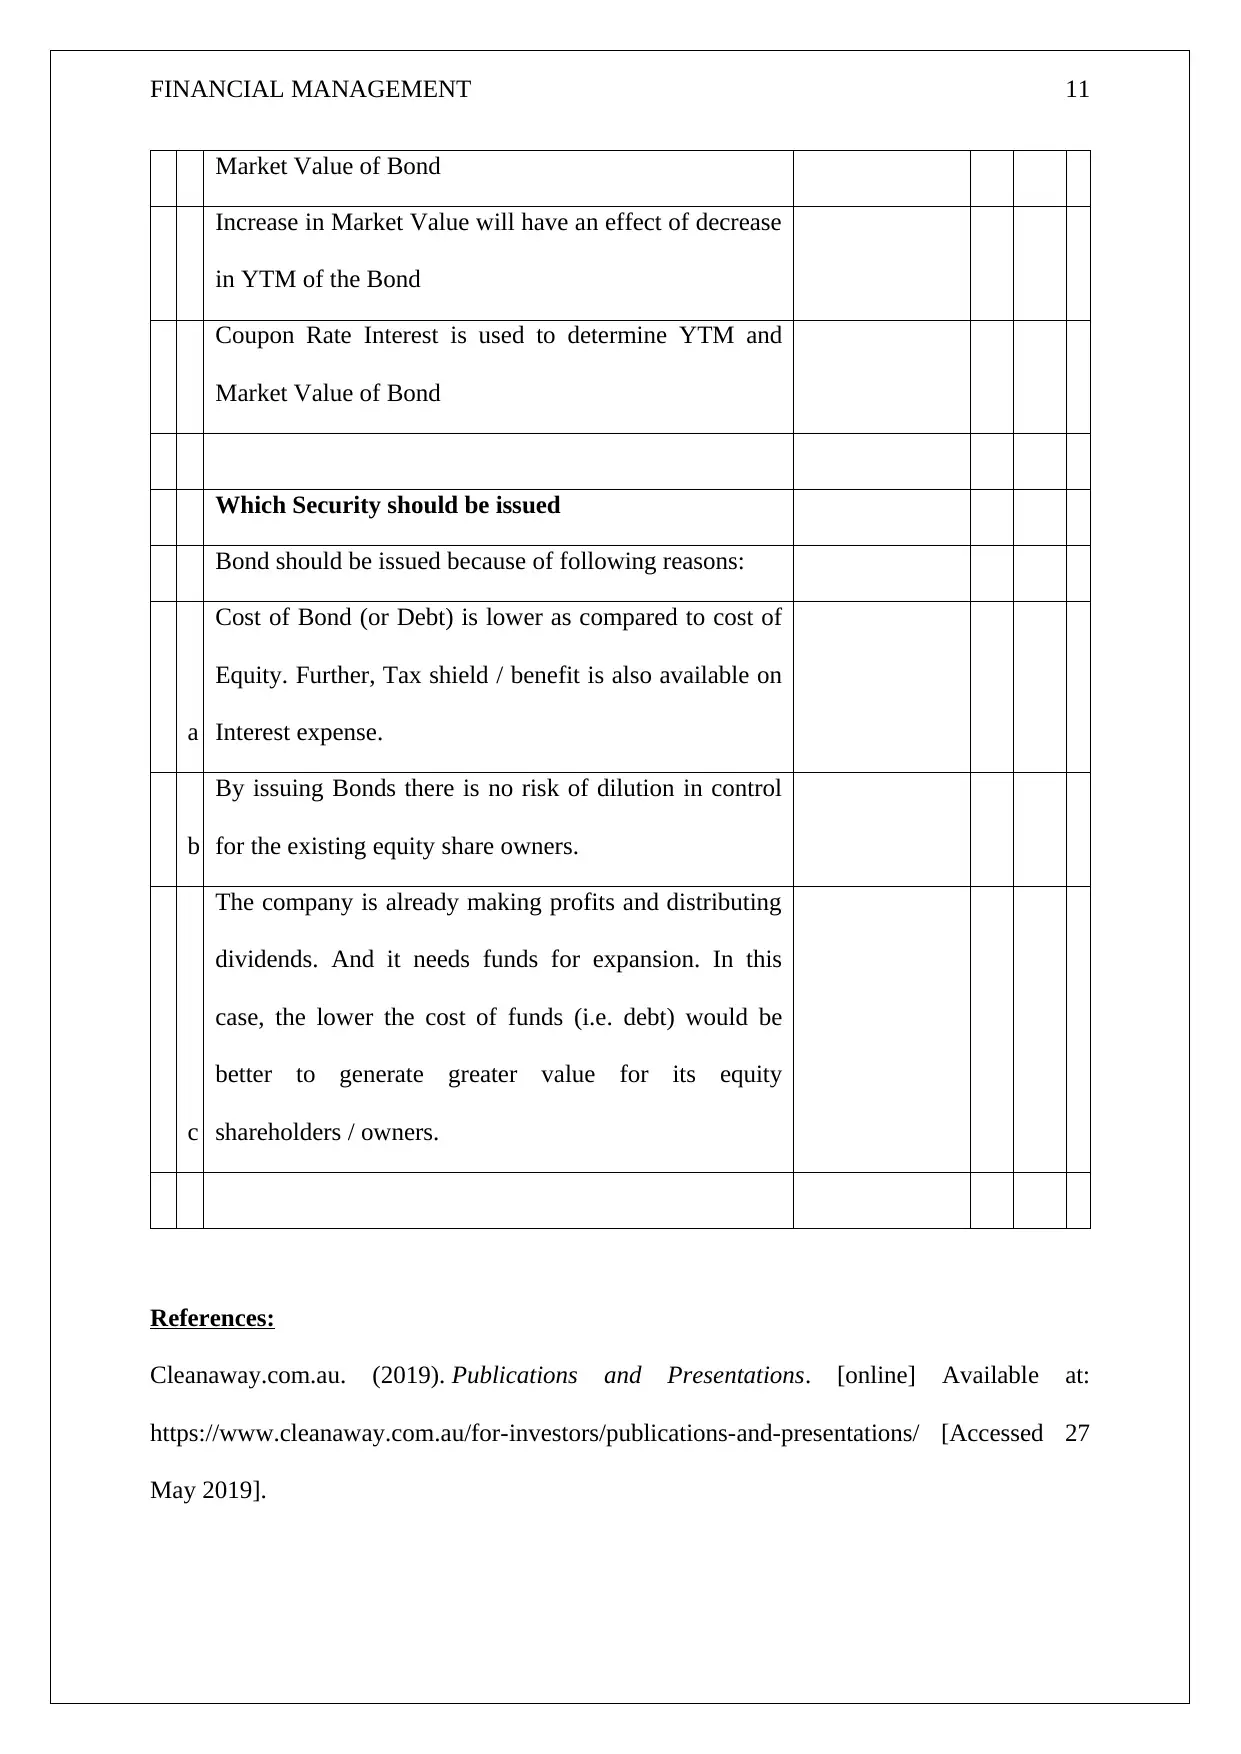
Market Value of Bond
Increase in Market Value will have an effect of decrease
in YTM of the Bond
Coupon Rate Interest is used to determine YTM and
Market Value of Bond
Which Security should be issued
Bond should be issued because of following reasons:
a
Cost of Bond (or Debt) is lower as compared to cost of
Equity. Further, Tax shield / benefit is also available on
Interest expense.
b
By issuing Bonds there is no risk of dilution in control
for the existing equity share owners.
c
The company is already making profits and distributing
dividends. And it needs funds for expansion. In this
case, the lower the cost of funds (i.e. debt) would be
better to generate greater value for its equity
shareholders / owners.
References:
Cleanaway.com.au. (2019). Publications and Presentations. [online] Available at:
https://www.cleanaway.com.au/for-investors/publications-and-presentations/ [Accessed 27
May 2019].
Market Value of Bond
Increase in Market Value will have an effect of decrease
in YTM of the Bond
Coupon Rate Interest is used to determine YTM and
Market Value of Bond
Which Security should be issued
Bond should be issued because of following reasons:
a
Cost of Bond (or Debt) is lower as compared to cost of
Equity. Further, Tax shield / benefit is also available on
Interest expense.
b
By issuing Bonds there is no risk of dilution in control
for the existing equity share owners.
c
The company is already making profits and distributing
dividends. And it needs funds for expansion. In this
case, the lower the cost of funds (i.e. debt) would be
better to generate greater value for its equity
shareholders / owners.
References:
Cleanaway.com.au. (2019). Publications and Presentations. [online] Available at:
https://www.cleanaway.com.au/for-investors/publications-and-presentations/ [Accessed 27
May 2019].
FINANCIAL MANAGEMENT 12
eFinanceManagement.com. (2019). Financial Analysis | Using Ratios: Profitability,
Liquidity, Leverage, Activity. [online] Available at:
https://efinancemanagement.com/financial-analysis [Accessed 27 May 2019].
eFinanceManagement.com. (2019). How to Analyze and Improve Debt to Total Asset Ratio?
| eFinanceManagement.com. [online] Available at:
https://efinancemanagement.com/financial-analysis/how-to-analyze-and-improve-debt-to-
total-asset-ratio [Accessed 27 May 2019].
Niresh, A. (n.d.). The Relationship between Capital Structure & Profitability. [online]
Globaljournals.org. Available at: https://globaljournals.org/item/756-the-relationship-
between-capital-structure-profitability [Accessed 27 May 2019].
Arditti, F. (2019). RISK AND THE REQUIRED RETURN ON EQUITY. [online]
onlinelibrary.wiley.com. Available at:
https://onlinelibrary.wiley.com/doi/abs/10.1111/j.1540-6261.1967.tb01651.x [Accessed 29
May 2019].
BHANDARI, L. (2019). Debt/Equity Ratio and Expected Common Stock Returns: Empirical
Evidence. [online] onlinelibrary.wiley.com. Available at:
https://onlinelibrary.wiley.com/doi/abs/10.1111/j.1540-6261.1988.tb03952.x [Accessed 29
May 2019].
Burton, R. (2002). Return on Assets Loss from Situational and Contingency Misfits. [online]
pubsonline.informs.org. Available at:
https://pubsonline.informs.org/doi/abs/10.1287/mnsc.48.11.1461.262 [Accessed 29 May
2019].
⊘ This is a preview!⊘
Do you want full access?
Subscribe today to unlock all pages.
Trusted by 1+ million students worldwide
1 out of 16
Related Documents


Your All-in-One AI-Powered Toolkit for Academic Success.
+13062052269
info@desklib.com
Available 24*7 on WhatsApp / Email
![[object Object]](/_next/static/media/star-bottom.7253800d.svg)
Unlock your academic potential
Copyright © 2020–2026 A2Z Services. All Rights Reserved. Developed and managed by ZUCOL.