Assessment 3: Climate and Fire - Natural Hazards and Disasters Report

Verified

Added on  2022/09/07

|7
|1328
|17
Report
AI Summary
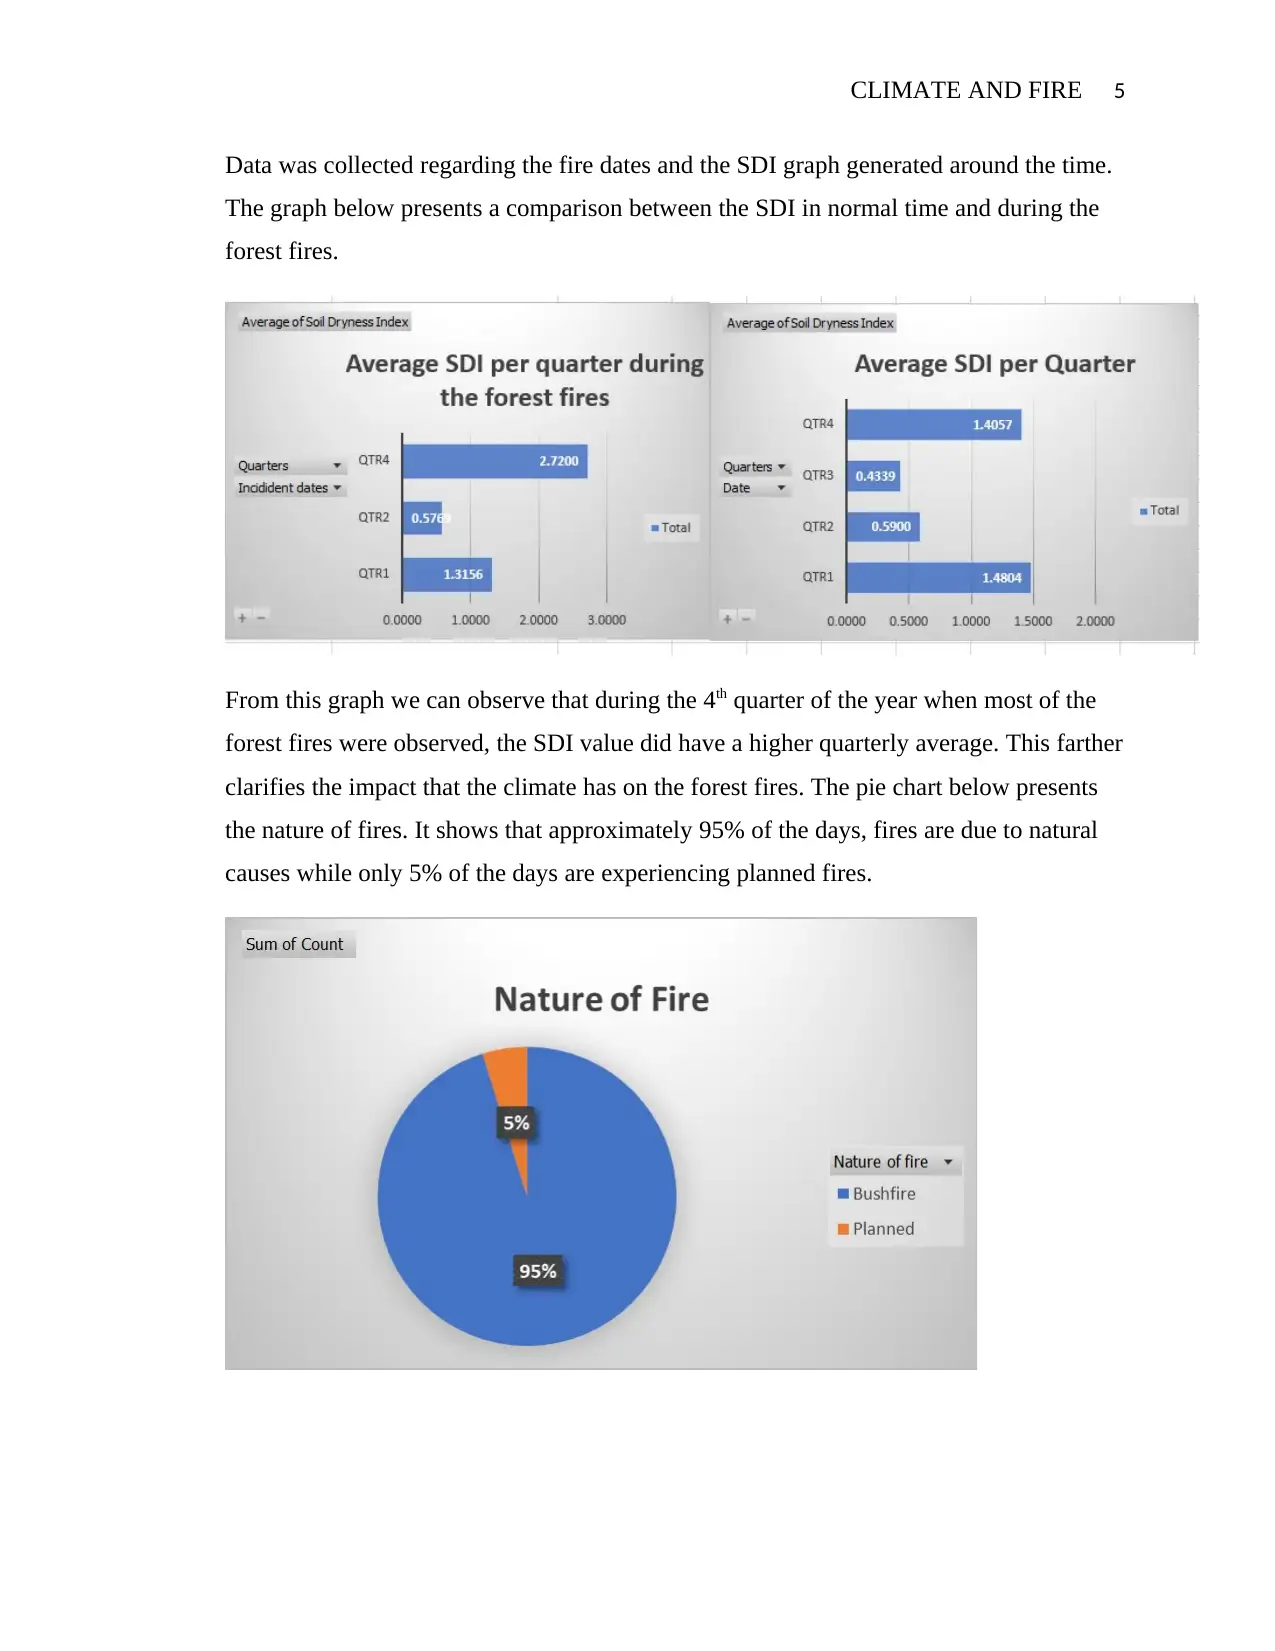
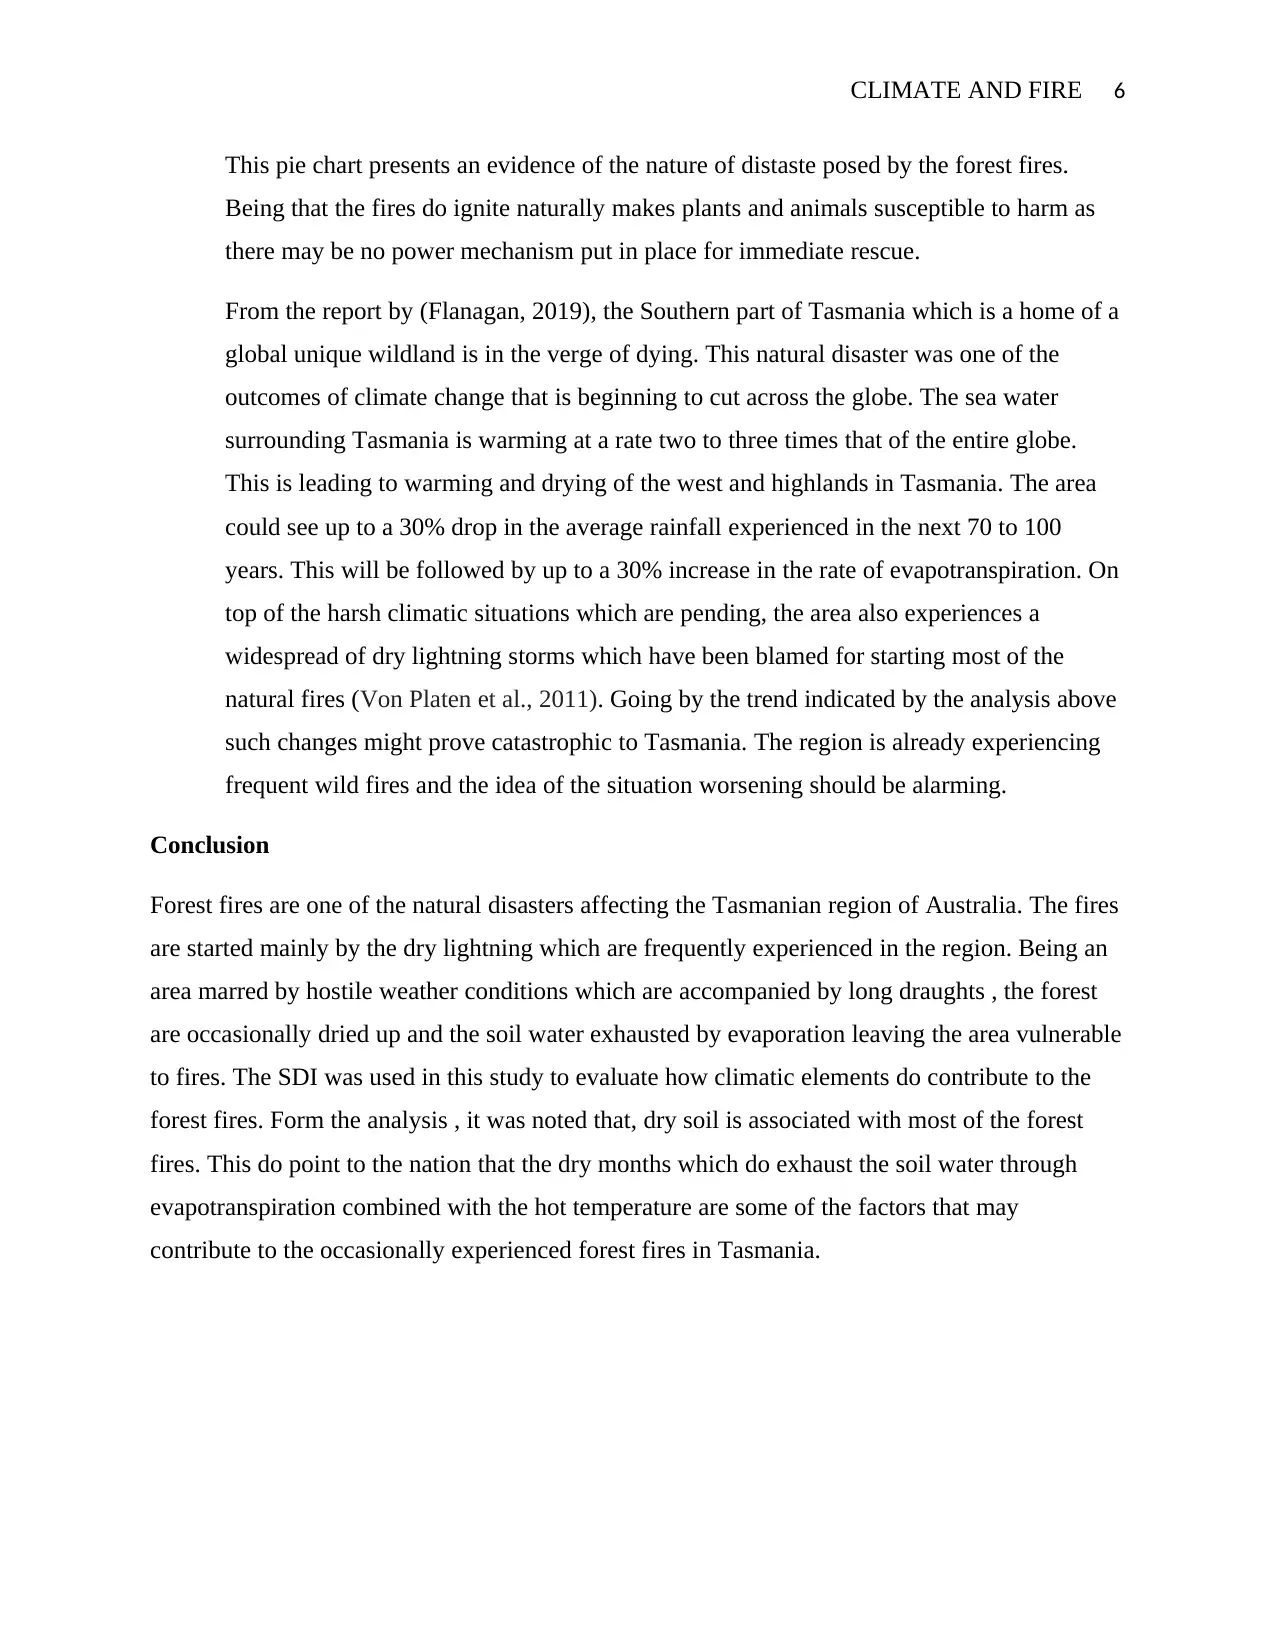
This report examines the relationship between climate and fire in Tasmania, focusing on the climatic factors that contribute to bushfires. It analyzes the soil dryness index (SDI) from 2012 to 2019, comparing it with rainfall data and fire history to evaluate the potential for fire hazards. The study reveals that higher SDI values, indicating drier soil conditions, coincide with increased fire occurrences, particularly during the first and fourth quarters of the year when rainfall is lower. The report also discusses the impact of dry lightning storms and the warming climate on the region, emphasizing the vulnerability of Tasmanian forests to fire. The analysis utilizes graphs and charts to illustrate the correlation between climate variables and fire events, highlighting the role of evapotranspiration and temperature in exacerbating the risk. The report concludes that the combination of dry conditions and natural ignition sources significantly increases the likelihood of forest fires in Tasmania.
Document Page
CLIMATE AND FIRE 1
XBR 208- Natural Hazards and Disasters
Assessment 3: Climate and Fire
Student Name
Institution Name
Date
tabler-icon-diamond-filled.svg

Paraphrase This Document

Need a fresh take? Get an instant paraphrase of this document with our AI Paraphraser
Document Page
CLIMATE AND FIRE 2
Introduction
Forest fire is one of the main natural hazards and disasters that are affecting Tasmania.
Climatic factors like humidity, temperature, wind, rainfall and atmospheric stability are some of
the factors that contribute to the frequent bushfires that occasionally affect Tasmania. The
variations in some of these climatic factors have seen Tasmanian Wilderness World heritage
record several large fires (Marris, 2016). The frequent dry lightning storms together with land
area that is continuously becoming susceptible to fires has made the region more vulnerable to
fires that occasionally sweep large areas. This has led to loss of many trees and animal species in
the affected areas. In 2016, after along period of dry and hot summer which left the vegetation
and soil dry, dry lightning spark did trigger several fires that burned over 120,000 Ha of land
cover with over 20,000 hectares been affected in the lake Mackenzie area. The fire destroyed
around 85 Ha of Pencil pine (Bliss, Prior & Bowman, 2019). This report is designed to highlight
the climatic conditions associated with fire as a way of evaluating the potentially of the fire
hazard. The analysis will involve analyzing the soil dryness index with special attention given to
the SDI trend during the forest fires.
Analysis of the association between climate and fire
1. Soil Dryness Index between 2012 to 2019
The soil dryness index (SDI) is the value used to measure the amount of rainfall that is
needed to saturate the top layer of the soil within a forest area. The SDI indicates the
quantity of effective rainfall that is necessary to saturate the soil profile when the soil is
dry. The value of SDI ranges between 0 mm and 200 mm. An SDI of 0 indicates a fully
saturated soil while an SDI of 200 indicates an extremely dry soil. The value is derived
using the formula;
SDI ( 1 ) =SD ( 0 ) + ET ER
Where
SDI (1 )=¿The current day SDI
SD ( 0 )=¿The previous day SDI
ET =The evapotra nspiration value
E R=¿the effective rainfall calculated by 0.8daily rainfall .
Document Page
CLIMATE AND FIRE 3
The climate data was derived from (Queensland Government, 2020), from this data the
daily rainfall were extracted from 2012 to 2019 and the data used to calculate the SDI.
The figure below presents a line graph of the Tasmanian SDI from July 2012 to 2019
Looking at the graph we can conclude that the SDI is higher during the 1st and 4th quarter
of the years compared to the 2nd and 3rd quarter. The SDI value can be interpreted that
during the last and first quarters of the year, the climate tend to be more environmentally
hostile rendering the forests vulnerable to forest fires.
The two graphs presented below gives a comparison of the SDI and daily rainfall values
Document Page
CLIMATE AND FIRE 4
As can be observed in the two graphs, the average SDI per quarter is higher in the 1st and
4th quarters of the year. Looking at the quarterly rainfall distribution, it can be noted that
the 1st and 4th quarter do receive lower rainfall amount compared to the 2nd and 3rd
quarter. This clarifies that SDI is higher when rainfall volumes are low and lower
otherwise (Chen, eta. 2015).
2. Fire history and SDI analysis
The map highlights the Fire history around the Tasmanian region of Australia.
tabler-icon-diamond-filled.svg

Paraphrase This Document

Need a fresh take? Get an instant paraphrase of this document with our AI Paraphraser
Document Page
CLIMATE AND FIRE 5
Data was collected regarding the fire dates and the SDI graph generated around the time.
The graph below presents a comparison between the SDI in normal time and during the
forest fires.
From this graph we can observe that during the 4th quarter of the year when most of the
forest fires were observed, the SDI value did have a higher quarterly average. This farther
clarifies the impact that the climate has on the forest fires. The pie chart below presents
the nature of fires. It shows that approximately 95% of the days, fires are due to natural
causes while only 5% of the days are experiencing planned fires.
Document Page
CLIMATE AND FIRE 6
This pie chart presents an evidence of the nature of distaste posed by the forest fires.
Being that the fires do ignite naturally makes plants and animals susceptible to harm as
there may be no power mechanism put in place for immediate rescue.
From the report by (Flanagan, 2019), the Southern part of Tasmania which is a home of a
global unique wildland is in the verge of dying. This natural disaster was one of the
outcomes of climate change that is beginning to cut across the globe. The sea water
surrounding Tasmania is warming at a rate two to three times that of the entire globe.
This is leading to warming and drying of the west and highlands in Tasmania. The area
could see up to a 30% drop in the average rainfall experienced in the next 70 to 100
years. This will be followed by up to a 30% increase in the rate of evapotranspiration. On
top of the harsh climatic situations which are pending, the area also experiences a
widespread of dry lightning storms which have been blamed for starting most of the
natural fires (Von Platen et al., 2011). Going by the trend indicated by the analysis above
such changes might prove catastrophic to Tasmania. The region is already experiencing
frequent wild fires and the idea of the situation worsening should be alarming.
Conclusion
Forest fires are one of the natural disasters affecting the Tasmanian region of Australia. The fires
are started mainly by the dry lightning which are frequently experienced in the region. Being an
area marred by hostile weather conditions which are accompanied by long draughts , the forest
are occasionally dried up and the soil water exhausted by evaporation leaving the area vulnerable
to fires. The SDI was used in this study to evaluate how climatic elements do contribute to the
forest fires. Form the analysis , it was noted that, dry soil is associated with most of the forest
fires. This do point to the nation that the dry months which do exhaust the soil water through
evapotranspiration combined with the hot temperature are some of the factors that may
contribute to the occasionally experienced forest fires in Tasmania.
Document Page
CLIMATE AND FIRE 7
References
Bliss, A., Prior, L. and Bowman, D., 2019. Relicts at Risk: Impacts of the 2016 Tasmanian Fires
on Pencil Pine (Athrotaxis Cupressoides).
Chen, S., Wen, Z., Jiang, H., Zhao, Q., Zhang, X. and Chen, Y., 2015. Temperature vegetation
dryness index estimation of soil moisture under different tree species. Sustainability, 7(9), pp.
11401-11417.
Flanagan, R., 2019. Tasmania is burning. The climate disaster future has arrived while those in
power laugh at us. [Online]
Available at: https://www.theguardian.com/environment/2019/feb/05/tasmania-is-burning-the-
climate-disaster-future-has-arrived-while-those-in-power-laugh-at-us
[Accessed 30 March 2020].
Marris, E., 2016. Tasmanian bushfires threaten iconic ancient forests. Nature News, 530(7589),
p. 137
Queensland Government, 2020. SILO-Australian Climate Data from 1889 to Yesterday. [Online]
Available at: https://www.longpaddock.qld.gov.au/silo/point-data/#responseTab1
[Accessed 31 March 2020].
Von Platen, J., Kirkpatrick, J.B. and Allen, K. J., 2011. Fire frequency variation in south-eastern
Tasmanian dry eucalypt forest 1740–2004 from fire scars. Australian Forestry, 74(3), pp. 180-
189.
chevron_up_icon
1 out of 7
circle_padding
hide_on_mobile
zoom_out_icon
[object Object]