Assessing the Climate Impact on Water Quality in Little Yarra River
VerifiedAdded on 2023/06/12
|44
|8381
|326
Report
AI Summary
This report investigates the impact of climate conditions, including rainfall, temperature, evaporation, and precipitation, on the water quality of the Little Yarra River in Victoria, Australia. Water quality parameters such as pH, total nitrogen (TN), total phosphate (TP), dissolved oxygen (DO), electrical conductivity (EC), biological oxygen demand (BOD), chemical oxygen demand (COD), turbidity, dissolved substances, and toxic substances were analyzed. Data from 1963 to 2017 was correlated using Microsoft Excel to identify relationships between climatic factors and water quality variables. The results indicate a strong correlation between climatic changes and water quality parameters, such as the effect of rainfall on dissolved oxygen levels. The report concludes by emphasizing the need for continuous monitoring of water quality to protect aquatic life and mitigate the adverse effects of climate change, referencing relevant literature and studies on similar topics.
CLIMATE IMPACT ON WATER QUALITY
Student information
Unit information
Submission weeks and date
Student information
Unit information
Submission weeks and date
Paraphrase This Document
Need a fresh take? Get an instant paraphrase of this document with our AI Paraphraser
Executive Summary
This project is about the impact of climatic conditions on the water quality of the Little Yarra
River in Victoria state Melbourne. Data has been collected on climatic conditions comprising
rainfall, temperature, evaporation and precipitation and on water quality conditions comprising
PH, TN (Total Nitrogen), TP (Total Phosphate), DO (Dissolved Oxygen), EC (Electrical
Conductivity), BOD (Biological Oxygen Demand), COD, Turbidity, Dissolved substances and
Toxic substances. This data is correlated using the Microsoft excel software to come up with
accurate comparisons between the climatic conditions and the parameters of water quality.
Results have been documented and analyzed. The results indicate that the water quality
parameters are strongly affected by the climatic changes, for example the concentration of DO is
affected by the amount of rainfall. These findings suggest that the relevant authorities should
keenly monitor water quality to protect aquatic life.
Student Contributions
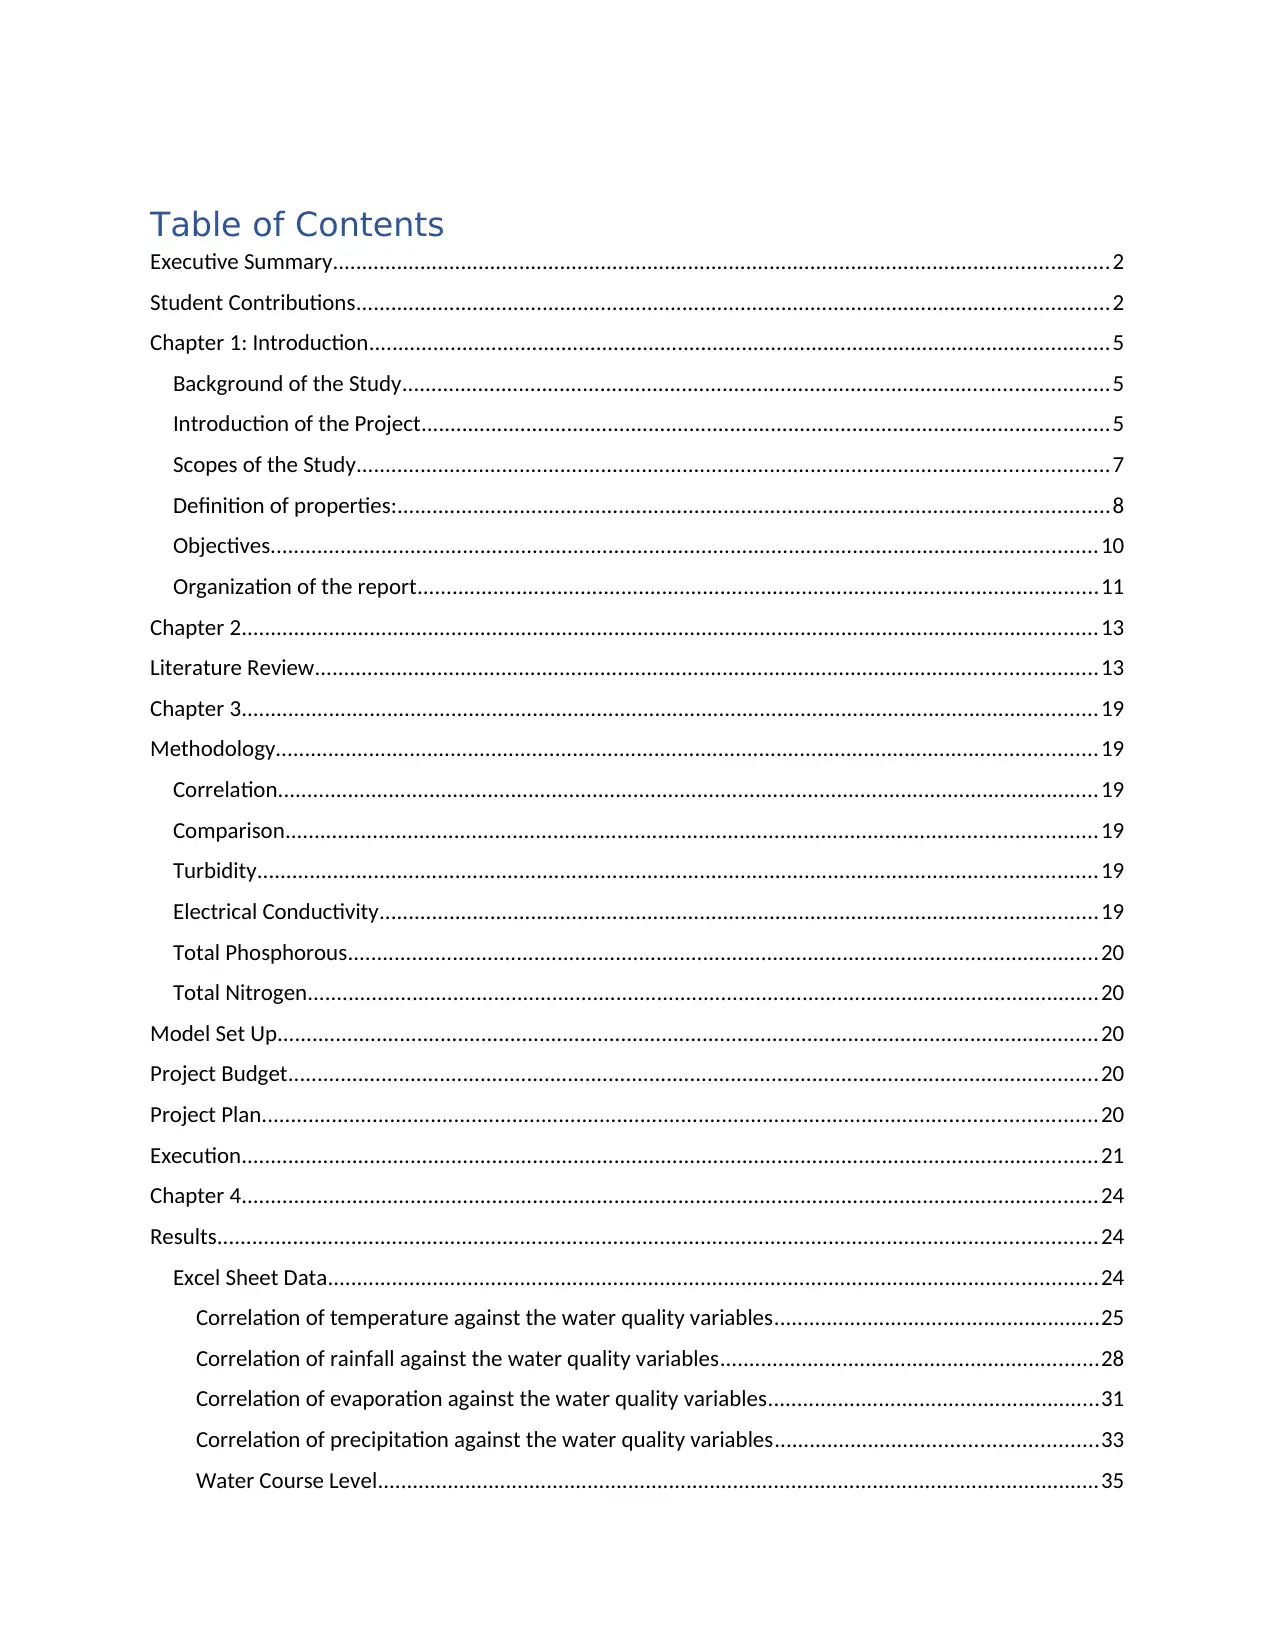
Table of Contents
Executive Summary.....................................................................................................................................2
Student Contributions.................................................................................................................................2
Chapter 1: Introduction...............................................................................................................................5
Background of the Study.........................................................................................................................5
Introduction of the Project......................................................................................................................5
Scopes of the Study.................................................................................................................................7
Definition of properties:..........................................................................................................................8
Objectives..............................................................................................................................................10
Organization of the report.....................................................................................................................11
Chapter 2...................................................................................................................................................13
Literature Review......................................................................................................................................13
Chapter 3...................................................................................................................................................19
Methodology.............................................................................................................................................19
Correlation.............................................................................................................................................19
Comparison...........................................................................................................................................19
Turbidity................................................................................................................................................19
Electrical Conductivity...........................................................................................................................19
Total Phosphorous.................................................................................................................................20
Total Nitrogen........................................................................................................................................20
Model Set Up.............................................................................................................................................20
Project Budget...........................................................................................................................................20
Project Plan...............................................................................................................................................20
Execution...................................................................................................................................................21
Chapter 4...................................................................................................................................................24
Results.......................................................................................................................................................24
Excel Sheet Data....................................................................................................................................24
Correlation of temperature against the water quality variables........................................................25
Correlation of rainfall against the water quality variables.................................................................28
Correlation of evaporation against the water quality variables.........................................................31
Correlation of precipitation against the water quality variables.......................................................33
Water Course Level............................................................................................................................35
⊘ This is a preview!⊘
Do you want full access?
Subscribe today to unlock all pages.
Trusted by 1+ million students worldwide
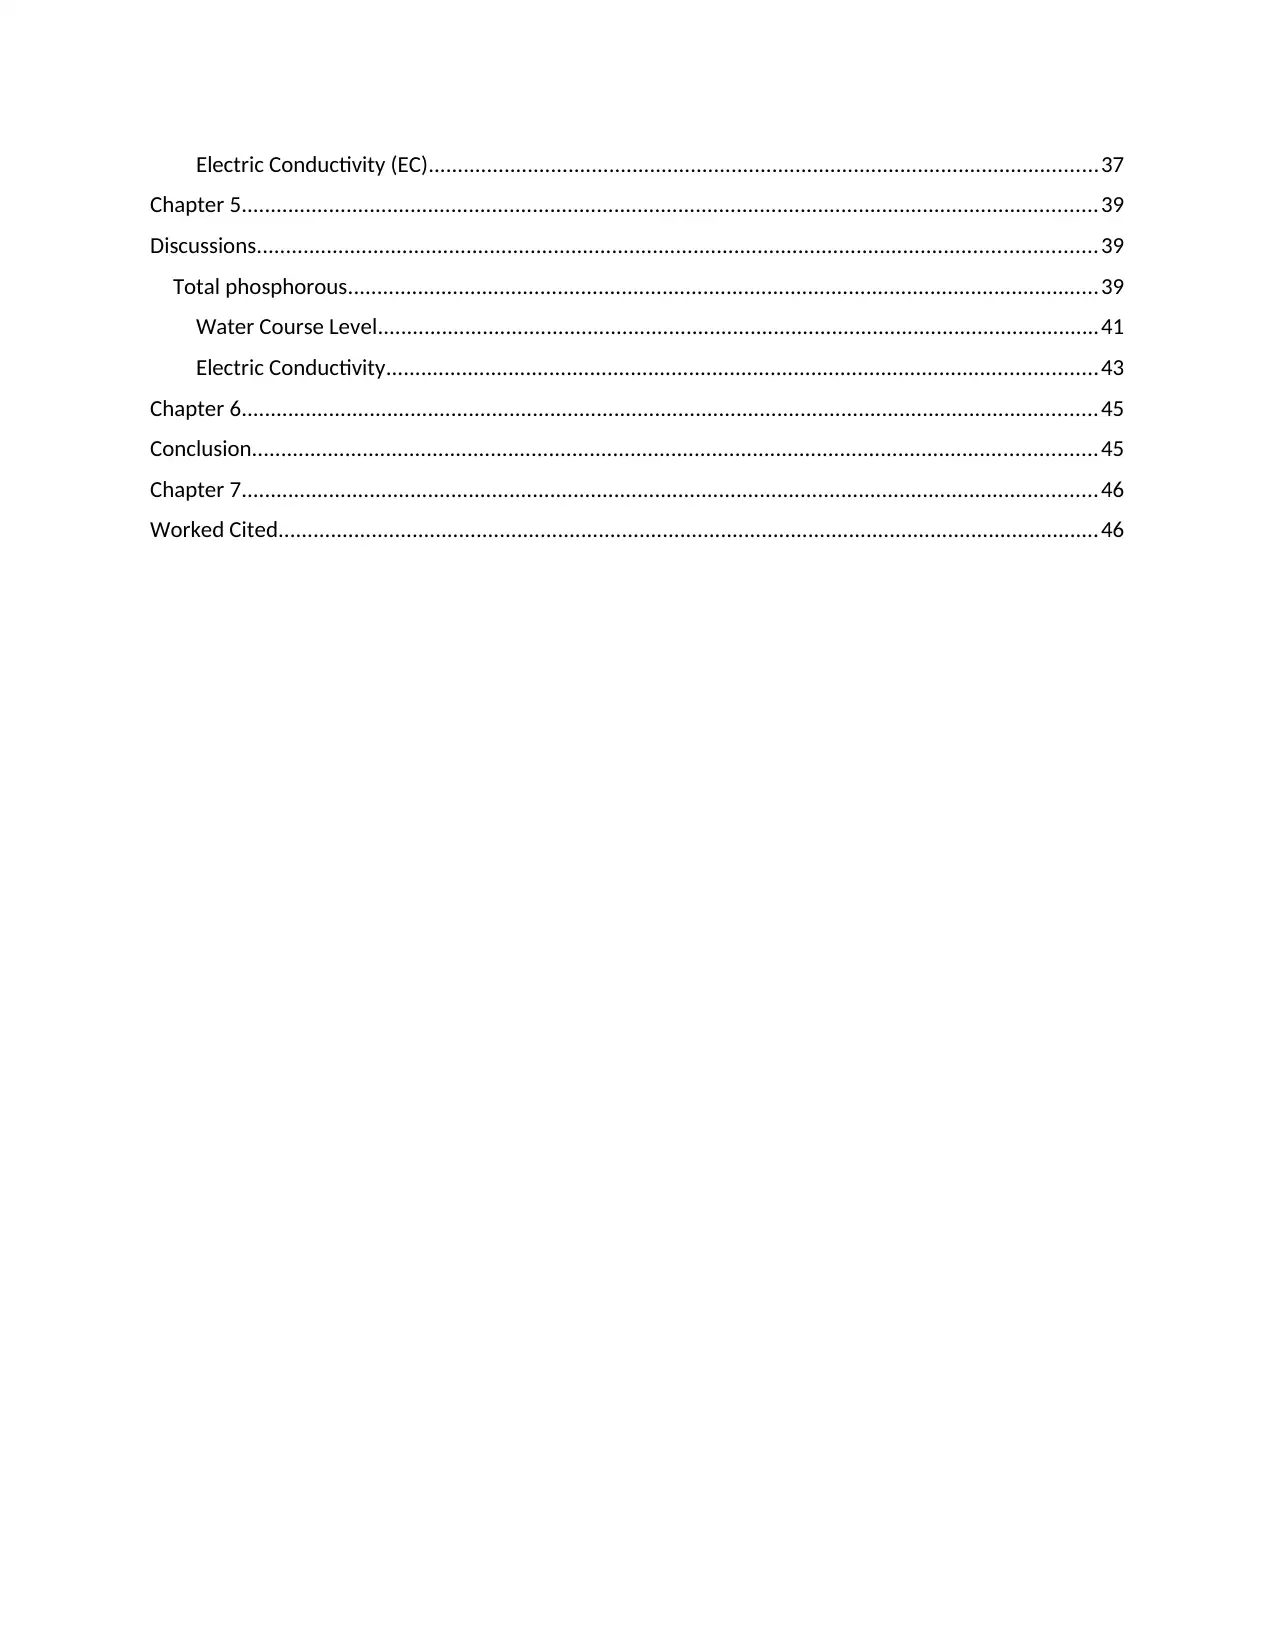
Electric Conductivity (EC)...................................................................................................................37
Chapter 5...................................................................................................................................................39
Discussions................................................................................................................................................39
Total phosphorous.................................................................................................................................39
Water Course Level............................................................................................................................41
Electric Conductivity..........................................................................................................................43
Chapter 6...................................................................................................................................................45
Conclusion.................................................................................................................................................45
Chapter 7...................................................................................................................................................46
Worked Cited.............................................................................................................................................46
Paraphrase This Document
Need a fresh take? Get an instant paraphrase of this document with our AI Paraphraser
Chapter 1: Introduction
Background of the Study
There has been increase water demand on Little Yarra River at Yarra Junction due to increased
agricultural and industrial activity and demand due to population growth. Climatic changes over
the years have had an impact on the rivers’ water quality (Barua et al. 2013). The water quality
statistics have been documented in excel and correlation done for analysis besides prediction has
been done to determine the expected water quality changes in the future using the current result.
The results lead to a prediction that global warming will lead to a decrease in nutrients in the
water (Crutzen et al. 2016)
Climate change is known to have a significant effect on water quality of water bodies. The
central effect of climate change on water quality is credited to hydrology and changing air
temperature (Schewe et al. 2014)
Persistent drought in the Victoria state has affected the surrounding water bodies including the
Little Yarra river (Daly et al. 2013 ). This has necessitated the monitoring of the water bodies
and a keen study on the water qualities of the area rivers.
Introduction of the Project
Water demand in Little Yarra River has increased over the years and is probable to increase in
the subsequent years because of increased demand (Cole and Stewart 2013 ). Climate is the
weather statistics documented after a long period of time, it’s a result of observing the variation
in metrological variables such as humidity, temperature, rainfall and wind (Pindyck 2013). In
this project we will analyze the Little Yarra river located at Yarra junction. The sampling will be
in the duration between 1963 and 2007. Water quality is sampled weekly by Melbourne water in
the Little Yarra River at Yarra junction. We will analyze the water quality parameters
comprising Turbidity, COD, dissolved oxygen, toxic substances, TN, TP, PH, EC, BOD and
correlate them with temperature, evaporation and rainfall. The Little Yarra river in our analysis
flows in from the southeast, it goes through the Yarra junction township joining the Yarra river
(Koster, Dawson and Crook 2013)
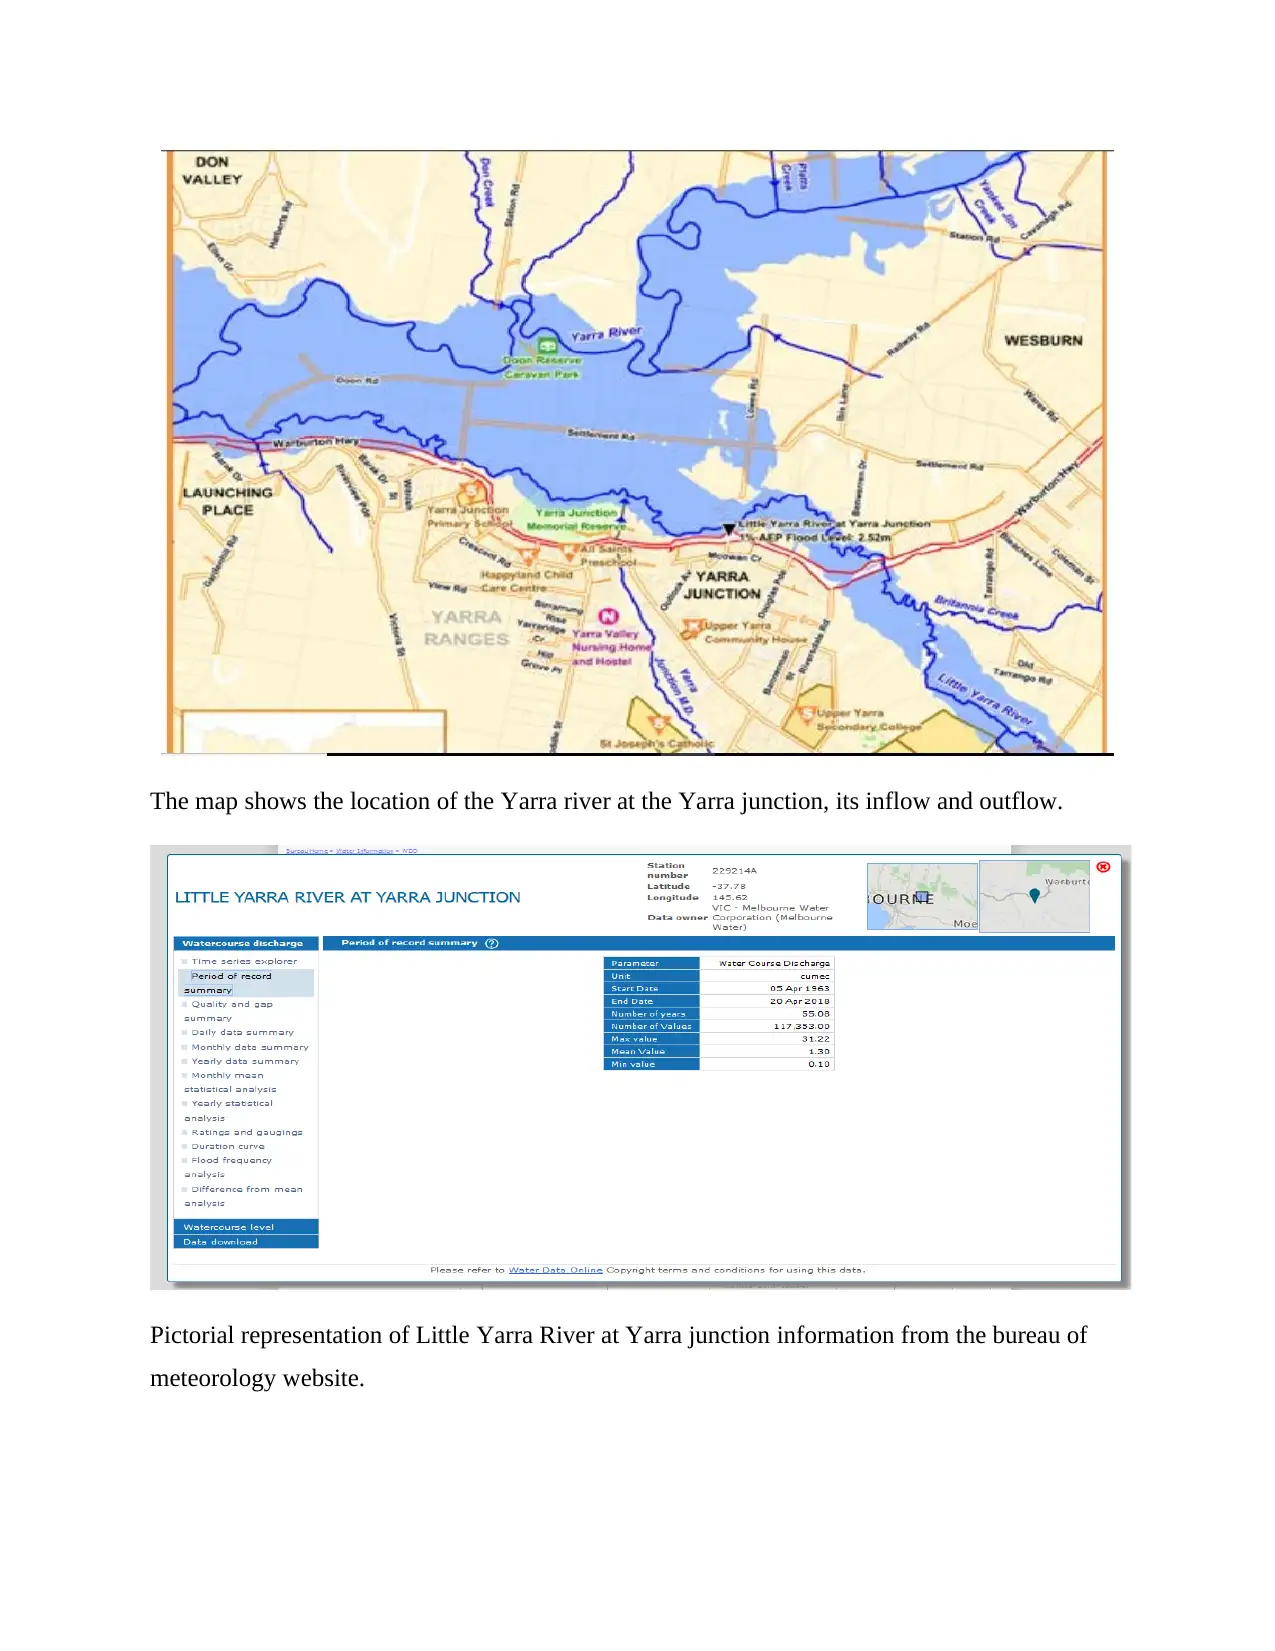
The map shows the location of the Yarra river at the Yarra junction, its inflow and outflow.
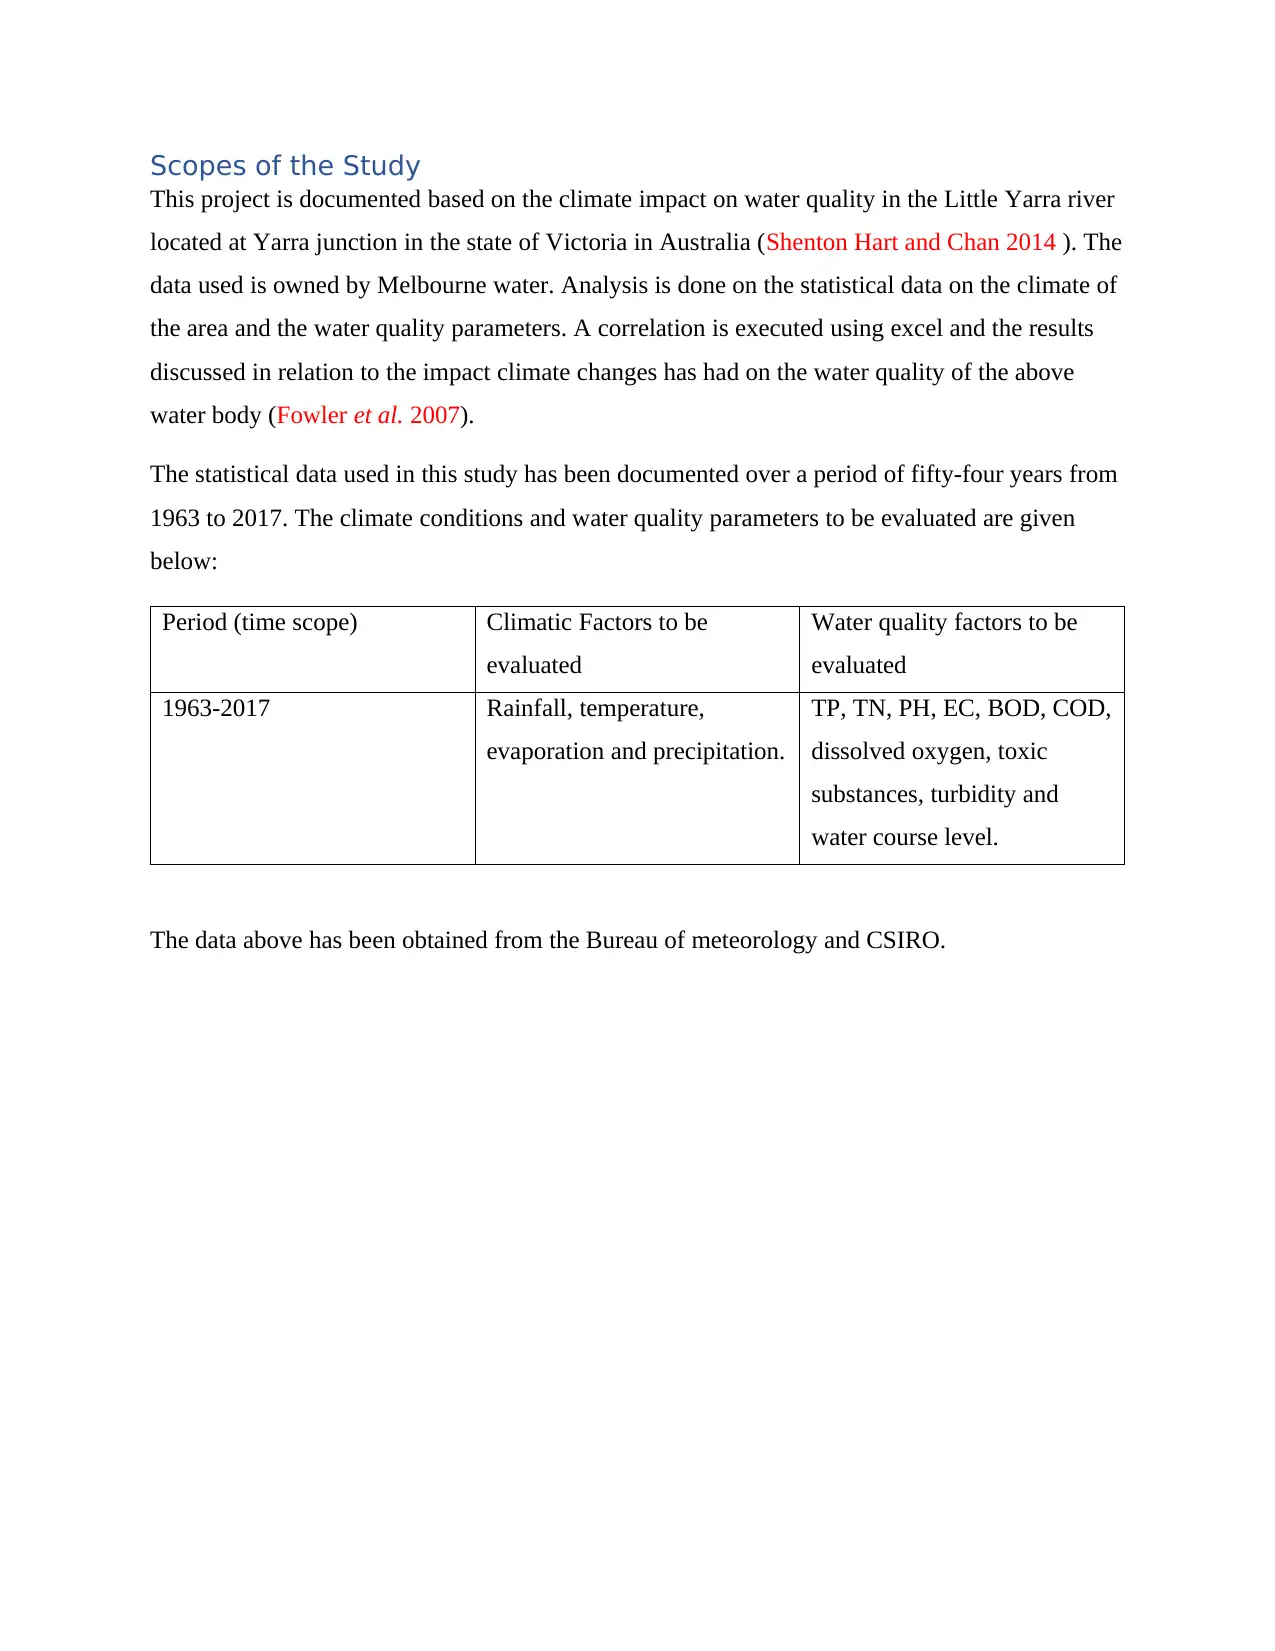
Pictorial representation of Little Yarra River at Yarra junction information from the bureau of
meteorology website.
Pictorial representation of Little Yarra River at Yarra junction information from the bureau of
meteorology website.
⊘ This is a preview!⊘
Do you want full access?
Subscribe today to unlock all pages.
Trusted by 1+ million students worldwide
Scopes of the Study
This project is documented based on the climate impact on water quality in the Little Yarra river
located at Yarra junction in the state of Victoria in Australia (Shenton Hart and Chan 2014 ). The
data used is owned by Melbourne water. Analysis is done on the statistical data on the climate of
the area and the water quality parameters. A correlation is executed using excel and the results
discussed in relation to the impact climate changes has had on the water quality of the above
water body (Fowler et al. 2007).
The statistical data used in this study has been documented over a period of fifty-four years from
1963 to 2017. The climate conditions and water quality parameters to be evaluated are given
below:
Period (time scope) Climatic Factors to be
evaluated
Water quality factors to be
evaluated
1963-2017 Rainfall, temperature,
evaporation and precipitation.
TP, TN, PH, EC, BOD, COD,
dissolved oxygen, toxic
substances, turbidity and
water course level.
The data above has been obtained from the Bureau of meteorology and CSIRO.
Paraphrase This Document
Need a fresh take? Get an instant paraphrase of this document with our AI Paraphraser
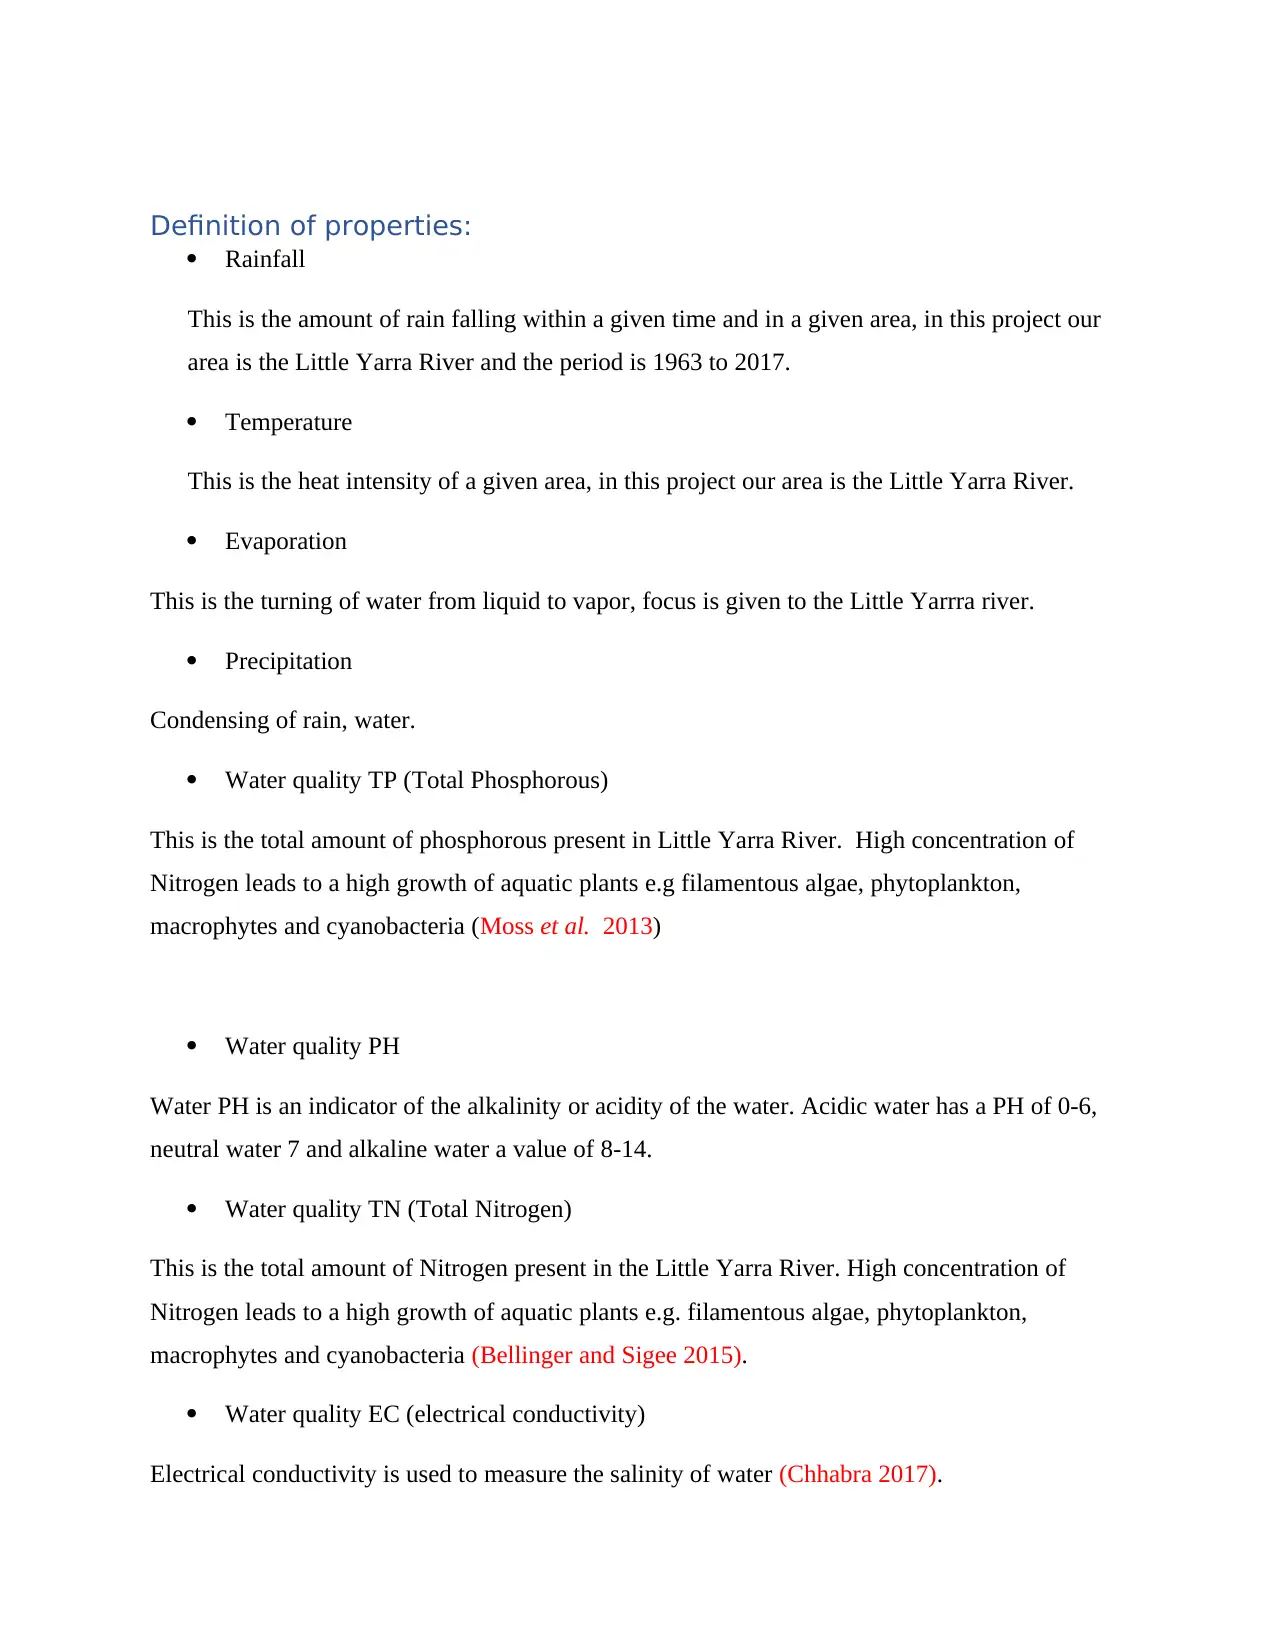
Definition of properties:
Rainfall
This is the amount of rain falling within a given time and in a given area, in this project our
area is the Little Yarra River and the period is 1963 to 2017.
Temperature
This is the heat intensity of a given area, in this project our area is the Little Yarra River.
Evaporation
This is the turning of water from liquid to vapor, focus is given to the Little Yarrra river.
Precipitation
Condensing of rain, water.
Water quality TP (Total Phosphorous)
This is the total amount of phosphorous present in Little Yarra River. High concentration of
Nitrogen leads to a high growth of aquatic plants e.g filamentous algae, phytoplankton,
macrophytes and cyanobacteria (Moss et al. 2013)
Water quality PH
Water PH is an indicator of the alkalinity or acidity of the water. Acidic water has a PH of 0-6,
neutral water 7 and alkaline water a value of 8-14.
Water quality TN (Total Nitrogen)
This is the total amount of Nitrogen present in the Little Yarra River. High concentration of
Nitrogen leads to a high growth of aquatic plants e.g. filamentous algae, phytoplankton,
macrophytes and cyanobacteria (Bellinger and Sigee 2015).
Water quality EC (electrical conductivity)
Electrical conductivity is used to measure the salinity of water (Chhabra 2017).
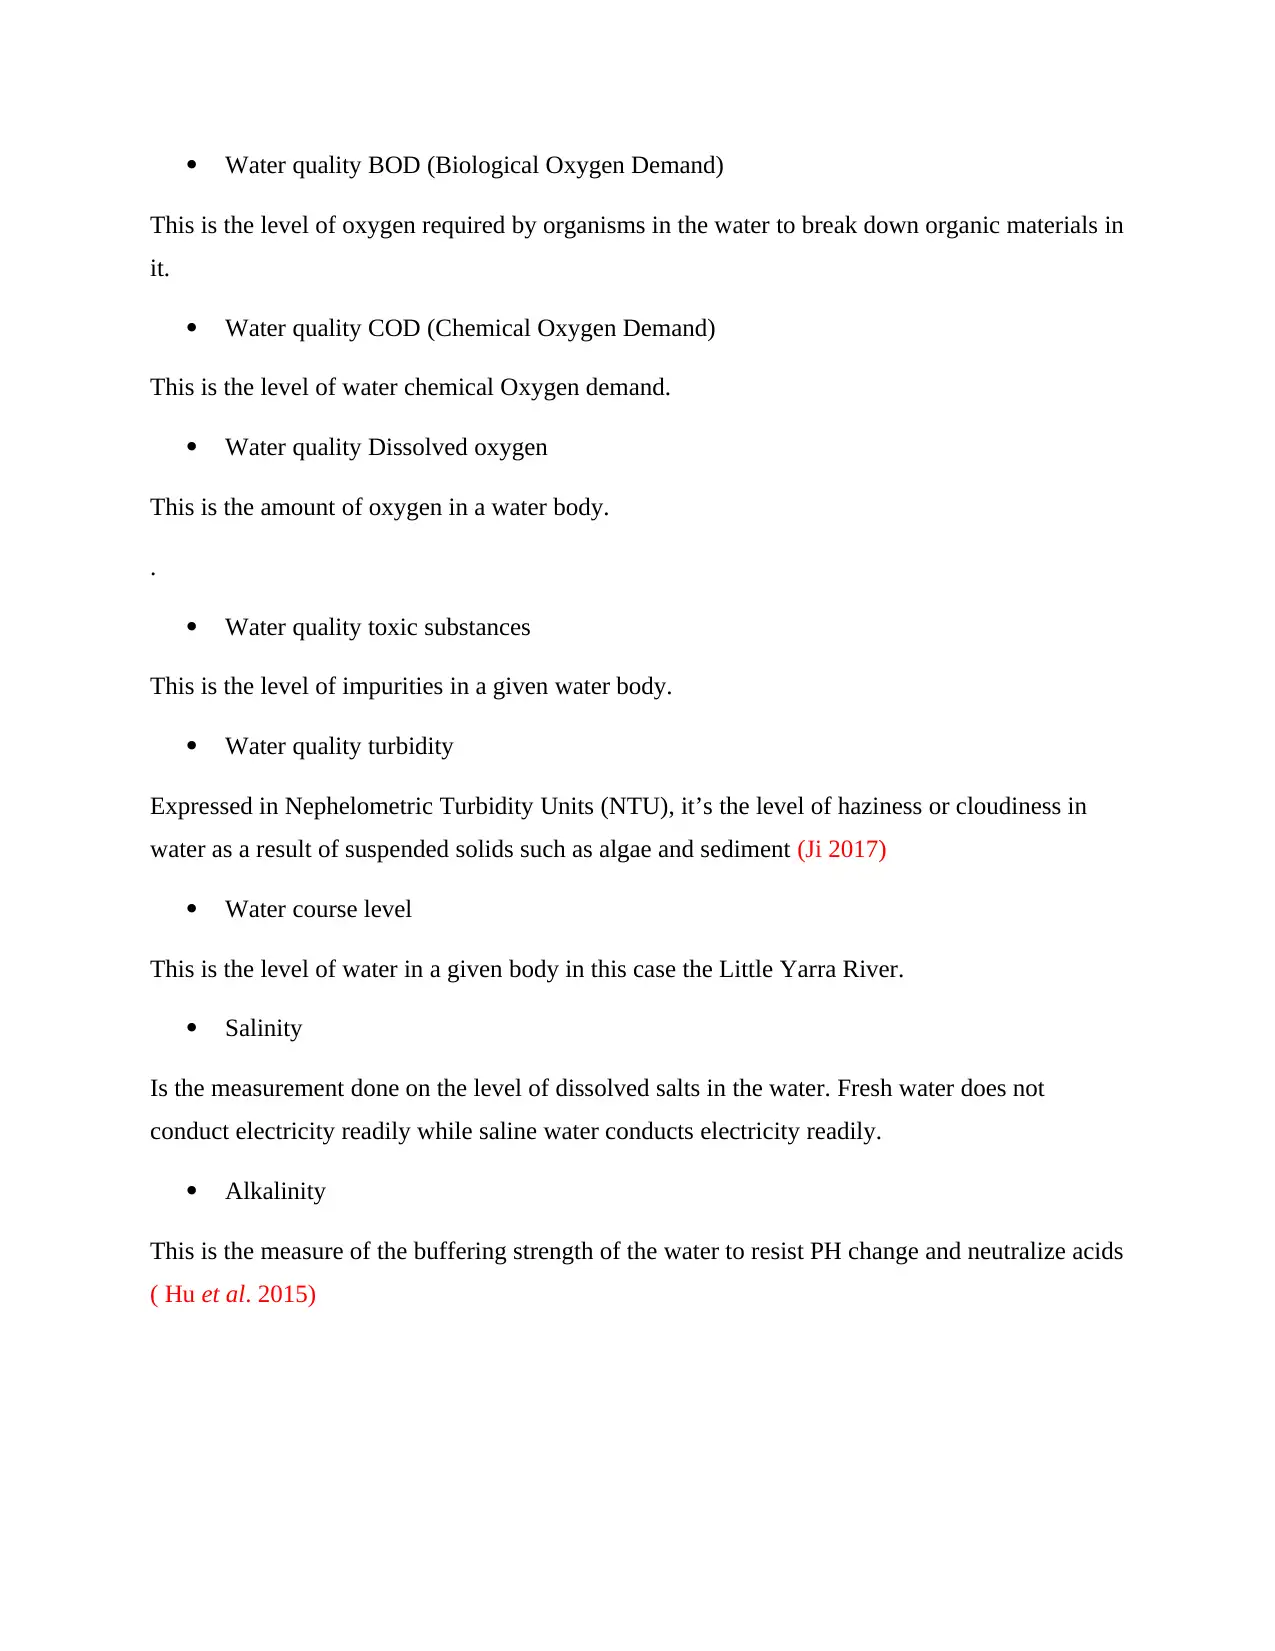
Water quality BOD (Biological Oxygen Demand)
This is the level of oxygen required by organisms in the water to break down organic materials in
it.
Water quality COD (Chemical Oxygen Demand)
This is the level of water chemical Oxygen demand.
Water quality Dissolved oxygen
This is the amount of oxygen in a water body.
.
Water quality toxic substances
This is the level of impurities in a given water body.
Water quality turbidity
Expressed in Nephelometric Turbidity Units (NTU), it’s the level of haziness or cloudiness in
water as a result of suspended solids such as algae and sediment (Ji 2017)
Water course level
This is the level of water in a given body in this case the Little Yarra River.
Salinity
Is the measurement done on the level of dissolved salts in the water. Fresh water does not
conduct electricity readily while saline water conducts electricity readily.
Alkalinity
This is the measure of the buffering strength of the water to resist PH change and neutralize acids
( Hu et al. 2015)
⊘ This is a preview!⊘
Do you want full access?
Subscribe today to unlock all pages.
Trusted by 1+ million students worldwide
Objectives
The objectives of our project are given below:
To correlate rainfall, temperature and evaporation with water quality parameters.
Document longtime database to determine climatic and water quality trends.
Determine variation in water quality between years.
Determine the causes of water quality problems.
Come up with remedies to the water quality problems.
Determine Little Yarra River water quality physical, chemical and biological properties.
Paraphrase This Document
Need a fresh take? Get an instant paraphrase of this document with our AI Paraphraser
Organization of the report
The report has six chapters which are arranged as follows:
Chapter 1: Introduction
Chapter 2: Literature Review
Chapter 3: Methodology
Chapter 4: Results
Chapter 5: Discussions
Chapter 6: Concluding remarks
Chapter 7: References
Additionally, there is the top page, executive summary, student contributions and table of
contents at the beginning of the project and Appendices at the bottom of the project paper.
Chapter 2
Literature Review
Delpla et al undertook a study on rivers in Victoria state Melbourne to asses water demands and
climate impact on water quality and the future of water demand. He found out that an increase in
water supply to the rivers including the Little Yarra River is required, this will increase water
quality, I agree with the findings of Delpla climate changes have a major effect on water
quantities thus affect supply(Haddelend 2014). A study by Canadian experts on climate change
due to hydrological effects shows that low flow events due to climate change will be of less
concern as compared to high flow events. The study further shows that lower flow rates and
higher temperatures in water during winter may result to impairment to water quality in rivers
(Taylor et al. 2013).
A study by Fowler outlines that increase in biological oxygen demand (BOD), increase in total
phosphorous (TP), increase in ammonium concentration and a decrease in DO concentration in a
given river may be as a result of lower flow in summer (Mosley 2015). This may result in a
faster algae growth. Parris indicates in his research that water quality parameters are more
sensitive to changes in flow as compared to changes in the climate (van Vliet et al. 2013). He
gave an example of Dissolved Oxygen (DO) concentrations being up during the ice cover
periods, this is most probably as a result of reaeration of the river. In late fall and early spring
Dissolve Oxygen (DO) declines. Chen further specifies that there is a decrease in phosphate
levels in summer (Chen et al. 2015). In the study on climatic changes it has been stated that
increase in oxygen and water temperature enhance nutrients release from sediments this leads to
the water column having more nutrients (Valiela 2013)
Fowler in his journal writes that due to consistent global warming in the universe there is a
change in the climate and water quality parameters. There is a notable decline in stream flows
and the dissolved oxygen (DO) concentrations. The decreasing levels of DO are a major threat to
ecological health in the river (Postel 2014). There is a specific worry on the effects on national
endangered species such as the Macquarie perch, Australian grayling and the Murray cod.
There was a focus catchment project undertaken by the eWater CRC and other organisations in
partnership. This organizations had an interest in the Little Yarra river and the Yarra river both in
⊘ This is a preview!⊘
Do you want full access?
Subscribe today to unlock all pages.
Trusted by 1+ million students worldwide
1 out of 44
Your All-in-One AI-Powered Toolkit for Academic Success.
+13062052269
info@desklib.com
Available 24*7 on WhatsApp / Email
![[object Object]](/_next/static/media/star-bottom.7253800d.svg)
Unlock your academic potential
Copyright © 2020–2026 A2Z Services. All Rights Reserved. Developed and managed by ZUCOL.