Data Analysis Report: Climate Change, Nuclear Power, and Health

Verified

Added on  2023/01/11

|52
|5445
|70
Report
AI Summary
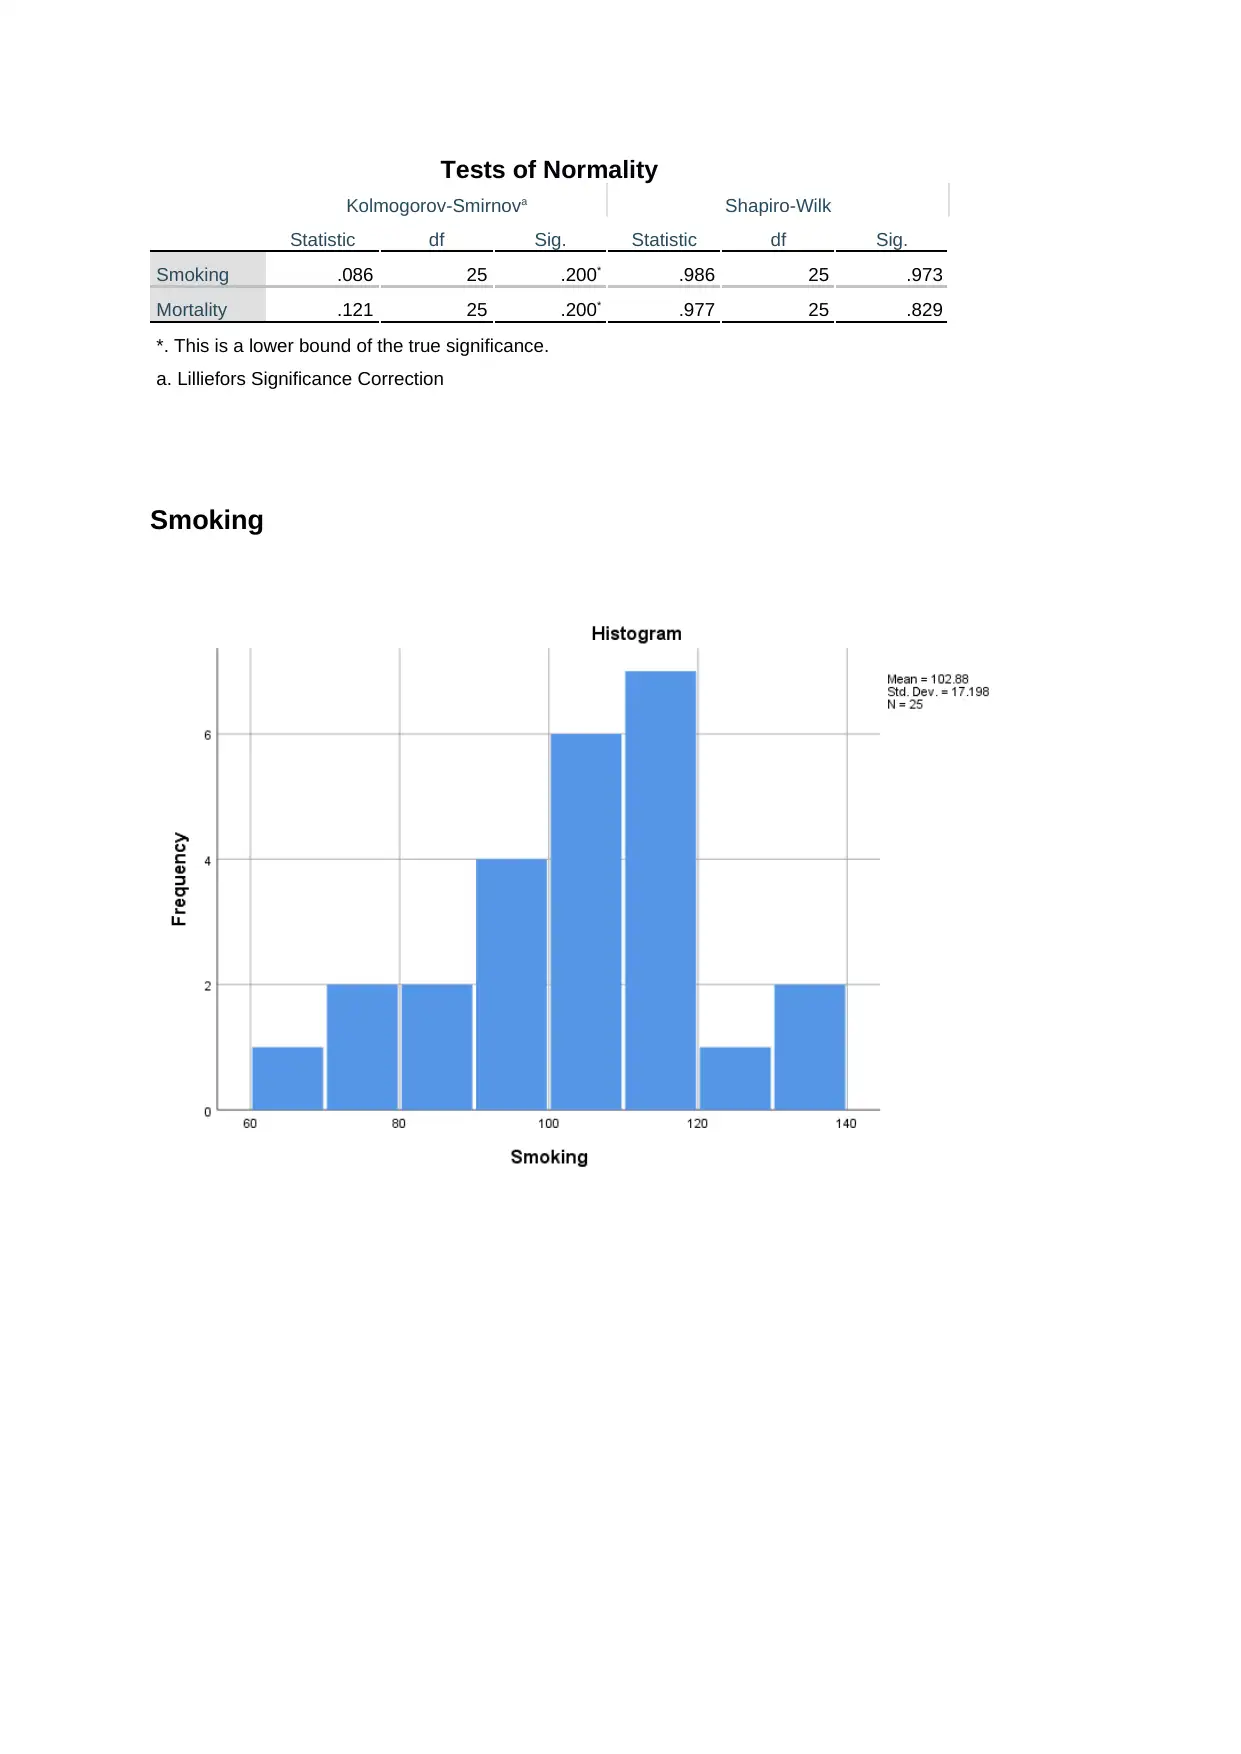
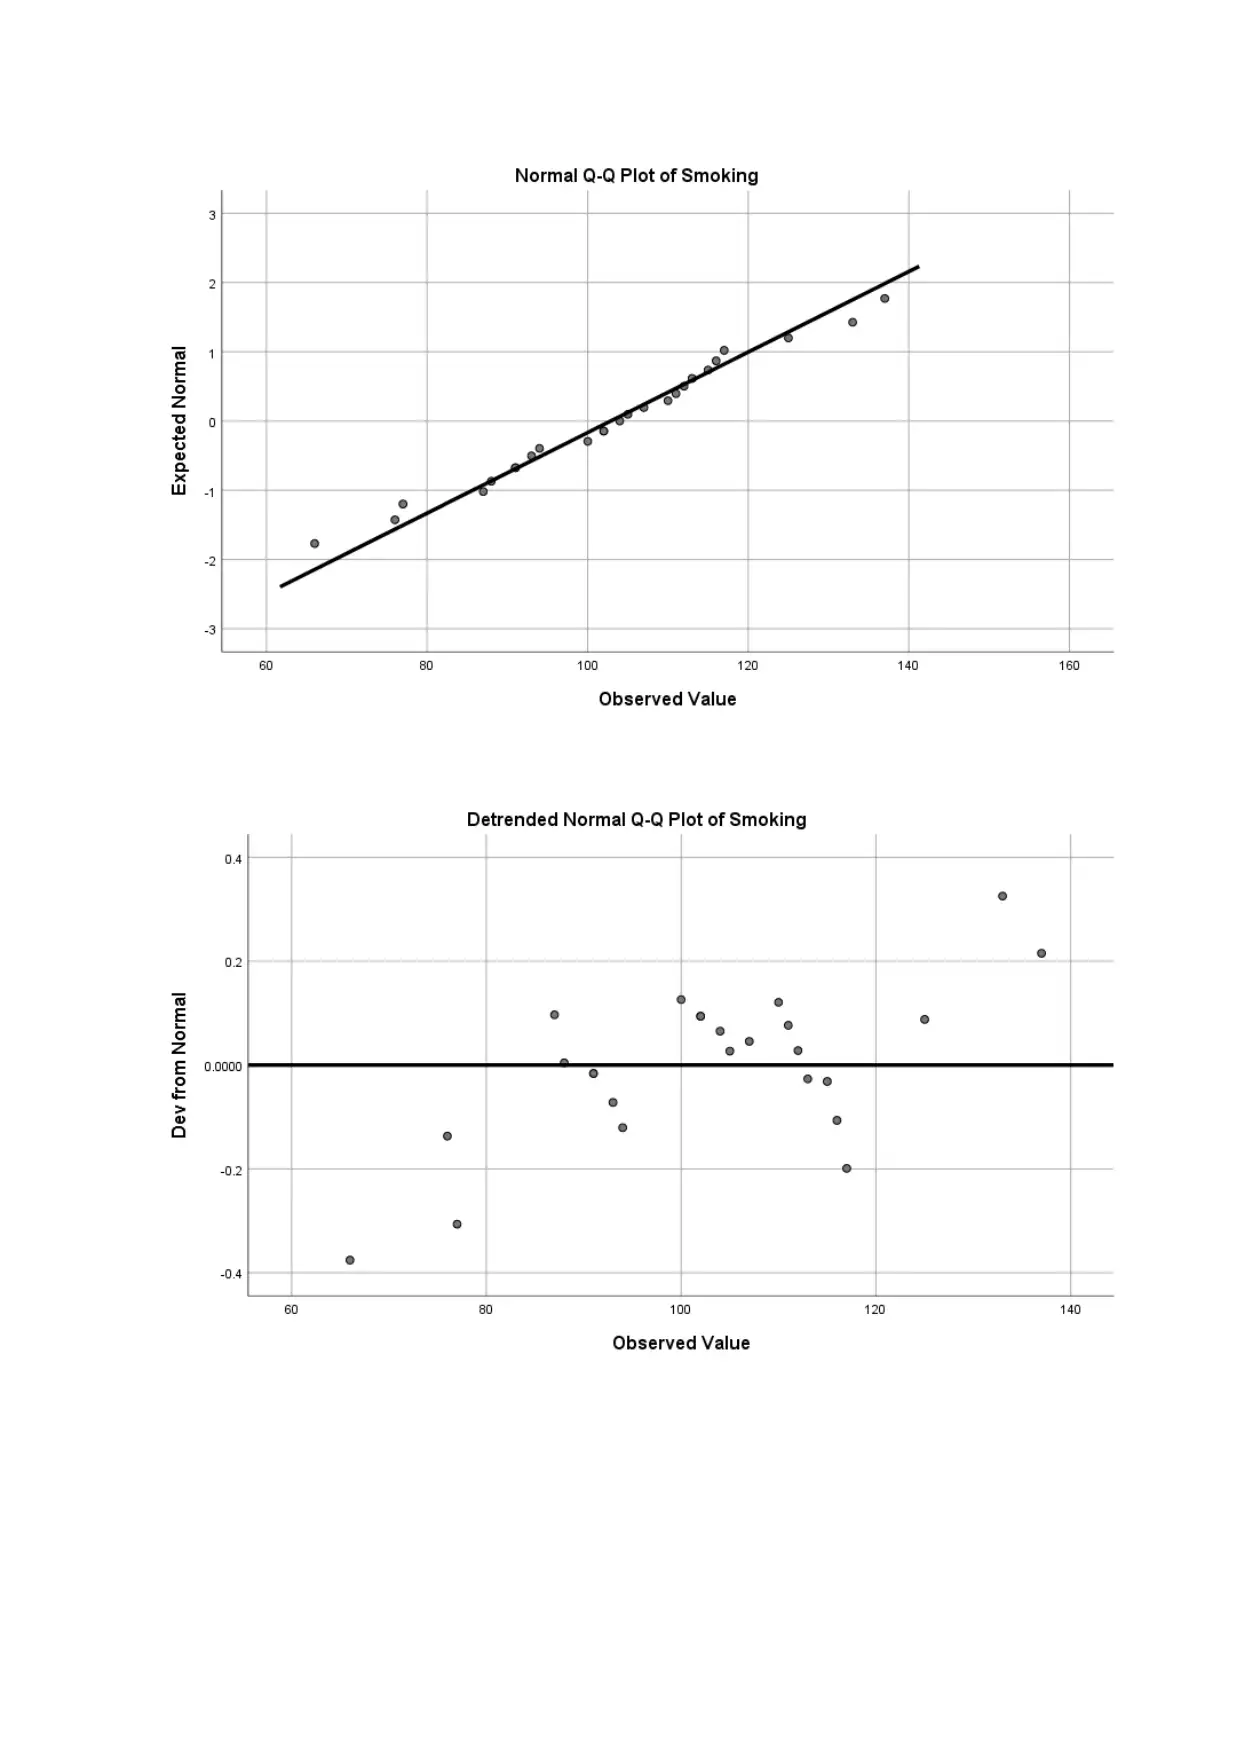
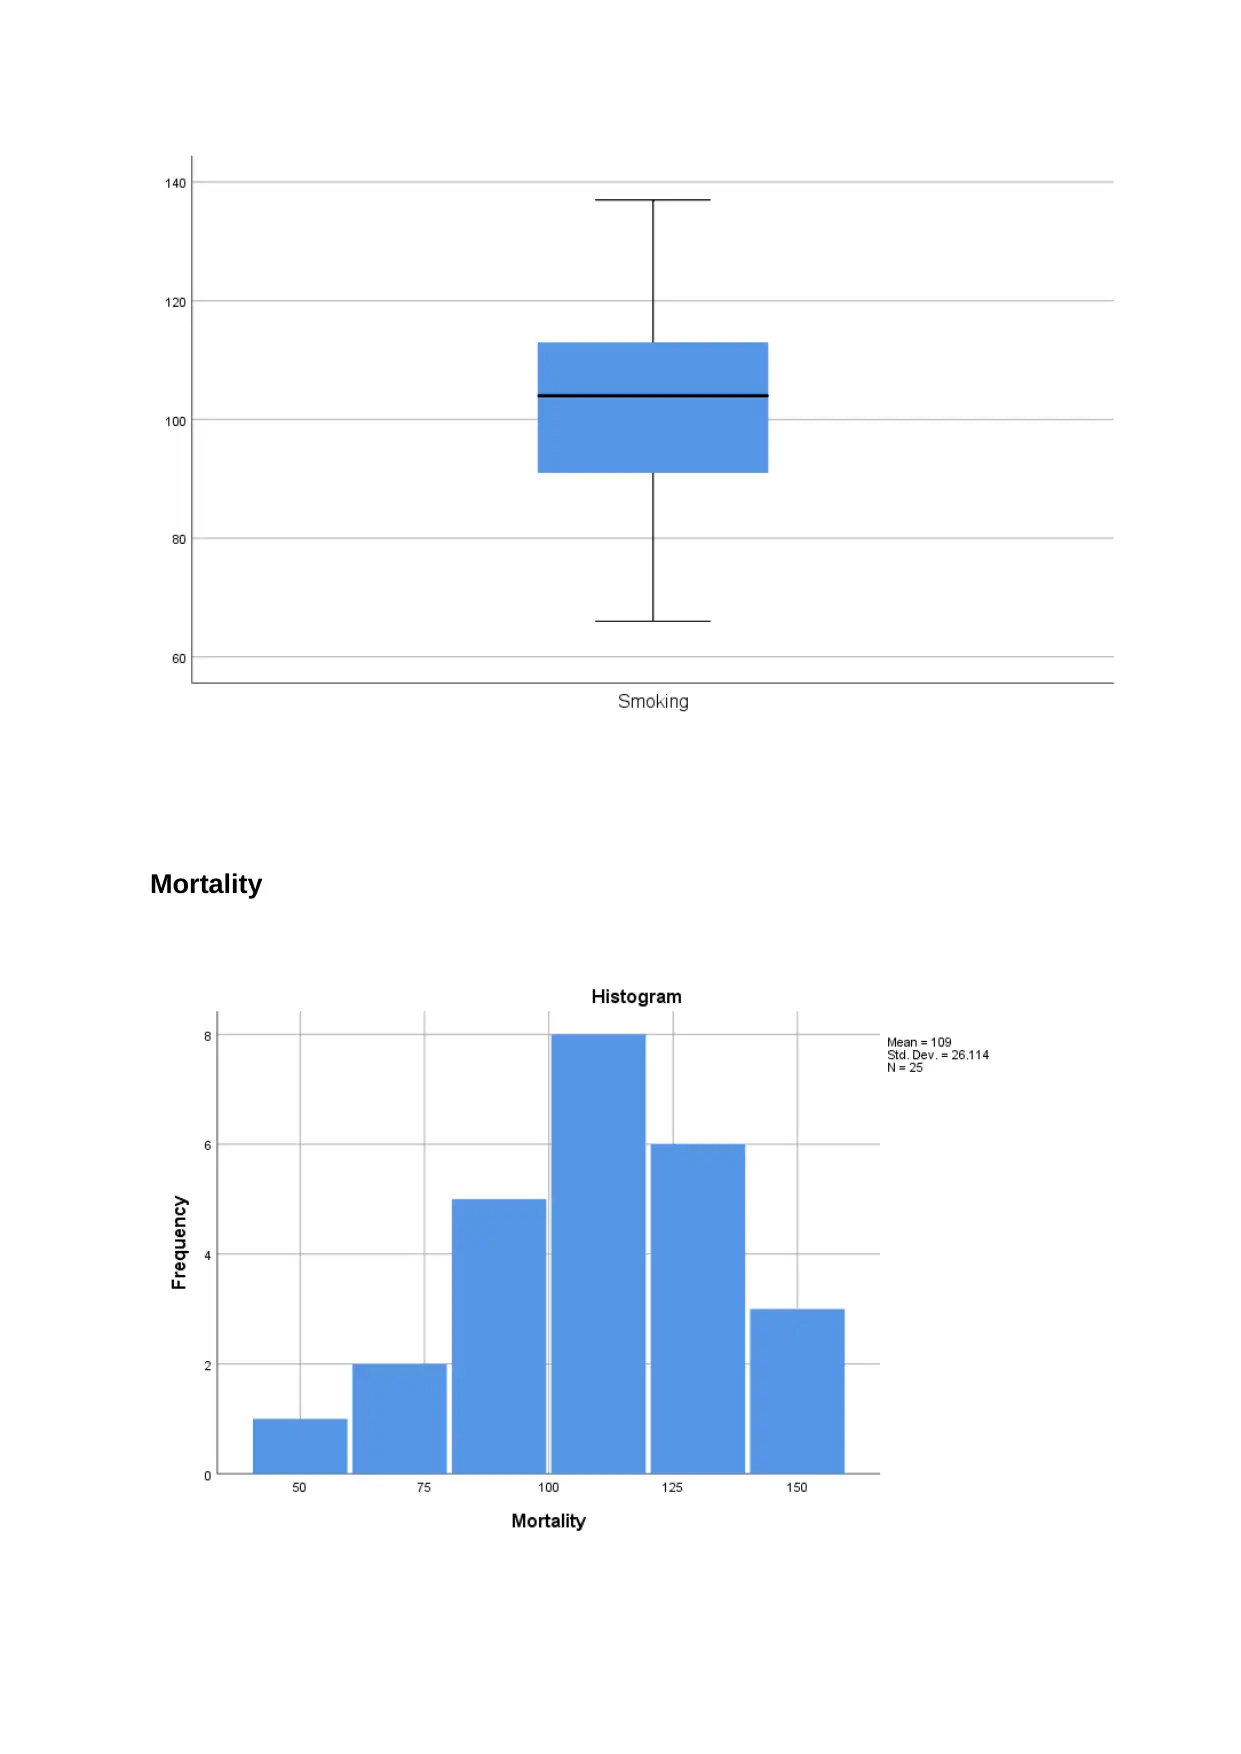
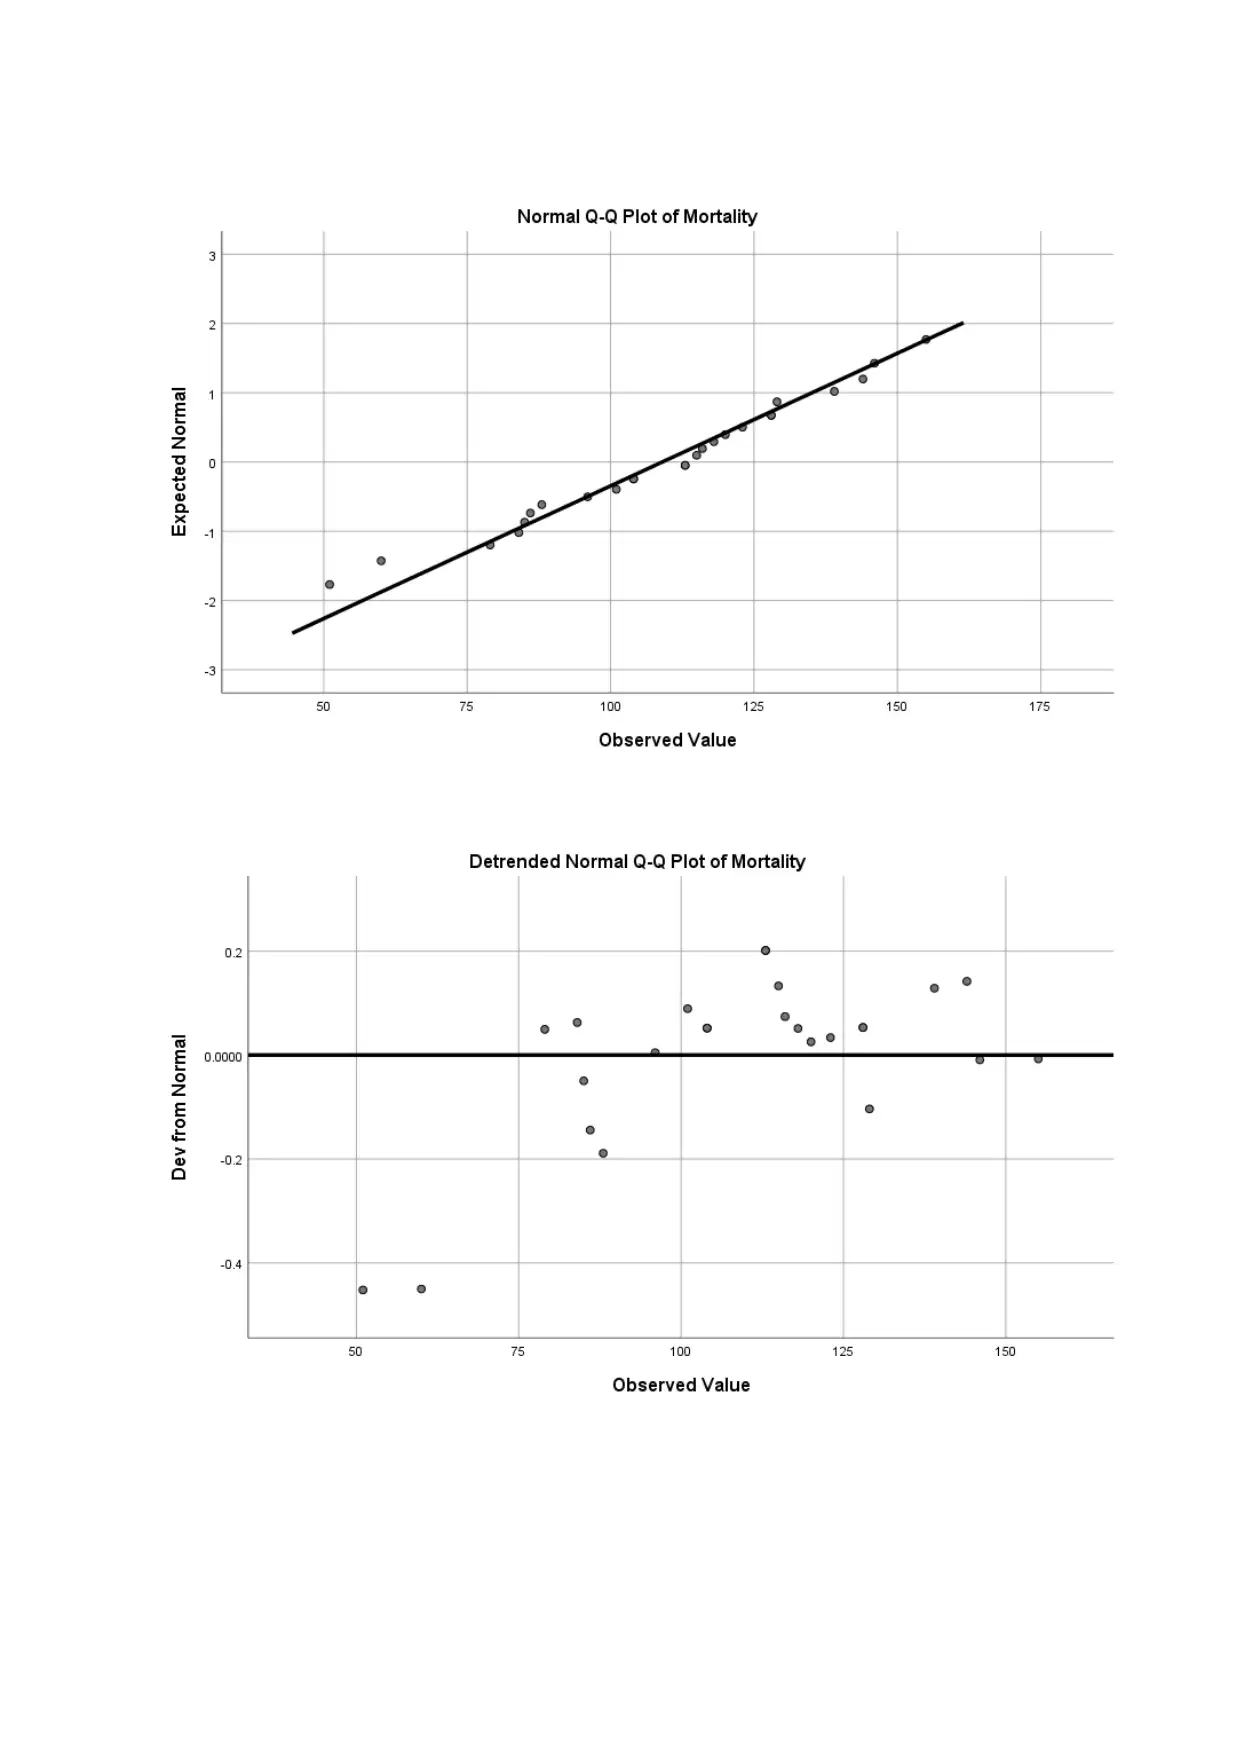
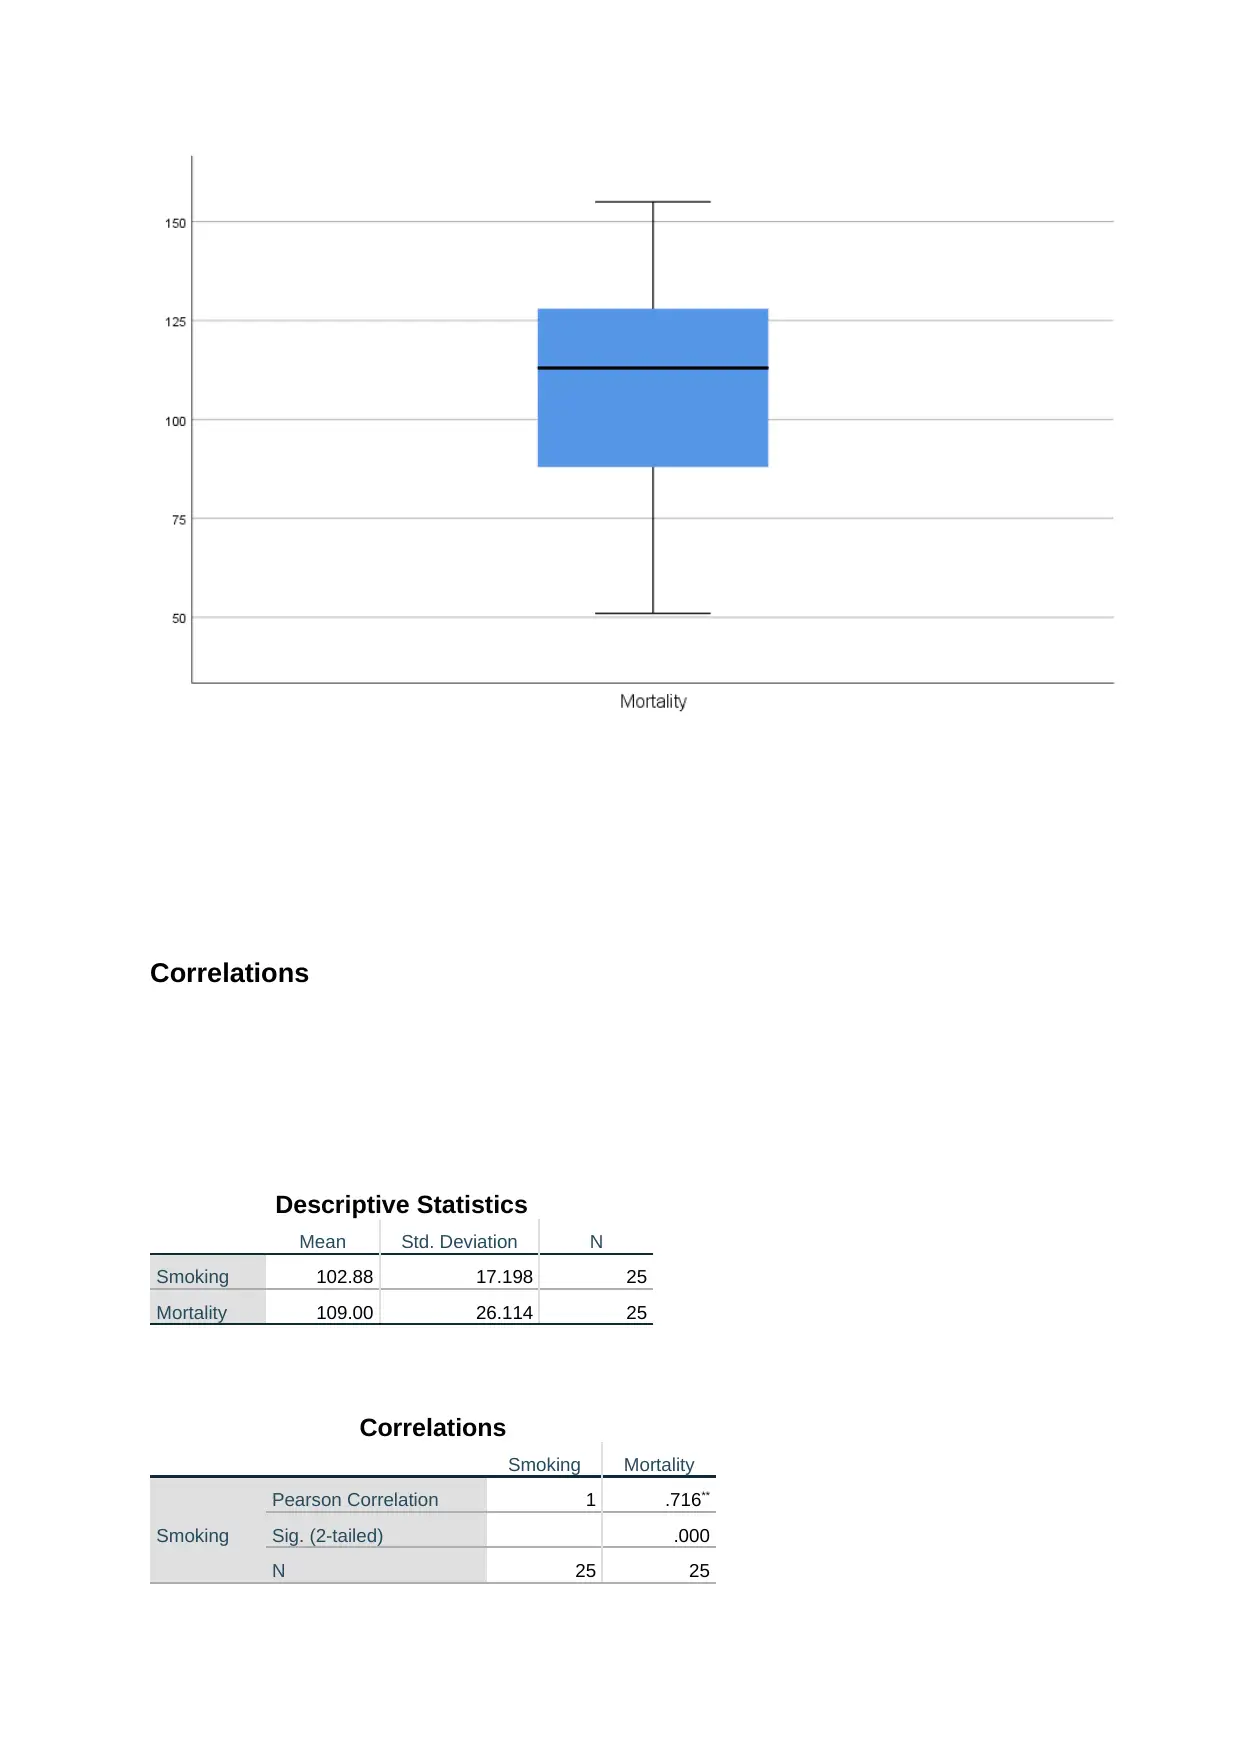
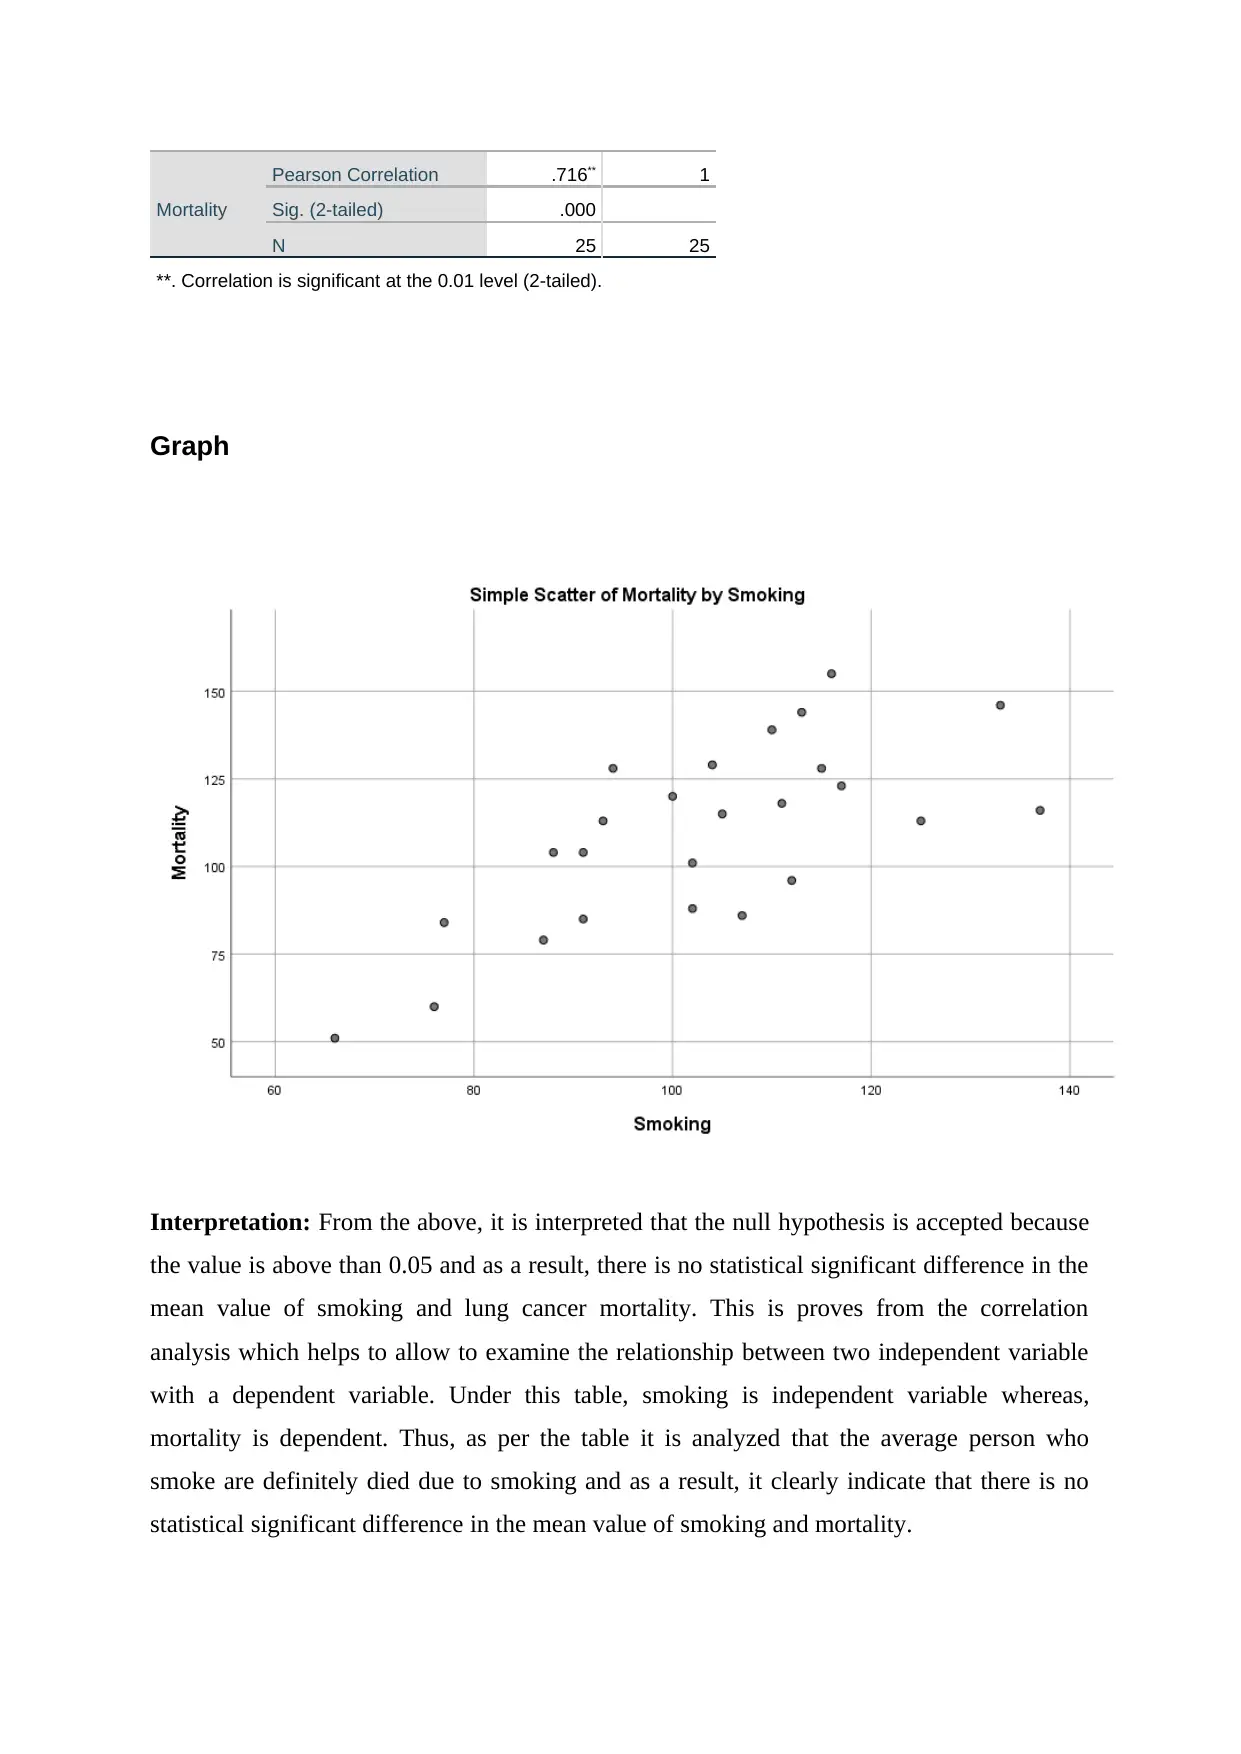
This data analysis report presents findings from several statistical analyses. The report investigates the relationships between age and acceptance of nuclear power, age and perceptions of nuclear power benefits, and age and support for renewable energy. It also examines the association between qualifications and risk perception of nuclear power. Furthermore, the report includes an occupational health study, exploring the link between smoking and lung cancer mortality. Additional analyses assess the relationship between age and weather patterns, qualifications and the inevitability of climate change, gender and climate change action, and the impact of flood damage on climate change perceptions. The report utilizes Chi-Square tests, correlations, and ANOVA to draw conclusions and provide interpretations of the data, with detailed tables and graphs in the appendix.
Document Page
Data Analysis Report
tabler-icon-diamond-filled.svg

Paraphrase This Document

Need a fresh take? Get an instant paraphrase of this document with our AI Paraphraser
Document Page
TABLE OF CONTENTS
QUESTION 1.............................................................................................................................4
a. Association between the age of respondents with acceptance of nuclear power than to
live..........................................................................................................................................4
B. Association between the age of respondents and good things about a nuclear power......4
C. Association between age of respondents and promoting the renewable energy sources. .4
d. Association between qualification and risk of people in Britain about nuclear power......5
QUESTION 2.............................................................................................................................5
QUESTION 3...........................................................................................................................12
a. Association between age of respondents and pattern of weather is changing..................12
b. Association between qualification of respondents and climate change is inevitable.......13
c. Association between gender of respondents and tackle to climate change......................14
d. Relationship between respondents who experience flood damage and whether they felt
climate change......................................................................................................................14
QUESTION 4...........................................................................................................................15
Appendix..................................................................................................................................37
Q1.........................................................................................................................................37
a)...........................................................................................................................................37
b)..........................................................................................................................................37
c)...........................................................................................................................................38
d)..........................................................................................................................................39
Q2.........................................................................................................................................39
Document Page
Q3.........................................................................................................................................41
a)...........................................................................................................................................41
b)..........................................................................................................................................43
c)...........................................................................................................................................45
d)..........................................................................................................................................46
Q4.........................................................................................................................................47
Document Page
QUESTION 1
a. Association between the age of respondents with acceptance of nuclear power than to live
Null Hypothesis : There is no relationship between the age of respondents with acceptance of
nuclear power than to live
Alternative Hypothesis: There is a relationship between the age of respondents with
acceptance of nuclear power than to live
Chi-Square Tests
Value df Asymp. Sig. (2-
sided)
Pearson Chi-Square 65.054a 35 .002
Likelihood Ratio 61.140 35 .004
N of Valid Cases 1418
a. 0 cells (0.0%) have expected count less than 5. The minimum expected
count is 5.15.
Interpretation: As per the above table, it is interpreted that the p value is 0.002 which is
below of 0.05 and that is why, alternative hypothesis is accepted. Therefore, it can be stated
that null hypothesis is rejected and there is a relationship between the age and nuclear power
than to live with the consequence of climate change.
B. Association between the age of respondents and good things about a nuclear power
Null Hypothesis: There is no association between the age of respondents and good things
about a nuclear power
Alternative Hypothesis: There is association between the age of respondents and good things
about a nuclear power
Chi-Square Tests
Value df Asymp. Sig. (2-
sided)
Pearson Chi-Square 74.335a 35 .000
Likelihood Ratio 75.171 35 .000
tabler-icon-diamond-filled.svg

Paraphrase This Document

Need a fresh take? Get an instant paraphrase of this document with our AI Paraphraser
Document Page
N of Valid Cases 1418
a. 3 cells (6.2%) have expected count less than 5. The minimum expected
count is 4.02.
Interpretation: As per the above table, it can be stated that the significant value shows 0.000
which is lower or below from 0.05 and that is why the alternative hypothesis is accepted.
Moreover, it may be stated that there is a relationship between the age of respondents and a
good things about the nuclear power. As a result, null hypothesis is rejected and alternative
accepted.
C. Association between age of respondents and promoting the renewable energy sources
Null hypothesis: There is no association between age of respondents and promoting the
renewable energy sources
Alternative Hypothesis: There is association between age of respondents and promoting the
renewable energy sources
Chi-Square Tests
Value df Asymp. Sig. (2-
sided)
Pearson Chi-Square 51.128a 5 .000
Likelihood Ratio 55.452 5 .000
N of Valid Cases 1418
a. 0 cells (0.0%) have expected count less than 5. The minimum expected
count is 11.66.
Interpretation: From the above data, it is analysed that by applying chi- square test, it is
stated that the significant value shows that there is an association between the age of
respondents and promoting energy sources. Such that the value signifies below from 0.05
(0.000< 0.05) that is why, null hypothesis is rejected and alternative accepted.
d. Association between qualification and risk of people in Britain about nuclear power
Document Page
Null Hypothesis: There is no relationship between qualification and risk of people in Britain
about nuclear power
Alternative Hypothesis: There is a relationship between qualification and risk of people in
Britain about nuclear power
Chi-Square Tests
Value df Asymp. Sig. (2-
sided)
Pearson Chi-Square 65.870a 40 .006
Likelihood Ratio 66.185 40 .006
N of Valid Cases 1418
a. 20 cells (37.0%) have expected count less than 5. The minimum expected
count is .05.
Interpretation: In accordance with the above table, it is stated that significant value under
chi- square test is 0.006 which is lower than 0.05 and that is why, alternative hypothesis is
accepted. Therefore, there is a relationship between the qualification and risk of people in
Britain about nuclear power.
QUESTION 2
The current study is based upon the occupational health study in England where 25 different
occupational groups are taken in order to determine the association between smoking and
lung cancer mortality
Null hypothesis (H0): There is no statistical significant difference in the mean value of
smoking and mortality.
Alternative hypothesis (H1): There is a statistical significant difference in the mean value of
smoking and mortality.
Document Page
Tests of Normality
Kolmogorov-Smirnova Shapiro-Wilk
Statistic df Sig. Statistic df Sig.
Smoking .086 25 .200* .986 25 .973
Mortality .121 25 .200* .977 25 .829
*. This is a lower bound of the true significance.
a. Lilliefors Significance Correction
Smoking
tabler-icon-diamond-filled.svg

Paraphrase This Document

Need a fresh take? Get an instant paraphrase of this document with our AI Paraphraser
Document Page
Document Page
Mortality
Document Page
tabler-icon-diamond-filled.svg

Paraphrase This Document

Need a fresh take? Get an instant paraphrase of this document with our AI Paraphraser
Document Page
Correlations
Descriptive Statistics
Mean Std. Deviation N
Smoking 102.88 17.198 25
Mortality 109.00 26.114 25
Correlations
Smoking Mortality
Smoking
Pearson Correlation 1 .716**
Sig. (2-tailed) .000
N 25 25
Document Page
Mortality
Pearson Correlation .716** 1
Sig. (2-tailed) .000
N 25 25
**. Correlation is significant at the 0.01 level (2-tailed).
Graph
Interpretation: From the above, it is interpreted that the null hypothesis is accepted because
the value is above than 0.05 and as a result, there is no statistical significant difference in the
mean value of smoking and lung cancer mortality. This is proves from the correlation
analysis which helps to allow to examine the relationship between two independent variable
with a dependent variable. Under this table, smoking is independent variable whereas,
mortality is dependent. Thus, as per the table it is analyzed that the average person who
smoke are definitely died due to smoking and as a result, it clearly indicate that there is no
statistical significant difference in the mean value of smoking and mortality.
chevron_up_icon
1 out of 52
circle_padding
hide_on_mobile
zoom_out_icon
[object Object]