ENGT5146 Module: Climate and Thermal Analysis of Birmingham Buildings
VerifiedAdded on 2022/09/17
|12
|3529
|27
Report
AI Summary
This report presents a comprehensive climate and thermal analysis of buildings in Birmingham, UK. It begins by examining Birmingham's climatic data, including temperature, humidity, and wind speed, highlighting their impact on building ventilation and thermal comfort. The analysis then delves into the thermal performance of a student study room, calculating key parameters such as U-values, heat loss coefficients, and heat loss parameters to assess energy efficiency. Furthermore, the report investigates solar irradiation, evaluating solar gain and solar heat loss to understand their influence on building ventilation and indoor temperature. The study emphasizes the importance of considering local climate conditions in building design, particularly for naturally ventilated buildings, and provides insights into optimizing building performance and occupant comfort. The report also includes an analysis of wind speed and direction, temperature variations, and relative humidity, providing a detailed understanding of the climatic factors influencing building design in Birmingham. The findings provide a basis for enhancing building design strategies, optimizing energy efficiency, and ensuring thermal comfort within the built environment.
1
Climate and Thermal Analysis
By(Name)
Course Name
Professor (Tutor)
Name of Institution
City Located
Date
Climate and Thermal Analysis
By(Name)
Course Name
Professor (Tutor)
Name of Institution
City Located
Date
Paraphrase This Document
Need a fresh take? Get an instant paraphrase of this document with our AI Paraphraser
2
Introduction
Local atmospheric conditions of a place have the greatest impact on the thermal behavior of buildings
particularly for naturally ventilated buildings. Because the indoor weather condition is mainly influenced by outdoor
climate and not the occupants and other forms of internal heat gains, an examination of weather characteristics is
essential in the design of buildings. According to Aparicio-Fernández, Vivancos, Cosar-Jorda, & Buswell (2019)
there are properly established façade design guidelines for naturally ventilated buildings for a majority of occupants
in Birmingham. Building comfortability is also dependent on the proper design of a good heat flow system. Heat
flow system in buildings strongly depends on acoustic air, static electricity, the composition of the building
materials, indoor air quality among other factors. Solar irradiation is also another factor that determines the
comfortability and health assurance of buildings. This report starts by analyzing the climatic dataset of Birmingham
before proceeding to carry out a critical thermal analysis of a student study room that is located in a larger building.
The analysis involves computation of various thermal values including the U-Value, heat loss factor and heat loss
parameter, heat loss. The last section of the analysis involves solar irradiation analysis which encompasses
evaluation of the solar gain and solar heat loss and evaluating its impact on the building ventilation.
Task 1: Analysis of climatic data
Thermal analysis of Birmingham climatic data.
Birmingham is the second-most populous city in the UK. It is located in 52.4862oN and 1.8904oC. The
temperature of Birmingham averages 9. 5oC with a humidity of that averages 82.32%. The wind speed in this city
averages. Majority of the residents in this city live in residential apartments and homes where ventilation is a major
concern because of the nature of the climate. Typical weather data can be used as a representation of the local
climate characteristics and thermal analyses. The climatic parameters such as dry bulb temperature, wind speed,
relative humidity are not only useful in the evaluation of natural ventilation feasibility but also the design of façade
design requirement that satisfies the thermal comfort and minimizes the environmental energy loads in the long term
particularly for the naturally ventilated buildings which are very popular in Birmingham.
Wind analyses.
According to CIBSE (2015), a thermal comfort chart suggests that depending on the strength and speed of
the wind, wind can form a means of natural cooling. Virk, Mylona, Mavrogianni, and Davies, (2015) refers to the
wind as a stochastic phenomenon that can be used in changing a short time in both direction and speed. The figure
below shows a histogram that shoes daily wind speed distribution within one year. The data shows that the average
daily wind speed throughout the year in Birmingham is 5.464m/s which is greater than 1m/s. According to Virk,
Mylona, Mavrogianni, & Davies (2015), average wind speed of 1m/s justifies a passive ventilation system. The
analysis of the results also shows that the wind speed between 2 pm and 3 pm when the ambient temperature is low
(-1.2oC) the wind speed in Birmingham is 1.3m/s. Averagely the speed of the wind seems to be high when the
ambient temperature is high. The relationship is however statistically insignificant because the coefficient of a
determinant is only 0.63%. Presence of high speed is essential is compensating for the high temperature.
From the wind data, it is evident that prevailing wind flows from east of north for the entire year in
Birmingham. The results also depict that the wind flow slightly varies per month with a standard deviation of
3.382m/s. The wind direction also depicts that the wind direction ranges from 0 to 353east of North. A direction of
East of North and seems to dominate the wind speed between 2.5 to 3.5m/s, with a relative wind direction of
between 190 o to 200o. A wind direction of lesser degrees north of east seems to dominate January and December
with relatively higher speed. This excellent wind profile in Birmingham indicates that in as a much as wind as an
aspect of weather, it is possible to achieve comfortable natural ventilation in Birmingham. The presence of North of
east prevailing wind with a considerable good speed throughout the year makes a design of natural ventilation
system in Birmingham possible. Large openings should be made in the north of the east direction for proper cross
3
ventilation that is relevant for buildings. Care should be taken to have the opening in a manner that avoids direct
solar gain in the afternoon hours.
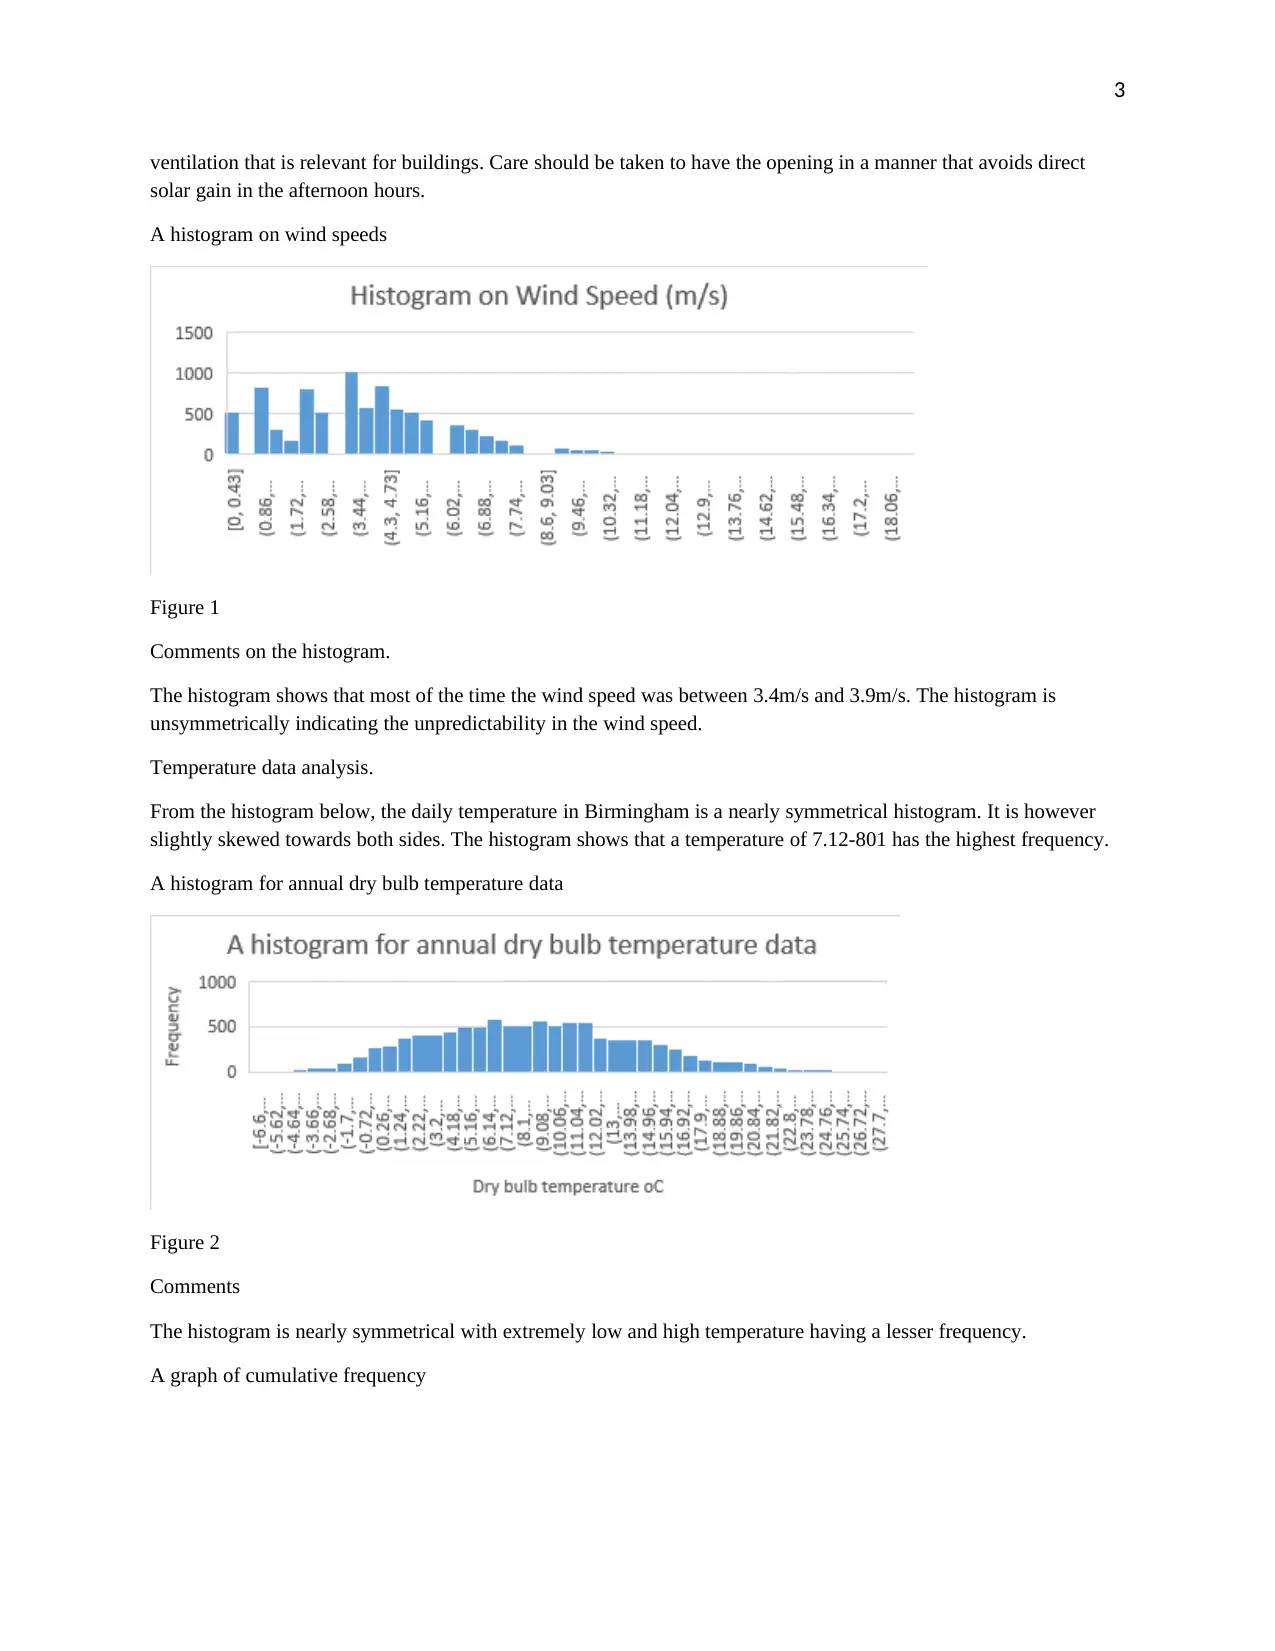
A histogram on wind speeds
Figure 1
Comments on the histogram.
The histogram shows that most of the time the wind speed was between 3.4m/s and 3.9m/s. The histogram is
unsymmetrically indicating the unpredictability in the wind speed.
Temperature data analysis.
From the histogram below, the daily temperature in Birmingham is a nearly symmetrical histogram. It is however
slightly skewed towards both sides. The histogram shows that a temperature of 7.12-801 has the highest frequency.
A histogram for annual dry bulb temperature data
Figure 2
Comments
The histogram is nearly symmetrical with extremely low and high temperature having a lesser frequency.
A graph of cumulative frequency
ventilation that is relevant for buildings. Care should be taken to have the opening in a manner that avoids direct
solar gain in the afternoon hours.
A histogram on wind speeds
Figure 1
Comments on the histogram.
The histogram shows that most of the time the wind speed was between 3.4m/s and 3.9m/s. The histogram is
unsymmetrically indicating the unpredictability in the wind speed.
Temperature data analysis.
From the histogram below, the daily temperature in Birmingham is a nearly symmetrical histogram. It is however
slightly skewed towards both sides. The histogram shows that a temperature of 7.12-801 has the highest frequency.
A histogram for annual dry bulb temperature data
Figure 2
Comments
The histogram is nearly symmetrical with extremely low and high temperature having a lesser frequency.
A graph of cumulative frequency
⊘ This is a preview!⊘
Do you want full access?
Subscribe today to unlock all pages.
Trusted by 1+ million students worldwide
4
8.119354839
6.232258065
4.722580645
10.38387097
2.458064516
16.42258065
19.06451613
19.44193548
22.46129032
-2.070967742
-4.712903226
27.74516129
0
200
0.00%
100.00%
Histogram
Frequency
Cumulative %
Bin
Frequency
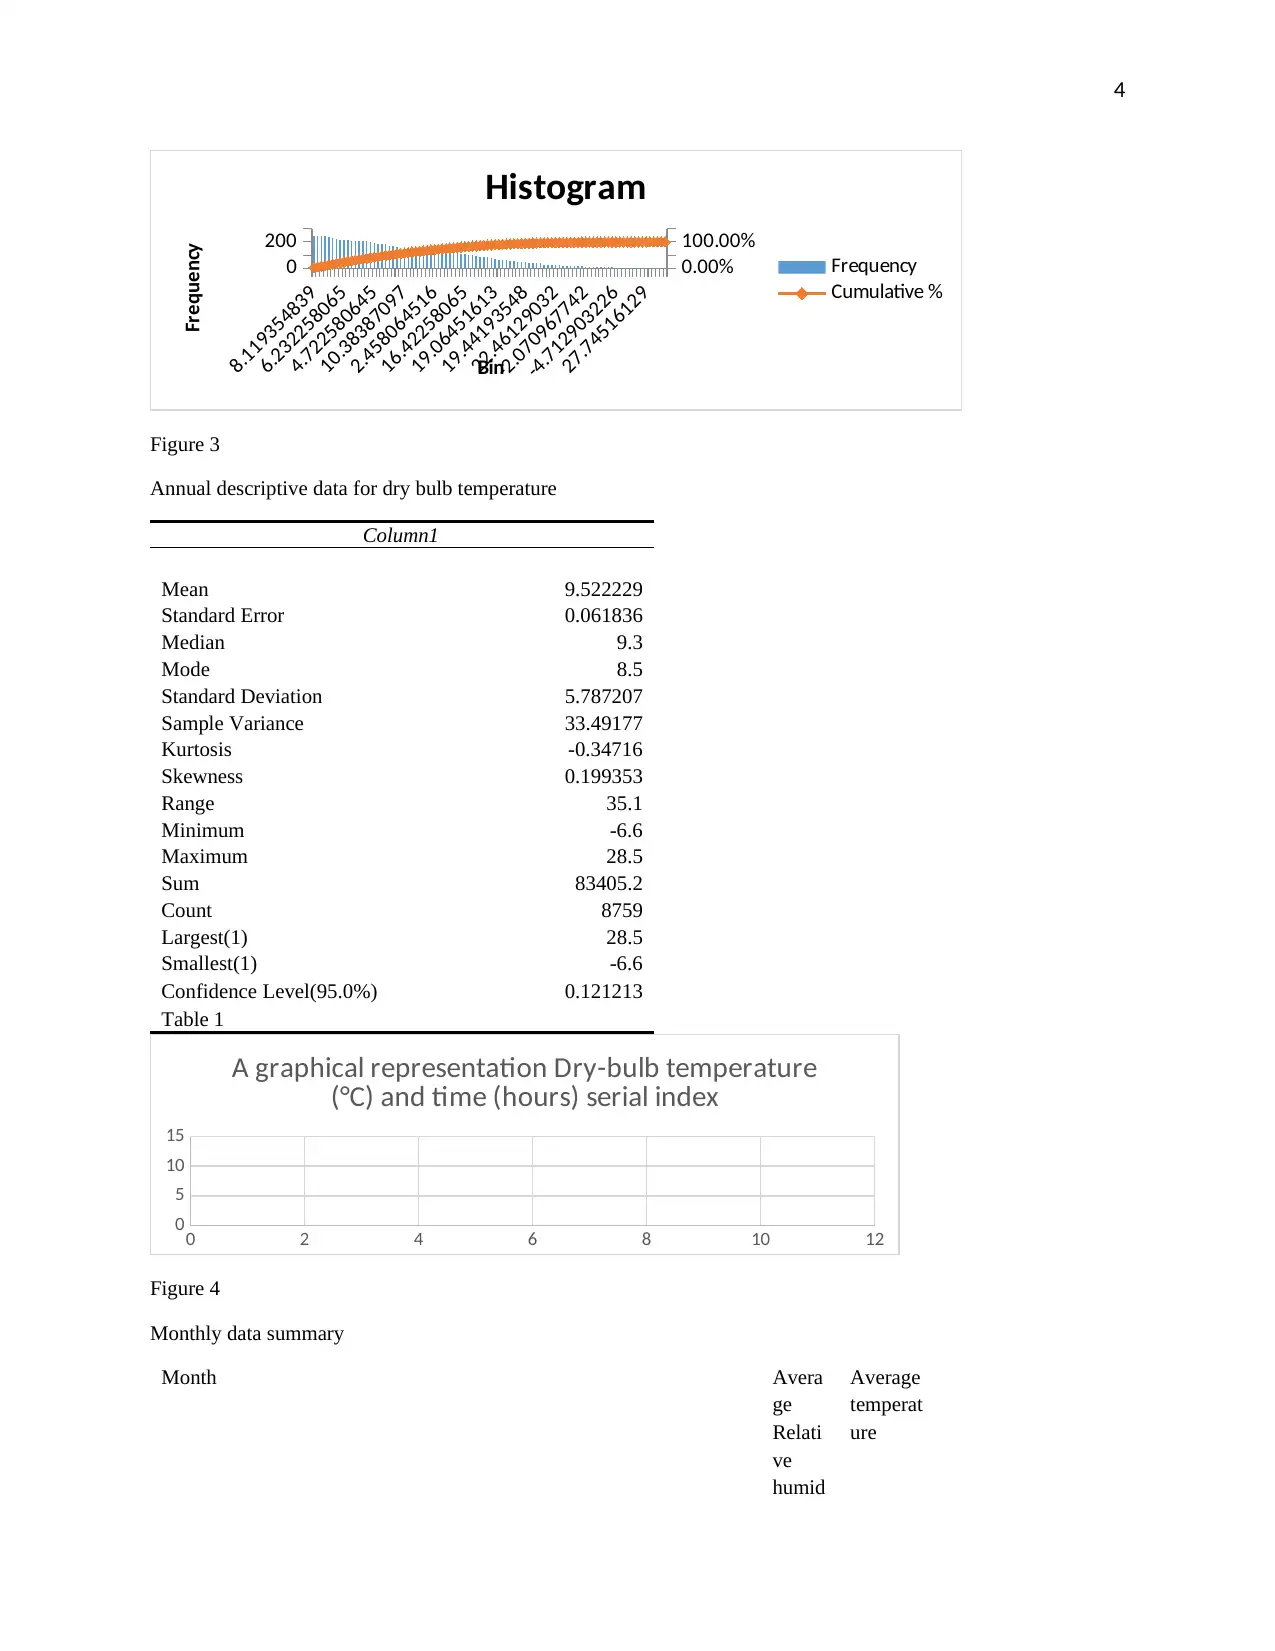
Figure 3
Annual descriptive data for dry bulb temperature
Column1
Mean 9.522229
Standard Error 0.061836
Median 9.3
Mode 8.5
Standard Deviation 5.787207
Sample Variance 33.49177
Kurtosis -0.34716
Skewness 0.199353
Range 35.1
Minimum -6.6
Maximum 28.5
Sum 83405.2
Count 8759
Largest(1) 28.5
Smallest(1) -6.6
Confidence Level(95.0%) 0.121213
Table 1
0 2 4 6 8 10 12
0
5
10
15
A graphical representation Dry-bulb temperature
(°C) and time (hours) serial index
Figure 4
Monthly data summary
Month Avera
ge
Relati
ve
humid
Average
temperat
ure
8.119354839
6.232258065
4.722580645
10.38387097
2.458064516
16.42258065
19.06451613
19.44193548
22.46129032
-2.070967742
-4.712903226
27.74516129
0
200
0.00%
100.00%
Histogram
Frequency
Cumulative %
Bin
Frequency
Figure 3
Annual descriptive data for dry bulb temperature
Column1
Mean 9.522229
Standard Error 0.061836
Median 9.3
Mode 8.5
Standard Deviation 5.787207
Sample Variance 33.49177
Kurtosis -0.34716
Skewness 0.199353
Range 35.1
Minimum -6.6
Maximum 28.5
Sum 83405.2
Count 8759
Largest(1) 28.5
Smallest(1) -6.6
Confidence Level(95.0%) 0.121213
Table 1
0 2 4 6 8 10 12
0
5
10
15
A graphical representation Dry-bulb temperature
(°C) and time (hours) serial index
Figure 4
Monthly data summary
Month Avera
ge
Relati
ve
humid
Average
temperat
ure
Paraphrase This Document
Need a fresh take? Get an instant paraphrase of this document with our AI Paraphraser
5
ity
January 90.2 4.41
February 84.53 4.36
March 80.46 5.51
April 76.79 6.8
May 78.51 11.2
June 75.68 14.86
July 80.63 15.23
August 78.97 16.7
September 80.84 13.96
October 84.16 9.85
November 86.03 6.16
December 91.05 5.46
Table 2
0 2 4 6 8 10 12 14
0
2
4
6
8
10
12
14
16
18
A graph of Month time series against average
temperature
month time series
Temperature
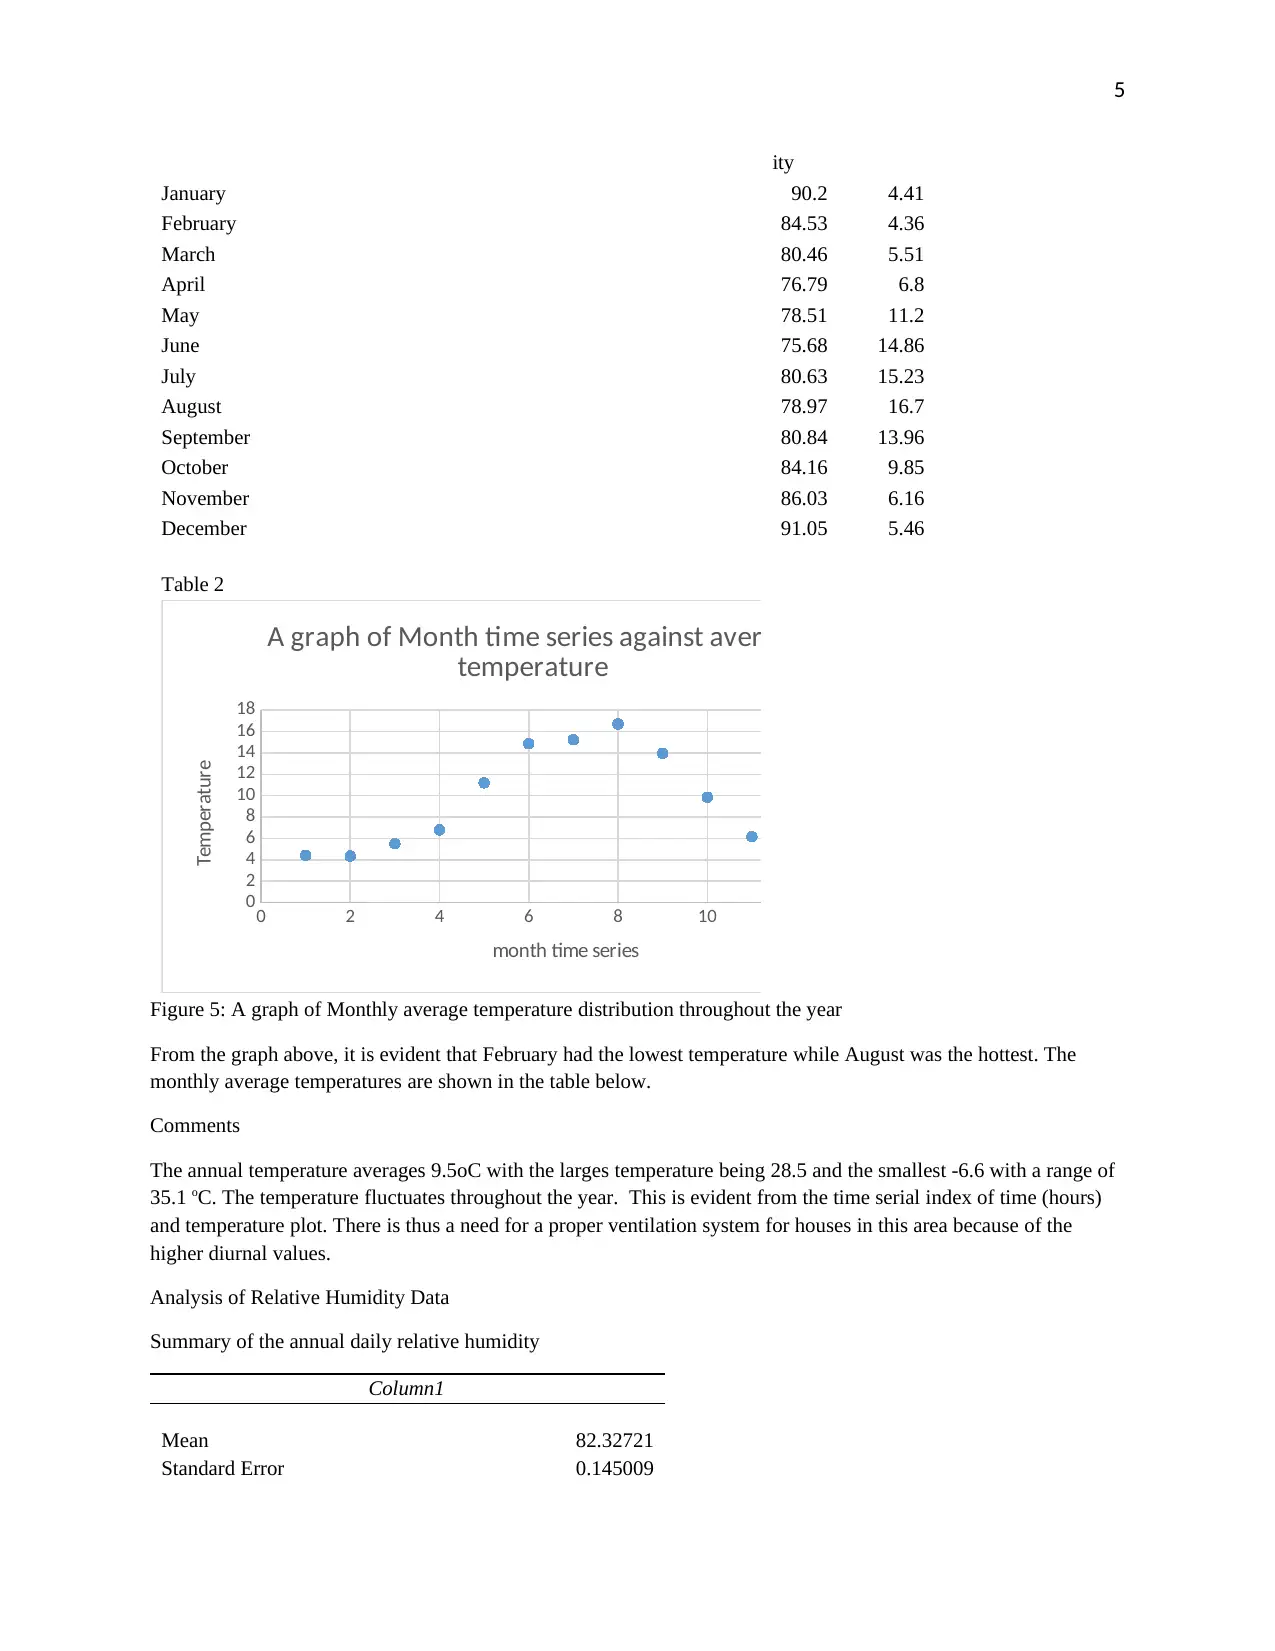
Figure 5: A graph of Monthly average temperature distribution throughout the year
From the graph above, it is evident that February had the lowest temperature while August was the hottest. The
monthly average temperatures are shown in the table below.
Comments
The annual temperature averages 9.5oC with the larges temperature being 28.5 and the smallest -6.6 with a range of
35.1 oC. The temperature fluctuates throughout the year. This is evident from the time serial index of time (hours)
and temperature plot. There is thus a need for a proper ventilation system for houses in this area because of the
higher diurnal values.
Analysis of Relative Humidity Data
Summary of the annual daily relative humidity
Column1
Mean 82.32721
Standard Error 0.145009
ity
January 90.2 4.41
February 84.53 4.36
March 80.46 5.51
April 76.79 6.8
May 78.51 11.2
June 75.68 14.86
July 80.63 15.23
August 78.97 16.7
September 80.84 13.96
October 84.16 9.85
November 86.03 6.16
December 91.05 5.46
Table 2
0 2 4 6 8 10 12 14
0
2
4
6
8
10
12
14
16
18
A graph of Month time series against average
temperature
month time series
Temperature
Figure 5: A graph of Monthly average temperature distribution throughout the year
From the graph above, it is evident that February had the lowest temperature while August was the hottest. The
monthly average temperatures are shown in the table below.
Comments
The annual temperature averages 9.5oC with the larges temperature being 28.5 and the smallest -6.6 with a range of
35.1 oC. The temperature fluctuates throughout the year. This is evident from the time serial index of time (hours)
and temperature plot. There is thus a need for a proper ventilation system for houses in this area because of the
higher diurnal values.
Analysis of Relative Humidity Data
Summary of the annual daily relative humidity
Column1
Mean 82.32721
Standard Error 0.145009
6
Median 85.5
Mode 100
Standard Deviation 13.57054
Sample Variance 184.1595
Kurtosis 0.100005
Skewness -0.88405
Range 68.9
Minimum 31.1
Maximum 100
Sum 721021.7
Count 8758
Largest(1) 100
Smallest(1) 31.1
Confidence Level(95.0%) 0.284251
Table 3: Summary of Relative Humidity Data
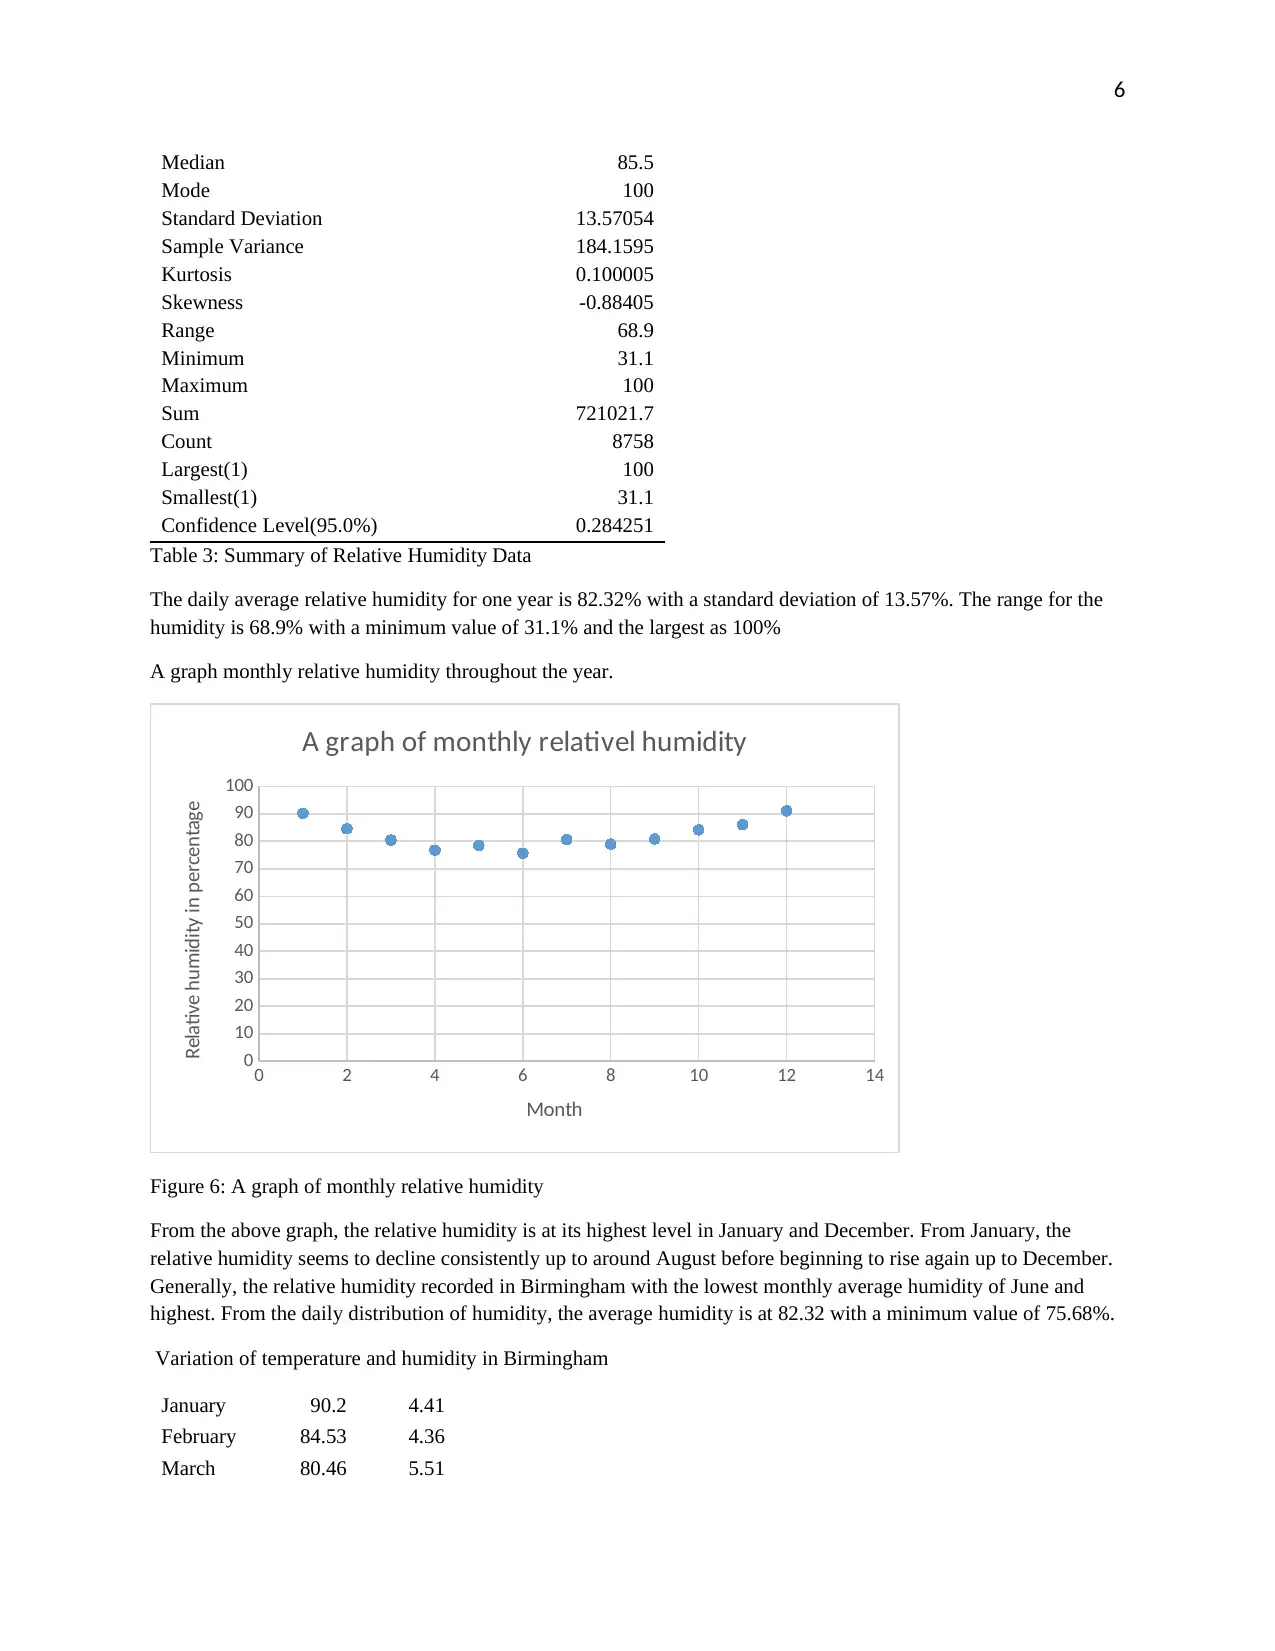
The daily average relative humidity for one year is 82.32% with a standard deviation of 13.57%. The range for the
humidity is 68.9% with a minimum value of 31.1% and the largest as 100%
A graph monthly relative humidity throughout the year.
0 2 4 6 8 10 12 14
0
10
20
30
40
50
60
70
80
90
100
A graph of monthly relativel humidity
Month
Relative humidity in percentage
Figure 6: A graph of monthly relative humidity
From the above graph, the relative humidity is at its highest level in January and December. From January, the
relative humidity seems to decline consistently up to around August before beginning to rise again up to December.
Generally, the relative humidity recorded in Birmingham with the lowest monthly average humidity of June and
highest. From the daily distribution of humidity, the average humidity is at 82.32 with a minimum value of 75.68%.
Variation of temperature and humidity in Birmingham
January 90.2 4.41
February 84.53 4.36
March 80.46 5.51
Median 85.5
Mode 100
Standard Deviation 13.57054
Sample Variance 184.1595
Kurtosis 0.100005
Skewness -0.88405
Range 68.9
Minimum 31.1
Maximum 100
Sum 721021.7
Count 8758
Largest(1) 100
Smallest(1) 31.1
Confidence Level(95.0%) 0.284251
Table 3: Summary of Relative Humidity Data
The daily average relative humidity for one year is 82.32% with a standard deviation of 13.57%. The range for the
humidity is 68.9% with a minimum value of 31.1% and the largest as 100%
A graph monthly relative humidity throughout the year.
0 2 4 6 8 10 12 14
0
10
20
30
40
50
60
70
80
90
100
A graph of monthly relativel humidity
Month
Relative humidity in percentage
Figure 6: A graph of monthly relative humidity
From the above graph, the relative humidity is at its highest level in January and December. From January, the
relative humidity seems to decline consistently up to around August before beginning to rise again up to December.
Generally, the relative humidity recorded in Birmingham with the lowest monthly average humidity of June and
highest. From the daily distribution of humidity, the average humidity is at 82.32 with a minimum value of 75.68%.
Variation of temperature and humidity in Birmingham
January 90.2 4.41
February 84.53 4.36
March 80.46 5.51
⊘ This is a preview!⊘
Do you want full access?
Subscribe today to unlock all pages.
Trusted by 1+ million students worldwide
7
April 76.79 6.8
May 78.51 11.2
June 75.68 14.86
July 80.63 15.23
August 78.97 16.7
Septembe
r 80.84 13.96
October 84.16 9.85
Novembe
r 86.03 6.16
December 91.05 5.46
Table 4: Summary of Monthly Average humidity and Temperature
From the table above, it is evident that humidity is low when the temperature is high and high when the average
temperature is high.
Heat Loss Analysis
a. U-value also often referred to as the overall heat transfer coefficient is a measure of heat loss in buildings
elements such as roof, wall, window, door, and floor (Anand, Gupta, and Tyagi, 2015). From its definition,
the higher the U-Value the poor the thermal performance of a building. A lower value of U-value implies
that the insulation of the building or that of the element is better. U-value is an important property that is
used in predicting the behavior of the entire building instead of depending on the thermal properties of the
individual elements that make up the entire building. U-values forms the basis of energy reduction
standards.
U −Value= 1
summation of all t h e R values
For a building element, u-value U −Value= 1
( R¿¿ so+ Rsi+ R1 + R2 + R3 … ..)¿
Where k is the thermal conductivity of the material and d is the thickness
Where Rso refers to the fixed external resistance, Rsi refers to the fixed internal resistance R1, R2, R3.. refers to the
resistivity of all the elements considered within the application that includes all the cavities within the construction
Thermal resistance
R=d
k
Rconcrete = 0.2
1.31 =0.1527
Rmineral wool= 0.2
0.036 =5.5555
Paraphrase This Document
Need a fresh take? Get an instant paraphrase of this document with our AI Paraphraser
8
Rplasterboard= 0.13
0.16 =0.8125
( R¿¿ so+ Rsi+ R1+ R2+R3 … ..)=5.5555+0.1527+ 0.8125=6.5207 m2 K /W ¿
U −Value= 1
6.5207 =0.1534 W /m2 K
b.
Total area of the windows=0.5*1.2*10=6m2
Area of the internal wall=6*3=18m2
Area of the floor=10*6=60m2
Area of the flow=10*6=60m2
Area of the external wall=(10*3)*2+6*3-(12)=66m2
Floor
Rfloor= 0.2
1.7
U −Value=1.7
0.2 =8.5 W /m2 K
Internal wall.
Rplasterboard= 0.2
0.16 =1.25
Racoustic insulation= 0.2
0.04 =5
Rplasterboard= 0.13
0.16 =0.8125
(R¿¿ so+ Rsi+ R1+R2+ R3 … ..)=1.25+5+0.8125=7.0625 m2 K /W ¿
U −Value= 1
7.0625 =0.1416 W / m2 K
U-value for the glazing =2.3W /m2 K (windows)
The U-value of the roof=0.23
Rplasterboard= 0.13
0.16 =0.8125
( R¿¿ so+ Rsi+ R1+ R2+R3 … ..)=5.5555+0.1527+ 0.8125=6.5207 m2 K /W ¿
U −Value= 1
6.5207 =0.1534 W /m2 K
b.
Total area of the windows=0.5*1.2*10=6m2
Area of the internal wall=6*3=18m2
Area of the floor=10*6=60m2
Area of the flow=10*6=60m2
Area of the external wall=(10*3)*2+6*3-(12)=66m2
Floor
Rfloor= 0.2
1.7
U −Value=1.7
0.2 =8.5 W /m2 K
Internal wall.
Rplasterboard= 0.2
0.16 =1.25
Racoustic insulation= 0.2
0.04 =5
Rplasterboard= 0.13
0.16 =0.8125
(R¿¿ so+ Rsi+ R1+R2+ R3 … ..)=1.25+5+0.8125=7.0625 m2 K /W ¿
U −Value= 1
7.0625 =0.1416 W / m2 K
U-value for the glazing =2.3W /m2 K (windows)
The U-value of the roof=0.23
9
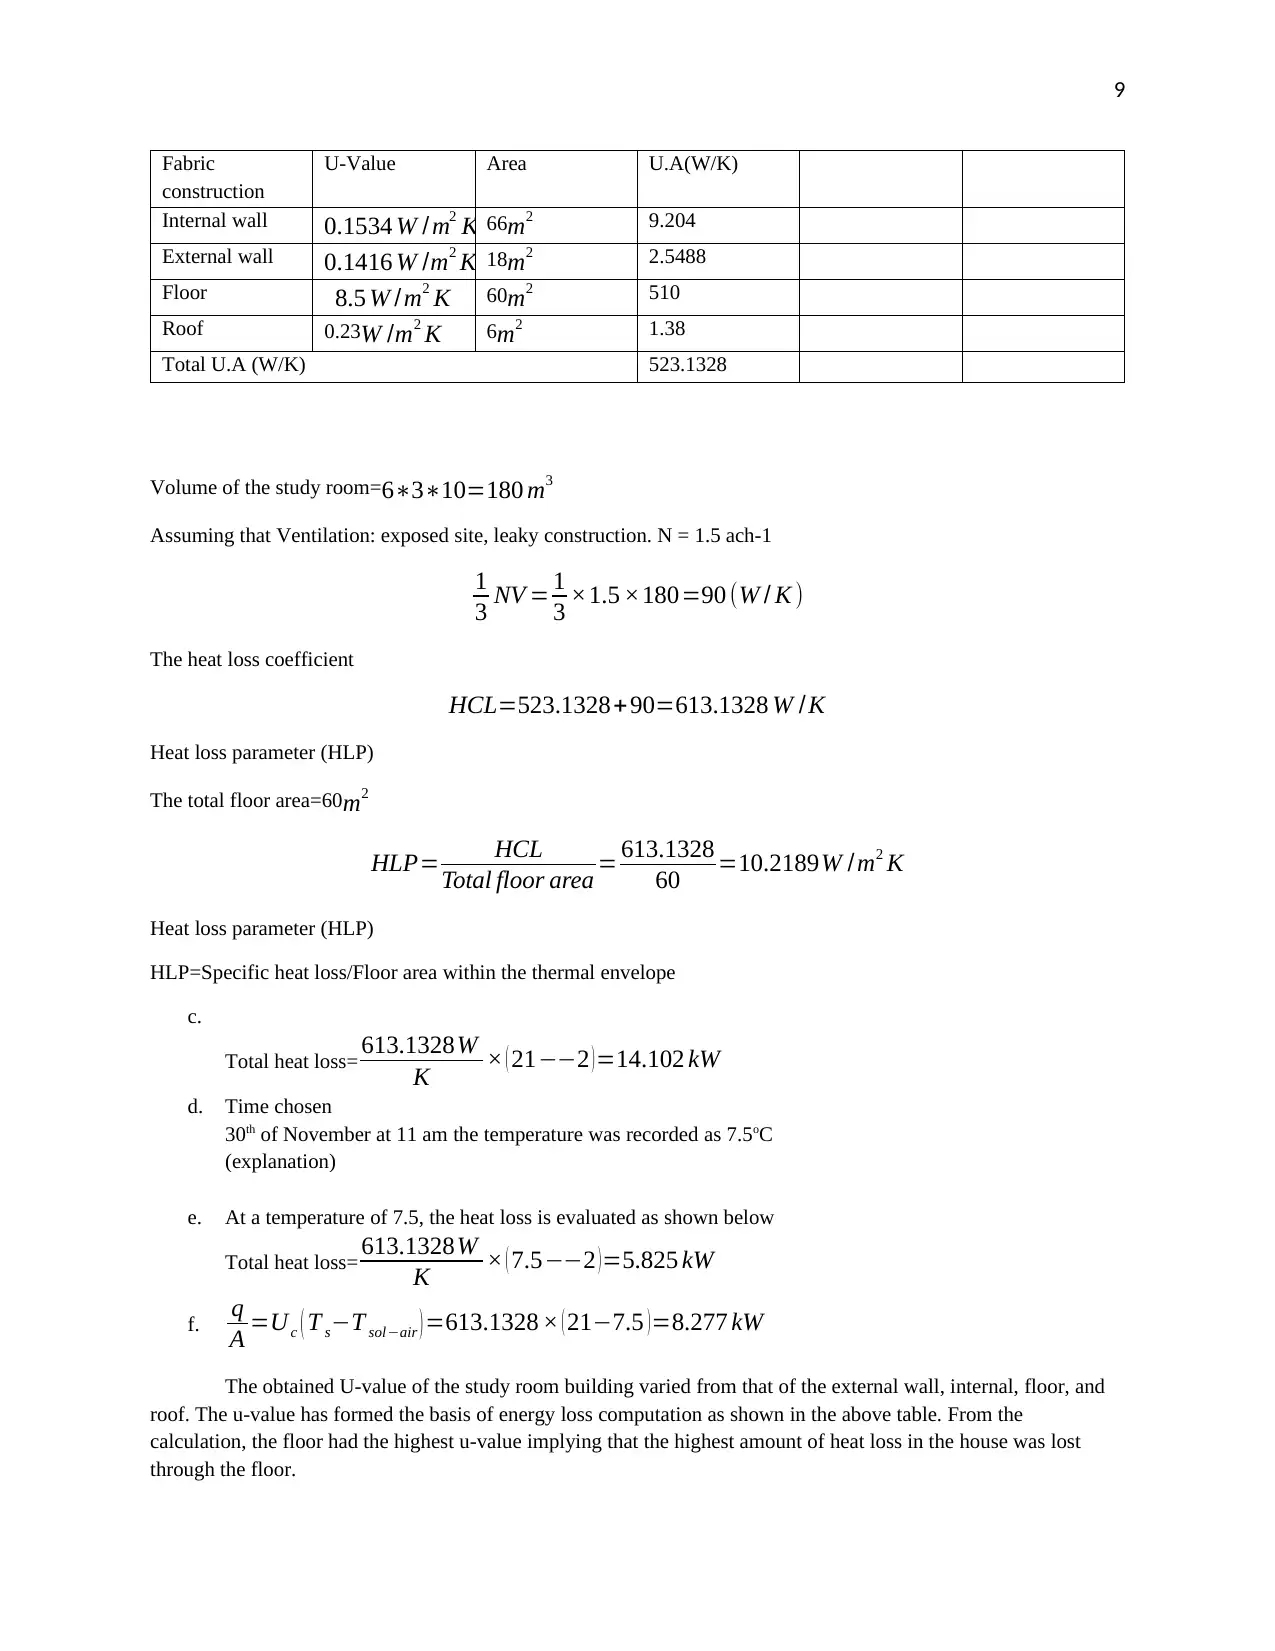
Fabric
construction
U-Value Area U.A(W/K)
Internal wall 0.1534 W / m2 K 66m2 9.204
External wall 0.1416 W /m2 K 18m2 2.5488
Floor 8.5 W /m2 K 60m2 510
Roof 0.23W /m2 K 6m2 1.38
Total U.A (W/K) 523.1328
Volume of the study room= 6∗3∗10=180 m3
Assuming that Ventilation: exposed site, leaky construction. N = 1.5 ach-1
1
3 NV = 1
3 ×1.5 ×180=90 (W / K )
The heat loss coefficient
HCL=523.1328+90=613.1328 W /K
Heat loss parameter (HLP)
The total floor area=60 m2
HLP= HCL
Total floor area = 613.1328
60 =10.2189W /m2 K
Heat loss parameter (HLP)
HLP=Specific heat loss/Floor area within the thermal envelope
c.
Total heat loss= 613.1328W
K × ( 21−−2 )=14.102 kW
d. Time chosen
30th of November at 11 am the temperature was recorded as 7.5oC
(explanation)
e. At a temperature of 7.5, the heat loss is evaluated as shown below
Total heat loss= 613.1328W
K × ( 7.5−−2 )=5.825 kW
f. q
A =Uc ( T s−T sol−air ) =613.1328 × ( 21−7.5 )=8.277 kW
The obtained U-value of the study room building varied from that of the external wall, internal, floor, and
roof. The u-value has formed the basis of energy loss computation as shown in the above table. From the
calculation, the floor had the highest u-value implying that the highest amount of heat loss in the house was lost
through the floor.
⊘ This is a preview!⊘
Do you want full access?
Subscribe today to unlock all pages.
Trusted by 1+ million students worldwide
10
Heat loss coefficient refers to a measure of an entire building's insulation and airtightness property (Dinu,
Ivan, and Popescu, 2016). This property is important in the normalization process where it is divided by the entire
buildings floor area. This division yields heat loss parameter. The obtained parameter reveals a lot about both the
insulation and airtightness whenever there is a need to make a comparison between two different buildings. From
the calculation made the heat loss coefficient formed the basis of computing the heat loss.
Task 3: Solar Analysis
Solar gain refers to short wave radiation from the sun that heats building either directly via building openings
such as windows or indirectly via the building fabrics. The solar gain via glazing is made up of solar radiation that
absorbed at the glazing and then transmitted the environmental node. It is also made of the solar radiation which is
absorbed by the buildings' internal surface thus appearing as an environmental node. The solar gain forms the basis
of computations involving solar heat load through glazing.
a. The position of the sun on September 15th for Solihull near Birmingham
Azimuth 207.92o Altitude 37.38o retrieved from https://www.suncalc.org/#/52.4104,-
1.7976,11/2019.09.15/14:30/1/3
b. The mean solar gain with respect to the internal environment is evaluated using the formula
Φse
Φse=Se I T Ag
Where Φe refers to the average heat gain of the environmental node, Se is the solar gain factor at the given
environmental node and is the average total irradiance and Ag is the glazing area ()
The area of the window=0.5*12=0.6m2
solar gain/m2=Se IT =0.8 × 0.62×179=88.784 W m−2
c.
The total surface of the area of the window that is irradiated by the solar energy
0.6 m2 × 10=6 m2
Total solar heat load through the glaze on the building
6 m2 × 88.784 W m−2=532.704 W
At this time, the solar heat load through glazing has an effect of increases heat energy in the house thus
increasing the temperature of the room.
d. Ways of reducing solar heat gain
i. Horizontal shading
Advantages
The lighting condition of the house is not affected by horizontal shading.
Reduces energy consumption by cooling devices such as fans
Disadvantages
In cold pleases, the shading blocks heat energy into building
ii. Purging the heat gains by ventilating the room.
Advantages
There is no additional cost in the building materials
Improves the general aeration of the buildings
Disadvantages
Paraphrase This Document
Need a fresh take? Get an instant paraphrase of this document with our AI Paraphraser
11
The ventilation openings form an entry point of the entry of intruders and other foreign material
into the building.
iii. Using reflective glazing that minimizes transmittance
Advantages
Minimizes the solar heat up thus limiting undesired heat buildup in buildings. This has an overall
impact of reducing energy requirement in glazing.
Disadvantages
Blocks a substantial amount of natural light into the building thus necessitating the need for
artificial light. This increases the demand for artificial lighting in the buildings
During winter, the reflective glazing blocks a substantial about of solar gain.
iv. Minimizing building envelope to prevent indirect solar gains. This can be achieved using white-
colored surfaces
Advantage
No additional cost is required once the material is put in place
Disadvantages
The relative reduction in solar gain is comparatively low.
e. Thermal mass refers to the material's ability to absorb and store heat energy. More energy is required to
change the temperature of materials that have higher density materials such as concrete. Because of this
property, they are referred to as thermal mass. The lighter materials such as timber have relatively lower
thermal mass. A good choice of thermal mass is capable of making a substantial amount of change in
comfortability and ventilation related bills. Thermal mass materials are capable of storing heat energy
during the day and then re-radiating the same energy at night. This forms the basis of moderating internal
temperature by averaging the out diurnal which an effect of improving comfort while reducing the cost of
energy.
During winter, the thermal mass absorbs heat during the day. The heat is absorbed from direct sunlight or
radiant heaters. The amount of heat absorbed is radiated as warmth at night thus creating comfort. During
the summer season, the thermal mass allows cool breeze or the convention current passes over the thermal
mass at night. This draws the energy that is stored in the material. This has an impact of improving
comfortability in the house
The major source of thermal mass is the floor that I made of concrete. Due to direct contact between the
concrete slab and the ground. Because of its better insulating property, a slab on ground temperature
originates from the ground beneath the surface due to its insulating property thus minimizing heat loss.
Conclusion and Recommendation
From the analysis of data at Birmingham, it is evident that the wind speed is strong enough to design a
passive ventilation system. The temperature variations are relatively high in this area with the monthly average
temperature increasing from January to August before falling again. The daily diurnal temperatures are high. This
necessitates the need for a proper ventilation system. The relative humidity within Birmingham is also relatively
high. A passive ventilation system for this area must thus be given a proper consideration because of the various
variables in the aspects of weather that determines the thermal properties of buildings in this area.
In this ventilation design requirement, the analysis assumes that the outdoor condition is a direct replica of
the indoor average radiant temperature that is also assumed to be equivalent to the air temperature. This based on an
analytical assumption that there are no indoor heat losses at the time of ventilation system design. The air
temperature is represented by the dry air bulb temperature. Just as proposed by Adam, Fraga, and Brett (2015), the
relative humidity is then registered on the thermal comfort chart in investigating the possibility of using having a
passive ventilation system in Birmingham.
12
Floor evidently from the u-value computation a lot of heat is lost through the floor. It is thus recommended
to use a material with a lower k value to minimize floor heat loss timber flooring will provide better
insulation compared to the concrete floor used.
Both the heat loss factor and heat loss parameter obtained for the buildings are relatively high. The
implication of this is the high amount of heat energy loss. It is recommended that the building should be
improved by insulating materials with a lesser value of k. This will reduce both the heat loss parameter and
heat loss coefficient thus reducing heat loss.
The solar gain coefficient and the related solar load reveals that on the particular day and time of analysis
the solar load through glazing revealed that this load increased the temperature of the building. Care should
be taken to ensure that on cold days the solar gain is sufficient to warm the room enough to make the place
comfortable and on warm days, this load should make the room more comfortable. The thermal mass (floor
concrete) should be protected from the excess solar energy during summer using insulation material or
shading to avoid abortion of more heat energy that can cause comfortability in the building.
Reference
Adam, A., Fraga, E.S. and Brett, D.J., 2015. Options for residential building services design using fuel cell-based
micro-CHP and the potential for heat integration. Applied Energy, 138, pp.685-694.
Anand, Y., Anand, S., Gupta, A. and Tyagi, S., 2015. Building envelope performance with different insulating
materials–An exergy approach. Journal of Thermal Engineering, 1(4), pp.433-439.
Aparicio-Fernández, C., Vivancos, J.L., Cosar-Jorda, P. and Buswell, R.A., 2019. Energy Modelling and Calibration
of Building Simulations: A Case Study of a Domestic Building with Natural Ventilation. Energies, 12(17), p.3360.
CIBSE (2015). CIBSE Guide Volume A: Environmental Design. Chartered Institute of Building Services Engineers,
London (available via http://www.library.dmu.ac.uk/Resources/Databases/;
select Info4Education, use single sign-on).
Dinu, R.C., Ivan, F.E.S. and Popescu, D., 2016, October. Comparative analysis of thermal energy costs to ensure the
comfort parameters for an individual house. In 2016 International Conference on Applied and Theoretical
Electricity (ICATE) (pp. 1-6). IEEE.
Liu, G., Xiao, M., Zhang, X., Gal, C., Chen, X., Liu, L., Pan, S., Wu, J., Tang, L. and Clements-Croome, D., 2017.
A review of air filtration technologies for sustainable and healthy building ventilation. Sustainable cities and
society, 32, pp.375-396.
MEDAS, M., CHESIRE, D., Cripps, A., Connaughton, J., and Peters, M., 2016. Uncertainty, BIM and whole life
environmental impacts of building services.
SunCalc sun position- und sun phases calculator. (2019). Retrieved from https://www.suncalc.org/#/52.4104,-
1.7976,11/2019.09.15/14:30/1/3
Virk, G., Mylona, A., Mavrogianni, A. and Davies, M., 2015. Using the new CIBSE design summer years to assess
overheating in London: Effect of the urban heat island on design. Building Services Engineering Research and
Technology, 36(2), pp.115-128.
⊘ This is a preview!⊘
Do you want full access?
Subscribe today to unlock all pages.
Trusted by 1+ million students worldwide
1 out of 12


Your All-in-One AI-Powered Toolkit for Academic Success.
+13062052269
info@desklib.com
Available 24*7 on WhatsApp / Email
![[object Object]](/_next/static/media/star-bottom.7253800d.svg)
Unlock your academic potential
Copyright © 2020–2026 A2Z Services. All Rights Reserved. Developed and managed by ZUCOL.