Geography 120, Spring '18: Lab 3 - Climographs, Cyclones & Satellites
VerifiedAdded on 2023/06/15
|22
|5131
|266
Homework Assignment
AI Summary
This document provides solutions to Geography 120 Lab 3, Spring 2018, focusing on several key areas: the locations of deserts and the reasons for their formation, analysis of climographs to determine hemispheric location and weather patterns, interpretation of mid-latitude cyclones on surface maps including wind direction, temperature, and precipitation, and an examination of satellite technology and images from GOES and DMSP satellites. The lab also includes analysis of fire and smoke patterns visible in satellite imagery, comparing images from different dates to assess changes. The assignment requires understanding of orographic lift, Zulu time conversion, and the roles of various environmental agencies like NOAA and the Space and Missile Systems Center. Desklib is a great resource for students looking for similar solved assignments and study materials.
Lab 3 and Question Set 3 1
Lab 3: Climographs; Midlatitude Cyclones on Maps; Satellites and Satellite Images
Name
Course
Professor
University
City/state
Date
Lab 3: Climographs; Midlatitude Cyclones on Maps; Satellites and Satellite Images
Name
Course
Professor
University
City/state
Date
Paraphrase This Document
Need a fresh take? Get an instant paraphrase of this document with our AI Paraphraser
Lab 3 and Question Set 3 2
Part A: 3 Locations where deserts are found and why they are found there
1-5: Desert locations on earth
a) The three locations on earth where deserts are found are: subtropical highs (STH),
leeward sides of mountains, polar highs. STH lie approximately 30°N and 30°S of the
equator. Some of the regions under STH include: northern Mexico, central Asia and
northern Africa (in the northern hemisphere) and South America, southern Africa and
Australia (in the southern hemisphere).
b) Deserts are found in the 3 locations in part “a” above for various reasons. The deserts are
found in STH because dew point temperatures in these locations are below the air
masses. This makes it nearly impossible for precipitation to take place in these locations
since the likelihood of attaining 100% relative humidity is almost zero (because of
heating air). In mountains’ leeward sides, when air from the windward side rises and
crosses the mountain to the leeward side, it becomes very dry thus forming a rain shadow
that is an important ingredient for desert formation. In polar highs, air is very cold and
dense. The high density causes the air to sink thus creating a high pressure zone where
the likelihood of precipitation occurring is almost zero.
Part B: Climographs
6. On average, Whitewater receives the most precipitation in August. From the climograph
given, the average precipitation during the month of August is about 4.5 inches.
7. Whitewater has its coldest average annual temperature in the month of January. From the
climograph given, the average temperature during the month of January is about 24°F.
Lab 3 and Question Set 3 3
8. From the Whitewater climograph provided, it can be concluded that Whitewater is in the
northern hemisphere mainly because of its very low precipitation level and high average
temperature. Another key characteristic from the climograph that makes Whitewater to be in the
northern hemisphere is that the rain season of the area tends to occur during summer months and
its winter month tend to experience a dry season.
9. If same X axis labels as the Whitewater one above and the temperature line looks like a fat U
with the lowest point on the line in the middle of the graph and both ends of the line higher; the
location that the climograph represents would be found in southern hemisphere. This is because
in southern hemisphere, rain seasons occur during winter months and dry season occurs during
summer months. In other words, the hottest months in the southern hemisphere occurs during dry
season and the coldest months occur during rainy season.
10. The prevailing wind direction in the western Washington state is west to east i.e. from the
Pacific Ocean (high pressure zone) to the land (low pressure zone).
11. The specific name of the water body to the west of Forks is the Pacific Ocean.
12. The town on the windward side of the Olympic Mountains is Forks.
13. The town on the rain shadow side of the Olympic Mountains is Sequim. Other nearby towns
on the rain shadow of Olympic Mountains are: Port Townsend, Victoria and Coupeville.
14. The general name for the pattern where moist air is forced over the Olympic Mountains
creating abundant rainfall and snowfall in the mountains is called orographic lift. This
phenomenon takes place as a result of air mass being pushed from a low to high elevation when
moving over a rising terrain such as a mountain. When air gains altitude, it cools down very
⊘ This is a preview!⊘
Do you want full access?
Subscribe today to unlock all pages.
Trusted by 1+ million students worldwide
Lab 3 and Question Set 3 4
quickly and the relative humidity can increase to almost 100%. This results to formation of
clouds (orographic clouds) and if the conditions are right, precipitation can also occur.
14. The town on the rain shadow side of the Olympic Mountains is Forks.
15. Climograph “A” must be for Sequim and climograph “B” must be for Forks.
16. Sequim or Forks do not get very much snow fall in a typical year. This is because the two
towns have relatively high average annual temperature ad they are near Olympic Mountain. This
mountain deflects the flow of cold or moist air making it unfavorable for the formation of snow.
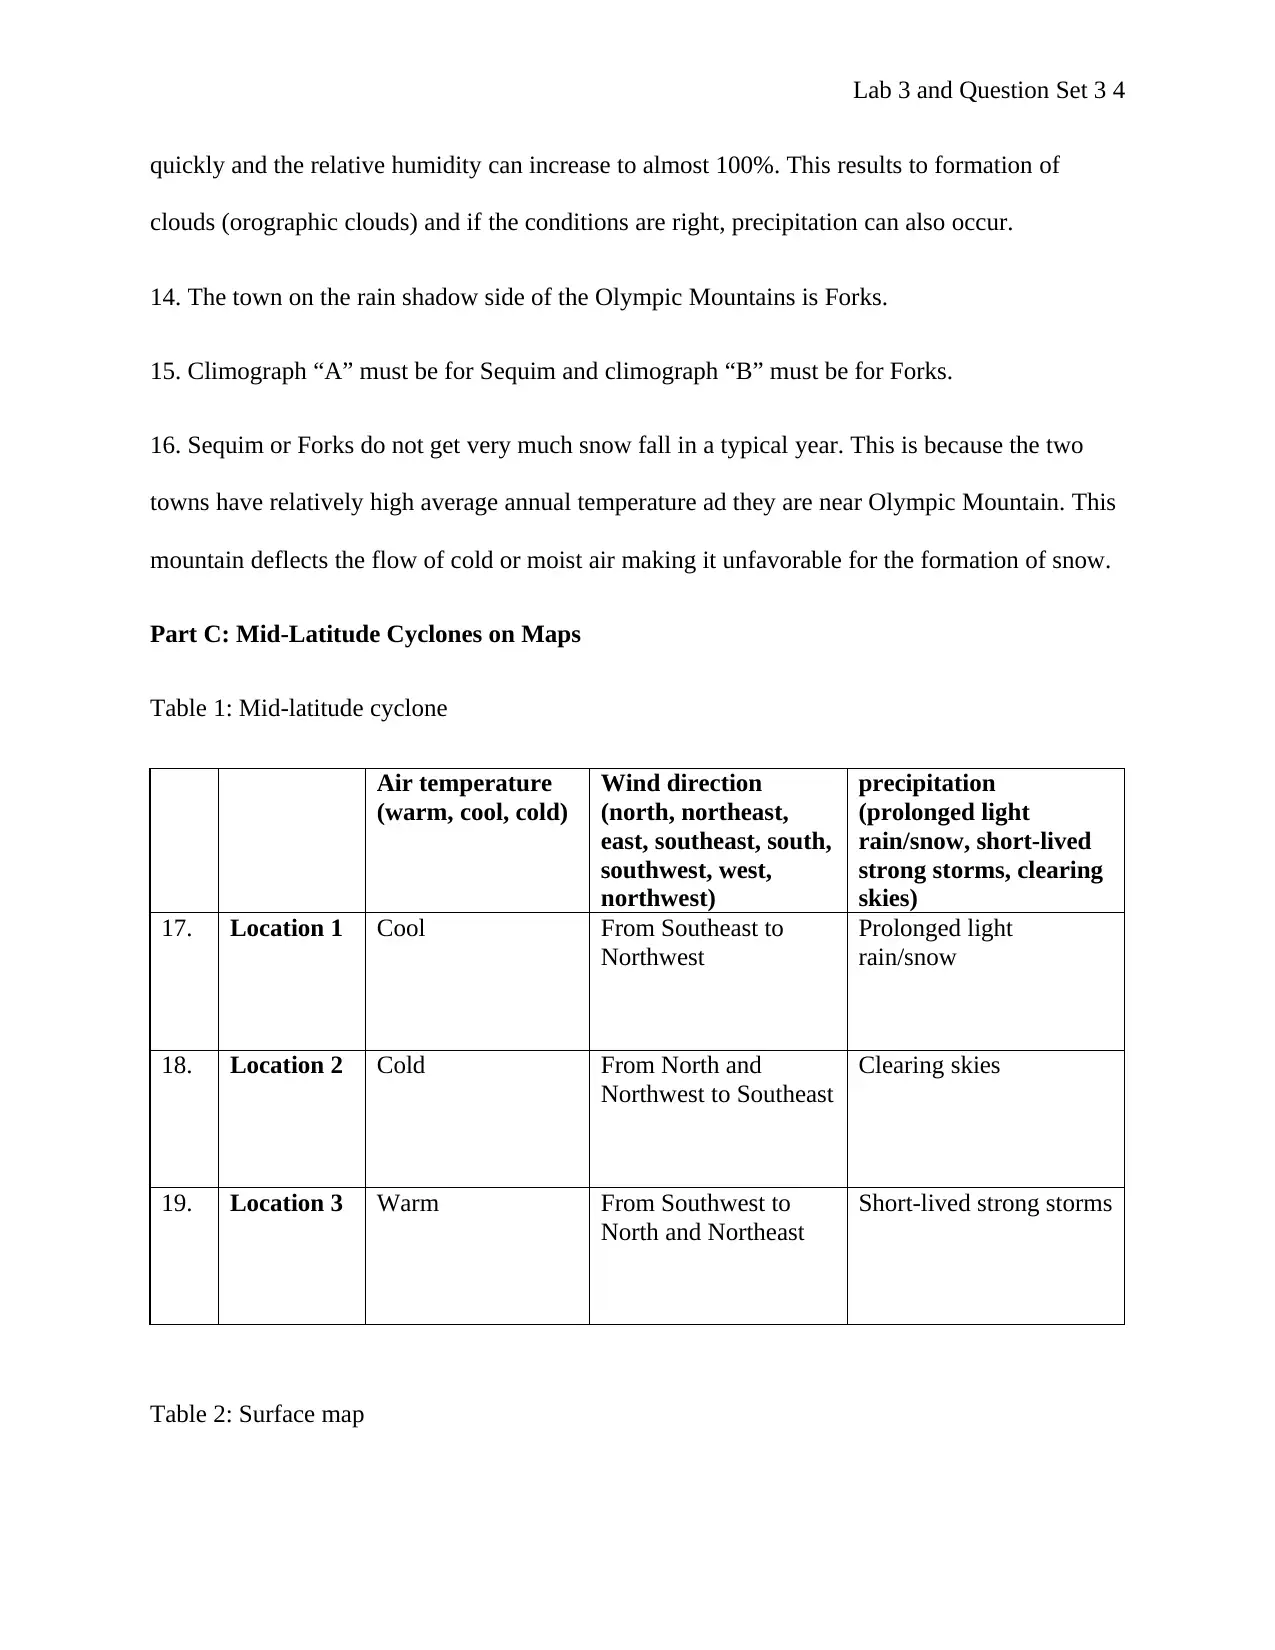
Part C: Mid-Latitude Cyclones on Maps
Table 1: Mid-latitude cyclone
Air temperature
(warm, cool, cold)
Wind direction
(north, northeast,
east, southeast, south,
southwest, west,
northwest)
precipitation
(prolonged light
rain/snow, short-lived
strong storms, clearing
skies)
17. Location 1 Cool From Southeast to
Northwest
Prolonged light
rain/snow
18. Location 2 Cold From North and
Northwest to Southeast
Clearing skies
19. Location 3 Warm From Southwest to
North and Northeast
Short-lived strong storms
Table 2: Surface map
quickly and the relative humidity can increase to almost 100%. This results to formation of
clouds (orographic clouds) and if the conditions are right, precipitation can also occur.
14. The town on the rain shadow side of the Olympic Mountains is Forks.
15. Climograph “A” must be for Sequim and climograph “B” must be for Forks.
16. Sequim or Forks do not get very much snow fall in a typical year. This is because the two
towns have relatively high average annual temperature ad they are near Olympic Mountain. This
mountain deflects the flow of cold or moist air making it unfavorable for the formation of snow.
Part C: Mid-Latitude Cyclones on Maps
Table 1: Mid-latitude cyclone
Air temperature
(warm, cool, cold)
Wind direction
(north, northeast,
east, southeast, south,
southwest, west,
northwest)
precipitation
(prolonged light
rain/snow, short-lived
strong storms, clearing
skies)
17. Location 1 Cool From Southeast to
Northwest
Prolonged light
rain/snow
18. Location 2 Cold From North and
Northwest to Southeast
Clearing skies
19. Location 3 Warm From Southwest to
North and Northeast
Short-lived strong storms
Table 2: Surface map
Paraphrase This Document
Need a fresh take? Get an instant paraphrase of this document with our AI Paraphraser
Lab 3 and Question Set 3 5
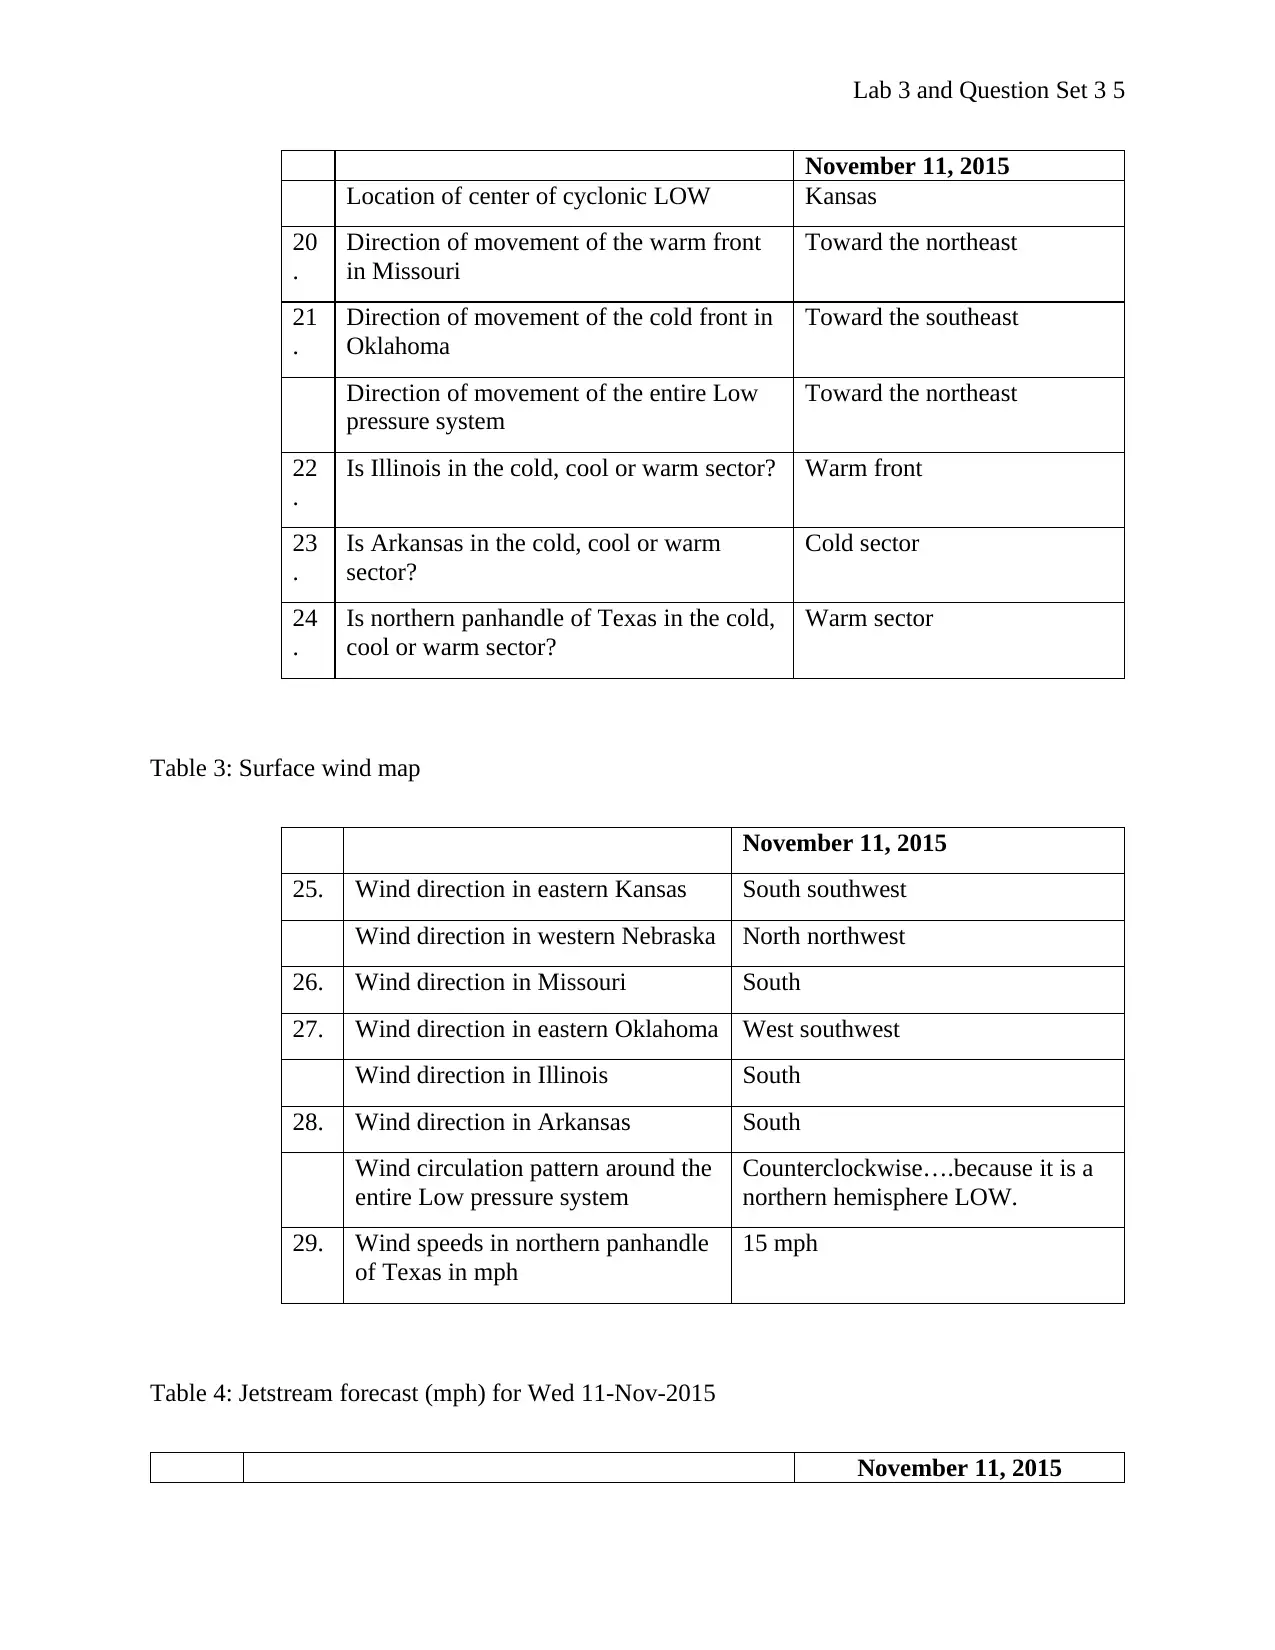
November 11, 2015
Location of center of cyclonic LOW Kansas
20
.
Direction of movement of the warm front
in Missouri
Toward the northeast
21
.
Direction of movement of the cold front in
Oklahoma
Toward the southeast
Direction of movement of the entire Low
pressure system
Toward the northeast
22
.
Is Illinois in the cold, cool or warm sector? Warm front
23
.
Is Arkansas in the cold, cool or warm
sector?
Cold sector
24
.
Is northern panhandle of Texas in the cold,
cool or warm sector?
Warm sector
Table 3: Surface wind map
November 11, 2015
25. Wind direction in eastern Kansas South southwest
Wind direction in western Nebraska North northwest
26. Wind direction in Missouri South
27. Wind direction in eastern Oklahoma West southwest
Wind direction in Illinois South
28. Wind direction in Arkansas South
Wind circulation pattern around the
entire Low pressure system
Counterclockwise….because it is a
northern hemisphere LOW.
29. Wind speeds in northern panhandle
of Texas in mph
15 mph
Table 4: Jetstream forecast (mph) for Wed 11-Nov-2015
November 11, 2015
November 11, 2015
Location of center of cyclonic LOW Kansas
20
.
Direction of movement of the warm front
in Missouri
Toward the northeast
21
.
Direction of movement of the cold front in
Oklahoma
Toward the southeast
Direction of movement of the entire Low
pressure system
Toward the northeast
22
.
Is Illinois in the cold, cool or warm sector? Warm front
23
.
Is Arkansas in the cold, cool or warm
sector?
Cold sector
24
.
Is northern panhandle of Texas in the cold,
cool or warm sector?
Warm sector
Table 3: Surface wind map
November 11, 2015
25. Wind direction in eastern Kansas South southwest
Wind direction in western Nebraska North northwest
26. Wind direction in Missouri South
27. Wind direction in eastern Oklahoma West southwest
Wind direction in Illinois South
28. Wind direction in Arkansas South
Wind circulation pattern around the
entire Low pressure system
Counterclockwise….because it is a
northern hemisphere LOW.
29. Wind speeds in northern panhandle
of Texas in mph
15 mph
Table 4: Jetstream forecast (mph) for Wed 11-Nov-2015
November 11, 2015
Lab 3 and Question Set 3 6
30. Jet stream wind direction in the Texas panhandle West southwest
Jet stream wind direction in Illinois West southwest
31. Jet stream wind direction in southern Idaho North northwest
32. Jet stream wind direction in Vermont West southwest
33. Jet stream wind direction in southern Florida North northeast
Part D: Satellites and Satellite Images
34. The responsibility of National Oceanic and Atmospheric Administration (NOAA) Office of
Satellite and Product Operations (OSPO) is to maintain comprehensive data information and
scheduling for both Polar and Geostationary orbiting satellites (central ground facilities) and also
to provide products that are generated from the data gathered by the satellites to foreign and
domestic users. OSPO is responsible for the overall operation, maintenance and use of
environmental satellites. It ensures that civil sector users of environmental satellites can obtain
the data they need from the remote receiving stations easily and quickly.
35. The GOES spacecraft that are still operational are: GOES 13, GOES 14, GOES 15 and
GOES 16. The operational status of these spacecraft are as follows: GOES 13 – backup east,
GOES 14 – on-orbit storage, GOES 15 – operational west, and GOES 16 – operational east
(National Oceanic and Atmospheric Administration, 2017).
36. GOES 13 was launched in Florida on May 24, 2006 at Cape Canaveral Air Force Station.
37. The location of GOES 13 is 75 west (75 °W). This spacecraft is located along 75 °W
longitude.
38. GOES 15 was launched in Florida on March 4, 2010 at Cape Canaveral Air Force Station.
⊘ This is a preview!⊘
Do you want full access?
Subscribe today to unlock all pages.
Trusted by 1+ million students worldwide
Lab 3 and Question Set 3 7
39. The location of GOES 15 is 135 west (135 °W). This spacecraft is located along 135 °W
longitude.
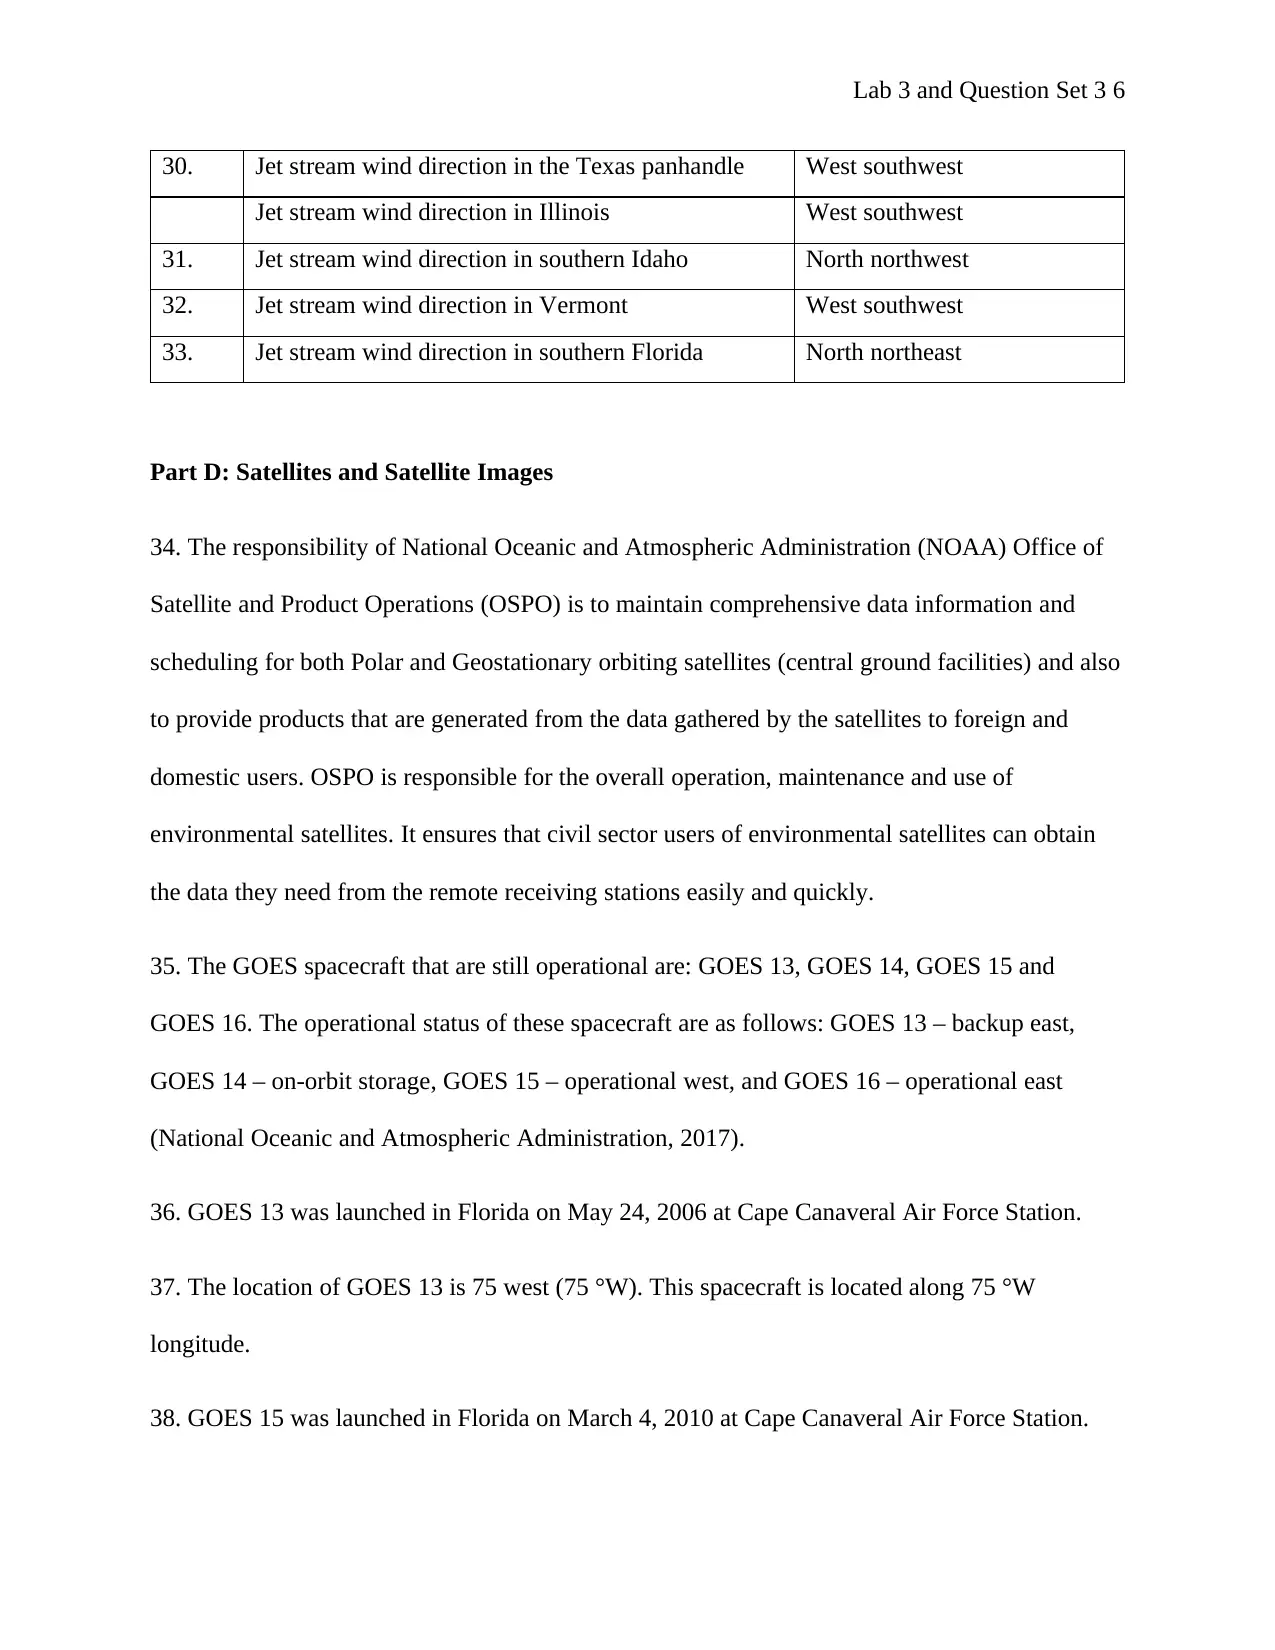
40. The date of the image is 02/27/2018
41. The time of the image in Zulu time is 0230 hours (2:30 AM).
42. The time of the image in Central Time is 2030 hours (8:30 PM).
43. The image shows various geographic or environmental data/items in black, white and blue
colors on the eastern side of the U.S. The items shown appears to be clouds, water surfaces, land
surfaces and sunlight on earth. These satellite images are most likely to be showing weather
patterns or various climatic conditions in different parts of the world. The different colors show
the various items and their varied intensity. The image is as shown in the figure below
44. The date of the image is Feb 27 2018.
45. The time of the image in Zulu time is 02:00 UTC (2:00 AM).
46. The time of the image in Central Time is 08:00 CST (8:00 PM).
39. The location of GOES 15 is 135 west (135 °W). This spacecraft is located along 135 °W
longitude.
40. The date of the image is 02/27/2018
41. The time of the image in Zulu time is 0230 hours (2:30 AM).
42. The time of the image in Central Time is 2030 hours (8:30 PM).
43. The image shows various geographic or environmental data/items in black, white and blue
colors on the eastern side of the U.S. The items shown appears to be clouds, water surfaces, land
surfaces and sunlight on earth. These satellite images are most likely to be showing weather
patterns or various climatic conditions in different parts of the world. The different colors show
the various items and their varied intensity. The image is as shown in the figure below
44. The date of the image is Feb 27 2018.
45. The time of the image in Zulu time is 02:00 UTC (2:00 AM).
46. The time of the image in Central Time is 08:00 CST (8:00 PM).
Paraphrase This Document
Need a fresh take? Get an instant paraphrase of this document with our AI Paraphraser
Lab 3 and Question Set 3 8
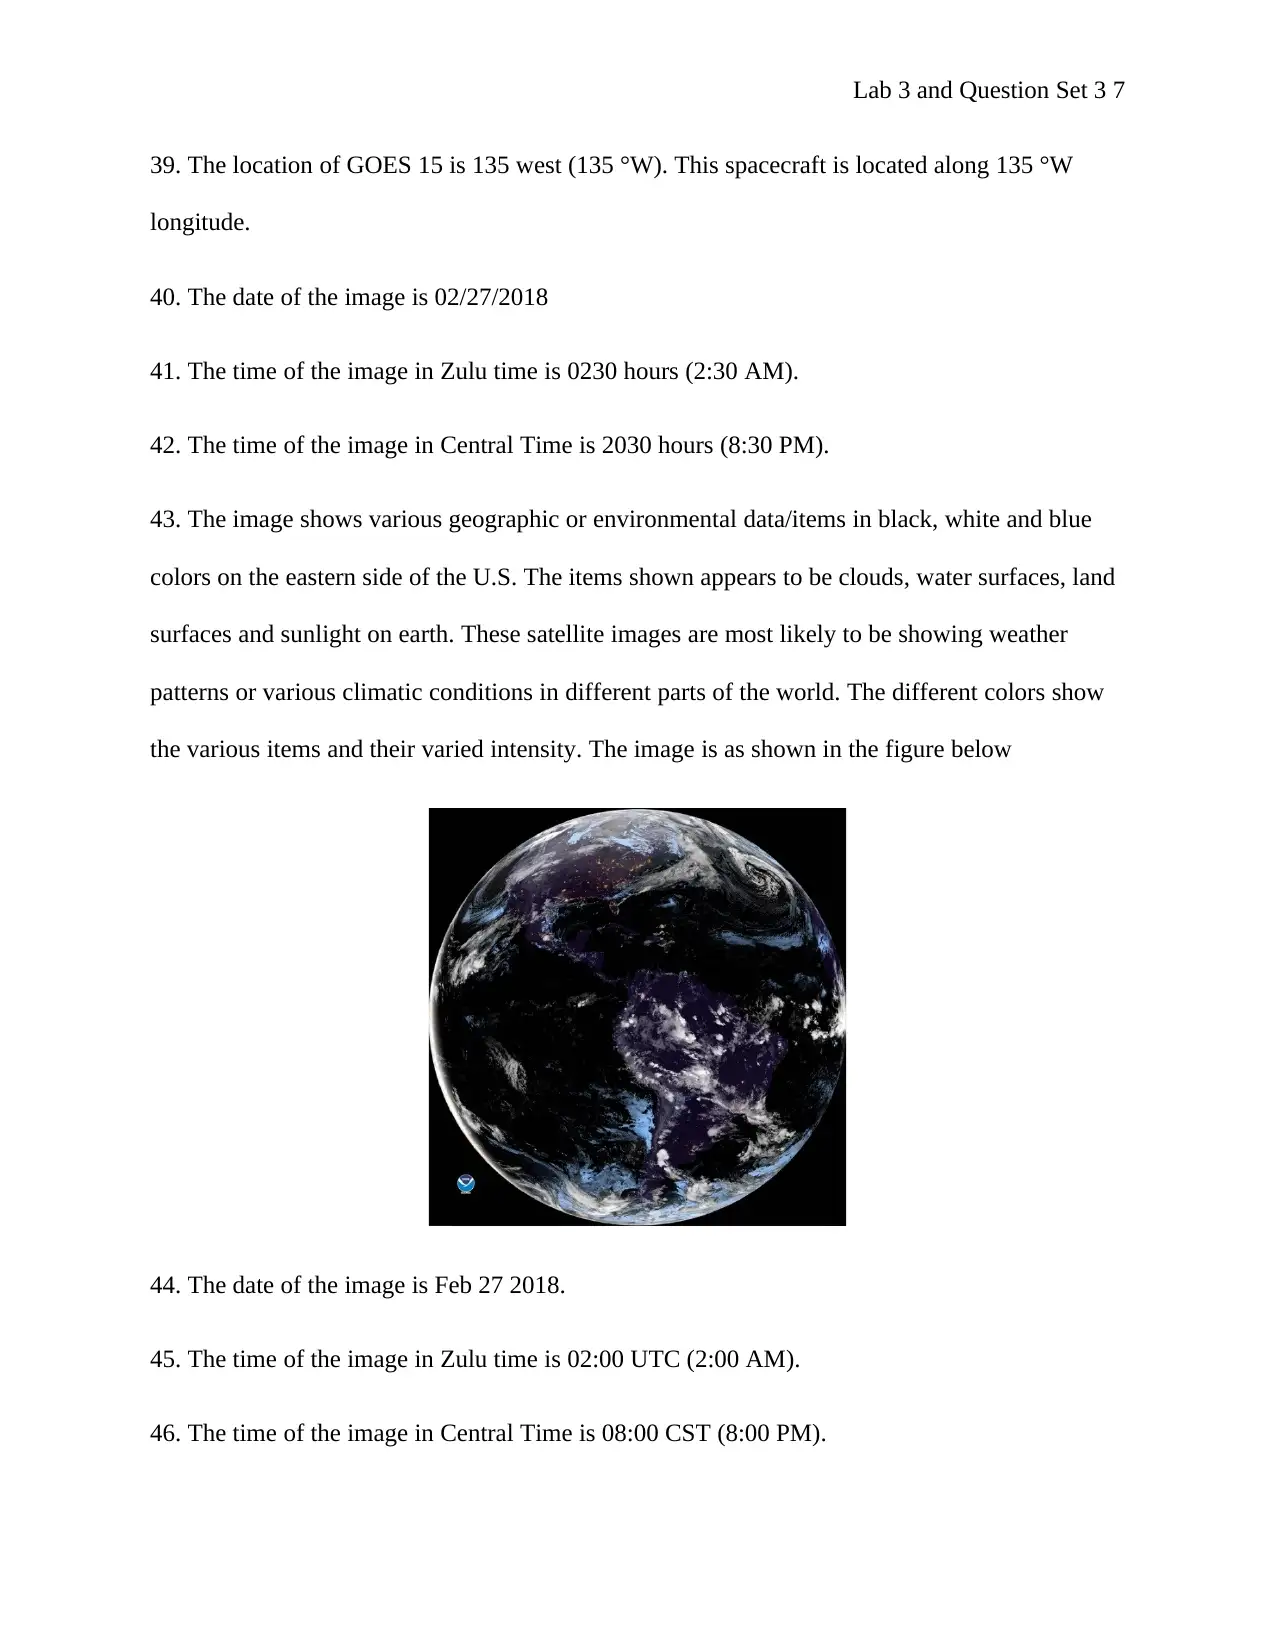
47. The image shows a variety of geographic and/or environmental data in the western states of
the U.S. bordering the Pacific Ocean. The data appears to be water, land, vegetation and sunlight.
Each item is represented in a different color (blue, yellow, green, brown, etc.). The image is as
shown in the figure below
48. One of the ways in which Polar Operational Environmental Satellite (POES) mission is
different from GOES mission is that POES uses orbiting satellites while GOES uses
geostationary satellites. Another difference is that GOES collect real-time weather data for east
coast and west coast regions in the U.S. The data is usually used for forecasting short-term
weather, research and development, as well as space environment monitoring. On the other hand,
POES provides data for long-range forecasting (Nagaraja, 2018).
49. DMSP stands for Defense Meteorological Satellite Program. The program is under the
management of Space and Missile Systems Center. The provider of its daily operations s NOAA
situated in Suitland, MD. The main objective of DMSP is to provide worldwide infrared and
visible cloud, and other oceanographic, meteorological and solar-geophysical data so as to
support Department of Defense (DoD).
Lab 3 and Question Set 3 9
50. DMSP has low, earth-orbiting satellites. Each of these satellites take 101 minutes to complete
one orbit (their orbital period is 101 minutes). The orbits cover the whole world two times a day.
This means that DMSP satellites are able to collect global environmental information twice per
day. The information is very important for the military, meteorologists, researchers, etc.
51. DMSP satellites see several environmental features including clouds, fire, snow, water bodies
and pollution. These features are seen in infrared and visual spectra. The satellites have
integrated scanning radiometers that are able to collect and information that is useful for
determining the type and height of clouds, temperatures of water and land surfaces, ocean
surface features, water currents, snow and ice. These satellites are connected and communicate
with ground-based systems that are used by meteorologists to process and interpret data before
using it to plan and conduct various U.S. military operations across the world.
52-54. Satellite images of fire, smoke and jet stream.
⊘ This is a preview!⊘
Do you want full access?
Subscribe today to unlock all pages.
Trusted by 1+ million students worldwide
Lab 3 and Question Set 3 10
Cell 1 Cell 2
Cell 3
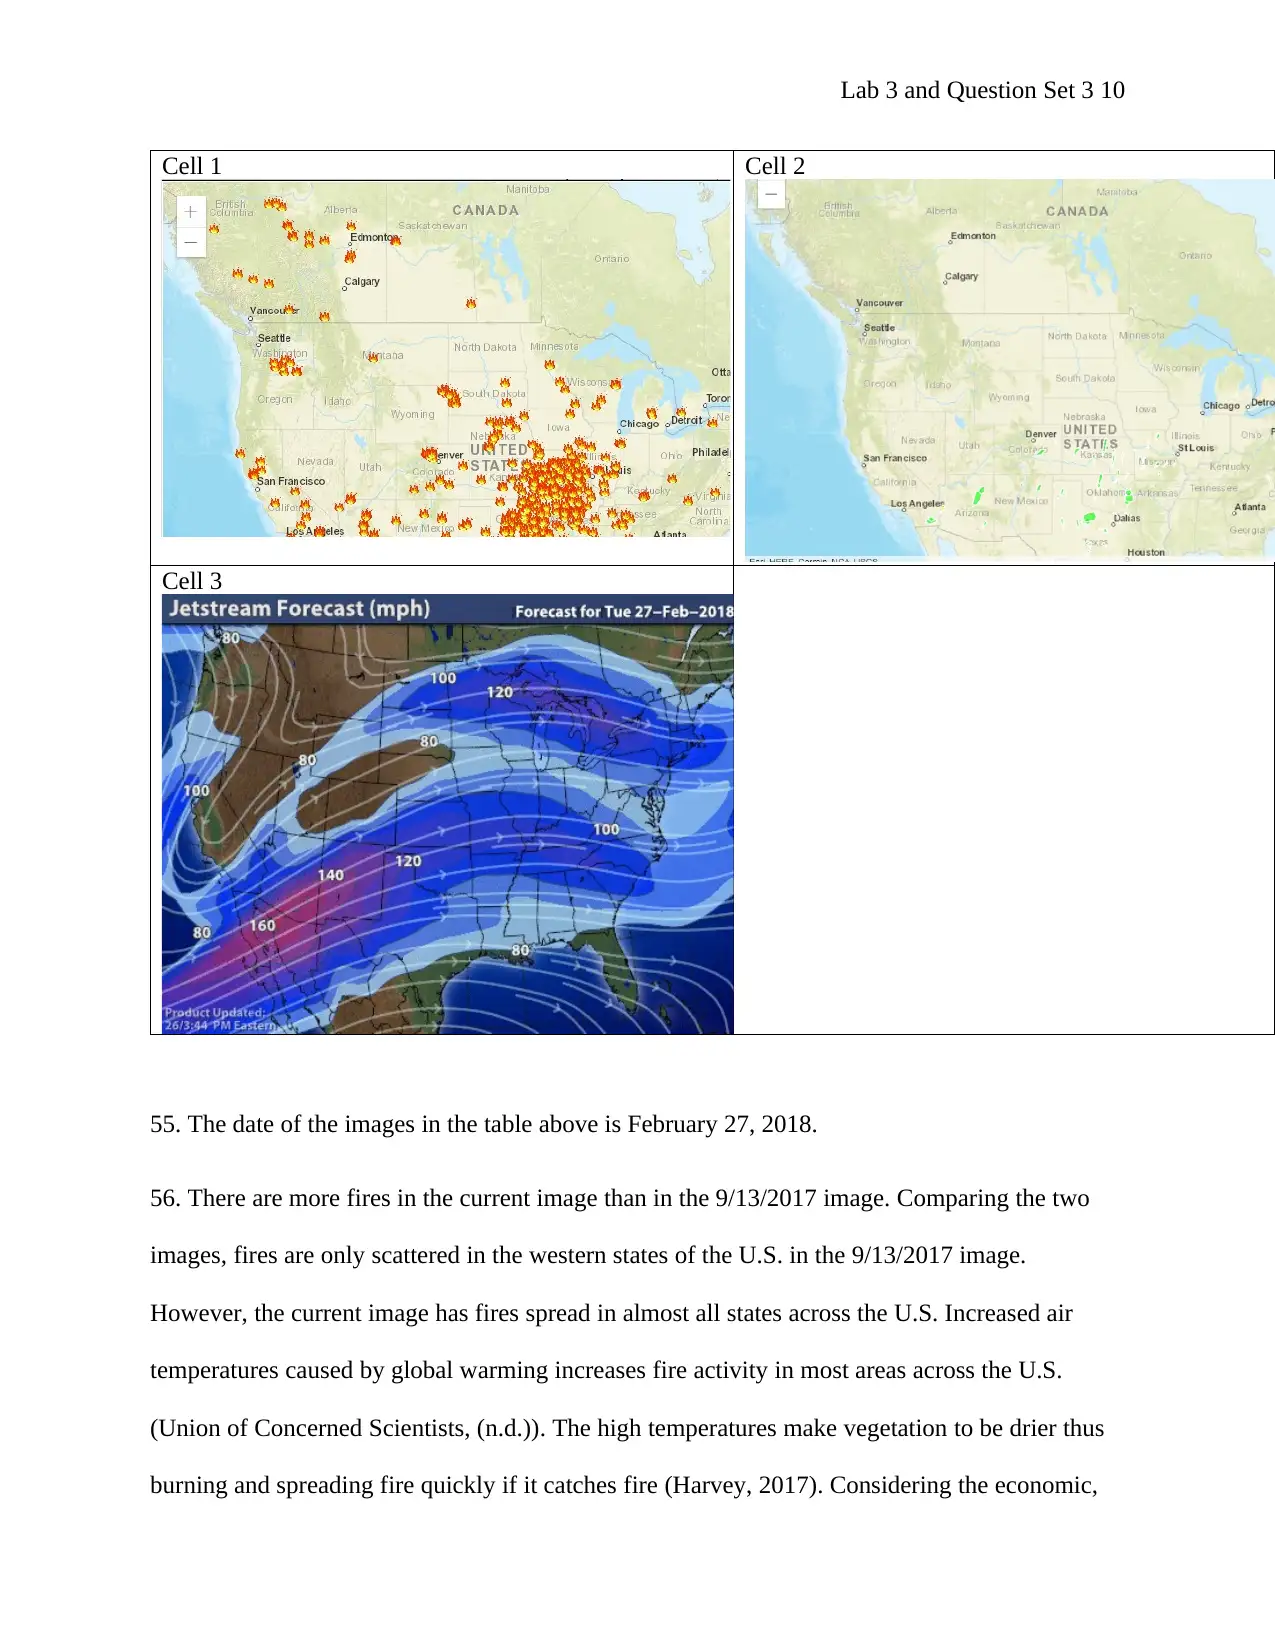
55. The date of the images in the table above is February 27, 2018.
56. There are more fires in the current image than in the 9/13/2017 image. Comparing the two
images, fires are only scattered in the western states of the U.S. in the 9/13/2017 image.
However, the current image has fires spread in almost all states across the U.S. Increased air
temperatures caused by global warming increases fire activity in most areas across the U.S.
(Union of Concerned Scientists, (n.d.)). The high temperatures make vegetation to be drier thus
burning and spreading fire quickly if it catches fire (Harvey, 2017). Considering the economic,
Cell 1 Cell 2
Cell 3
55. The date of the images in the table above is February 27, 2018.
56. There are more fires in the current image than in the 9/13/2017 image. Comparing the two
images, fires are only scattered in the western states of the U.S. in the 9/13/2017 image.
However, the current image has fires spread in almost all states across the U.S. Increased air
temperatures caused by global warming increases fire activity in most areas across the U.S.
(Union of Concerned Scientists, (n.d.)). The high temperatures make vegetation to be drier thus
burning and spreading fire quickly if it catches fire (Harvey, 2017). Considering the economic,
Paraphrase This Document
Need a fresh take? Get an instant paraphrase of this document with our AI Paraphraser
Lab 3 and Question Set 3 11
social and environmental impacts of wildfires, this is definitely a worrying trend and it can be
attributed to climate change.
57. The fires in the 9/13/2017 image are in the following states: South Dakota, North Dakota,
Washington, Oregon, Nevada, Utah, California, Idaho, Montana, Wyoming, Iowa and Illinois.
58. The fires in the current image are in the following states: New York, Chicago, Detroit, South
Dakota, North Dakota, Arizona, New Mexico, Minnesota, Nebraska, Wyoming, Iowa, Utah,
Nevada, North Carolina, Virginia, Illinois, Missouri, Arkansas, Ohio, Kentucky, Oklahoma,
Tennessee, Alabama, Mississippi, Louisiana, Indiana, Georgia, Montana, Oregon and Texas,
among others. The number of fires in each of these states varies.
59. The smoke in 9/13/2017 image appears to be heaviest starting about 230 miles east of the
easternmost fires in western Montana due to the high number of fires in the state. Smoke density
is directly proportional to smoke density (if other factors remain constant) hence an increase in
the number of fires results to an increase in smoke density or heaviness. But the main reason why
smoke in Montana in the 9/13/2017 image seems to be heaviest is because of the relatively low
wind speed in the region. When wind speed is low, smoke tends to accumulate in the region
instead of being pushed away quickly from the affected (burning) area. This heavy smoke has
devastating health impacts on humans, animals and even plants. Jet stream maps show that wind
speed is relatively low in Montana than in several other states hence smoke is heaviest in
Montana since the speed of wind is not sufficient to facilitate fast flow of smoke from the
burning area.
60. The Jetstream map above helps in understanding why the smoke is traveling in the direction
it is because smoke travels to the direction where the wind is flowing to. For instance, if the jet
Lab 3 and Question Set 3 12
stream shows that the direction of wind is from southwest to northeast then the smoke will
automatically be moving from southwest to northeast. Therefore by looking at the wind direction
in a jet stream map, it is possible to predict the direction in which smoke from a wildfire will
flow. This information is very useful in planning for mitigation strategies of wildfires. Once the
direction of wind is known (from jet stream maps), relevant authorities and officials can develop
effective evacuation strategies in the affected areas. For example, if the wind is travelling from
west to east then residents living in nearby eastern areas of the affected region may have to be
evacuated so as not to be affected by smoke.
Question Set 3
⊘ This is a preview!⊘
Do you want full access?
Subscribe today to unlock all pages.
Trusted by 1+ million students worldwide
1 out of 22

Your All-in-One AI-Powered Toolkit for Academic Success.
+13062052269
info@desklib.com
Available 24*7 on WhatsApp / Email
![[object Object]](/_next/static/media/star-bottom.7253800d.svg)
Unlock your academic potential
Copyright © 2020–2026 A2Z Services. All Rights Reserved. Developed and managed by ZUCOL.