Project Risk Management Plan for Clinic Management System - Report
VerifiedAdded on 2022/12/27
|23
|4324
|1
Report
AI Summary
This report details a comprehensive risk management plan for the implementation of a Clinic Management System at the WellToDo clinic in Al Ain. The project, with a 120-day timeline and a budget of AED 120,240.00, addresses key risks such as incomplete requirements, funding shortages, scope creep, and developer shortages. The plan incorporates a Work Breakdown Structure (WBS), time and cost estimates, and techniques like CPM, crashing, and Monte Carlo simulation to assess and mitigate risks. A RACI matrix clarifies roles and responsibilities. The report outlines risk identification, quantification, and response strategies, including a risk register and contingency plans. The analysis includes break-even analysis, and the project's critical path is identified. The conclusion recommends continuous monitoring to proactively address emerging risks, ensuring successful project completion and system implementation.
RUNNING HEAD: Risk Management Plan
Risk Management Plan
For Clinic Management System Project
Risk Management Plan
For Clinic Management System Project
Paraphrase This Document
Need a fresh take? Get an instant paraphrase of this document with our AI Paraphraser
Risk Management Plan 2
Executive Summary
Risk management is vital for any project. The paper develops a risk management plan for the
Clinic Management System. The project is scheduled to run for a period of 120 days at an
estimated budget of AED 120,240.00. The main risks that face this project include;
Incomplete or confusing requirements
Shortage of funds
Inadequate resources
Scope Creep
Schedule overrun
Shortage of qualified software developers for the project.
Quality of developed system
Software Bugs; which may affect user experience during live testing and delay the project
sign-off
Unrealistic cost estimates
For each identified risk, an appropriate response and control has been established and
documented. However, risks can occur at any stage of the project and it’s impossible to identify
and deal with all risks. We therefore recommend a continuous monitoring and evaluation of the
project – as it progresses- to identify new risk and catch them in time, before they cause any
impacts on the project.
Risk Management Plan 3
Table of Contents
Executive Summary.....................................................................................................................................2
1.0 Introduction......................................................................................................................................4
1.1 Background of the Clinic...............................................................................................................4
1.2 Main Issue....................................................................................................................................4
1.3 Foreseeable accomplishments.....................................................................................................4
1.4 Plan of the Project........................................................................................................................5
2.0 Risk Management Plan.....................................................................................................................5
2.1 WBS.............................................................................................................................................5
2.1.1 Activities Precedence table...................................................................................................6
2.2 Time Estimates.............................................................................................................................7
Gantt chart...........................................................................................................................................8
2.3 Cost Estimates..............................................................................................................................9
2.4 CPM, Crashing & Crashing Schedule.........................................................................................11
2.5 Monte Carlo Simulation..............................................................................................................12
2.6 3.2 RACI....................................................................................................................................12
2.7 Risk identification + develop RBS.............................................................................................13
2.8 Risk quantification......................................................................................................................14
Risk Occurrence Probability................................................................................................................15
Impact................................................................................................................................................16
2.9 Risk response development........................................................................................................16
2.10 Risk response control/Risk Contingency Plan............................................................................17
Decision Tree.............................................................................................................................................21
Net Present Value...................................................................................................................................21
3.0 Conclusions....................................................................................................................................22
3.1 Discussion..................................................................................................................................22
3.2 Conclusion..................................................................................................................................22
3.3 Recommendation........................................................................................................................23
References..................................................................................................................................................24
⊘ This is a preview!⊘
Do you want full access?
Subscribe today to unlock all pages.
Trusted by 1+ million students worldwide

Risk Management Plan 4
1.0 Introduction
Risk management is an integral part of project management. The PMBOK Guide version five
defines project risk; as anything with potential to impact a project’s budget, performance or
schedule (Snyder, 2013). In any project, the critical trade-offs are time, quality and resources.
Risks in a project tend to affect the three critical aspects of a project; a negative effect on a
project schedule translates to a potential budget increase, as resources are used longer than
planned (Snyder, 2013). On the other hand, a risk that negatively affects project resources affects
the quality of project deliverables, as fewer resources are used to produce the deliverables. As
such, managing project risk is extremely vital.
1.1 Background of the Clinic
WellToDo clinic is a comprehensive family health clinic, located in Al Ain. The clinic provides
healthcare related services in its large complex at Al Ain. Currently the clinic uses a manual
system, where patients are issued with a card, with a unique patient id; so that their records can
be retrieved the next time they visit the clinic. The manual system is highly inefficient and the
management has decided to embark on developing a Clinic Management system, to automate
processes and record keeping at the clinic.
1.2 Main Issue
The process of establishing effective project risk management entails identifying, analyzing and
responding to risks as they arise over the project’s life cycle. Managing project risks helps keep
the project on track and meet the goals of the project (Webb, 2017). Effective risk management is
not reactive; rather, it has to be incorporate in every phase of the project, right from the planning
stage. This approach helps to figure out risks and establish controls and mitigation strategies for
the identified risks. Risk management is therefore defined as a process of “identifying,
categorizing, prioritizing and planning for risks before they happen” (Snyder, 2013).
1.3 Foreseeable accomplishments
This document presents a risk management plan for the project that seeks to implement a Medical
Clinic Management System, for WellToDo clinic in Al Ain. The document outlines the 5 phases
of risk management planning; risk identification, analysis of the risks, evaluation and ranking of
the risk, development of a risk response plan in a risk register and review of the risk register to
track and control the risks. The foreseeable accomplishments of the project include;
Paraphrase This Document
Need a fresh take? Get an instant paraphrase of this document with our AI Paraphraser
Risk Management Plan 5
1.4 Plan of the Project
The document first presents the project details through a work breakdown structure, a project
schedule in form of time estimates, cost estimates and finally the five processes of risk
management planning. The techniques used in developing the risk management plan includes;
RBS, RACI, Matrix/Probability, Occurrences/Impact graph(s), Decision Tree(s) and Break Even
Analysis.
2.0 Risk Management Plan
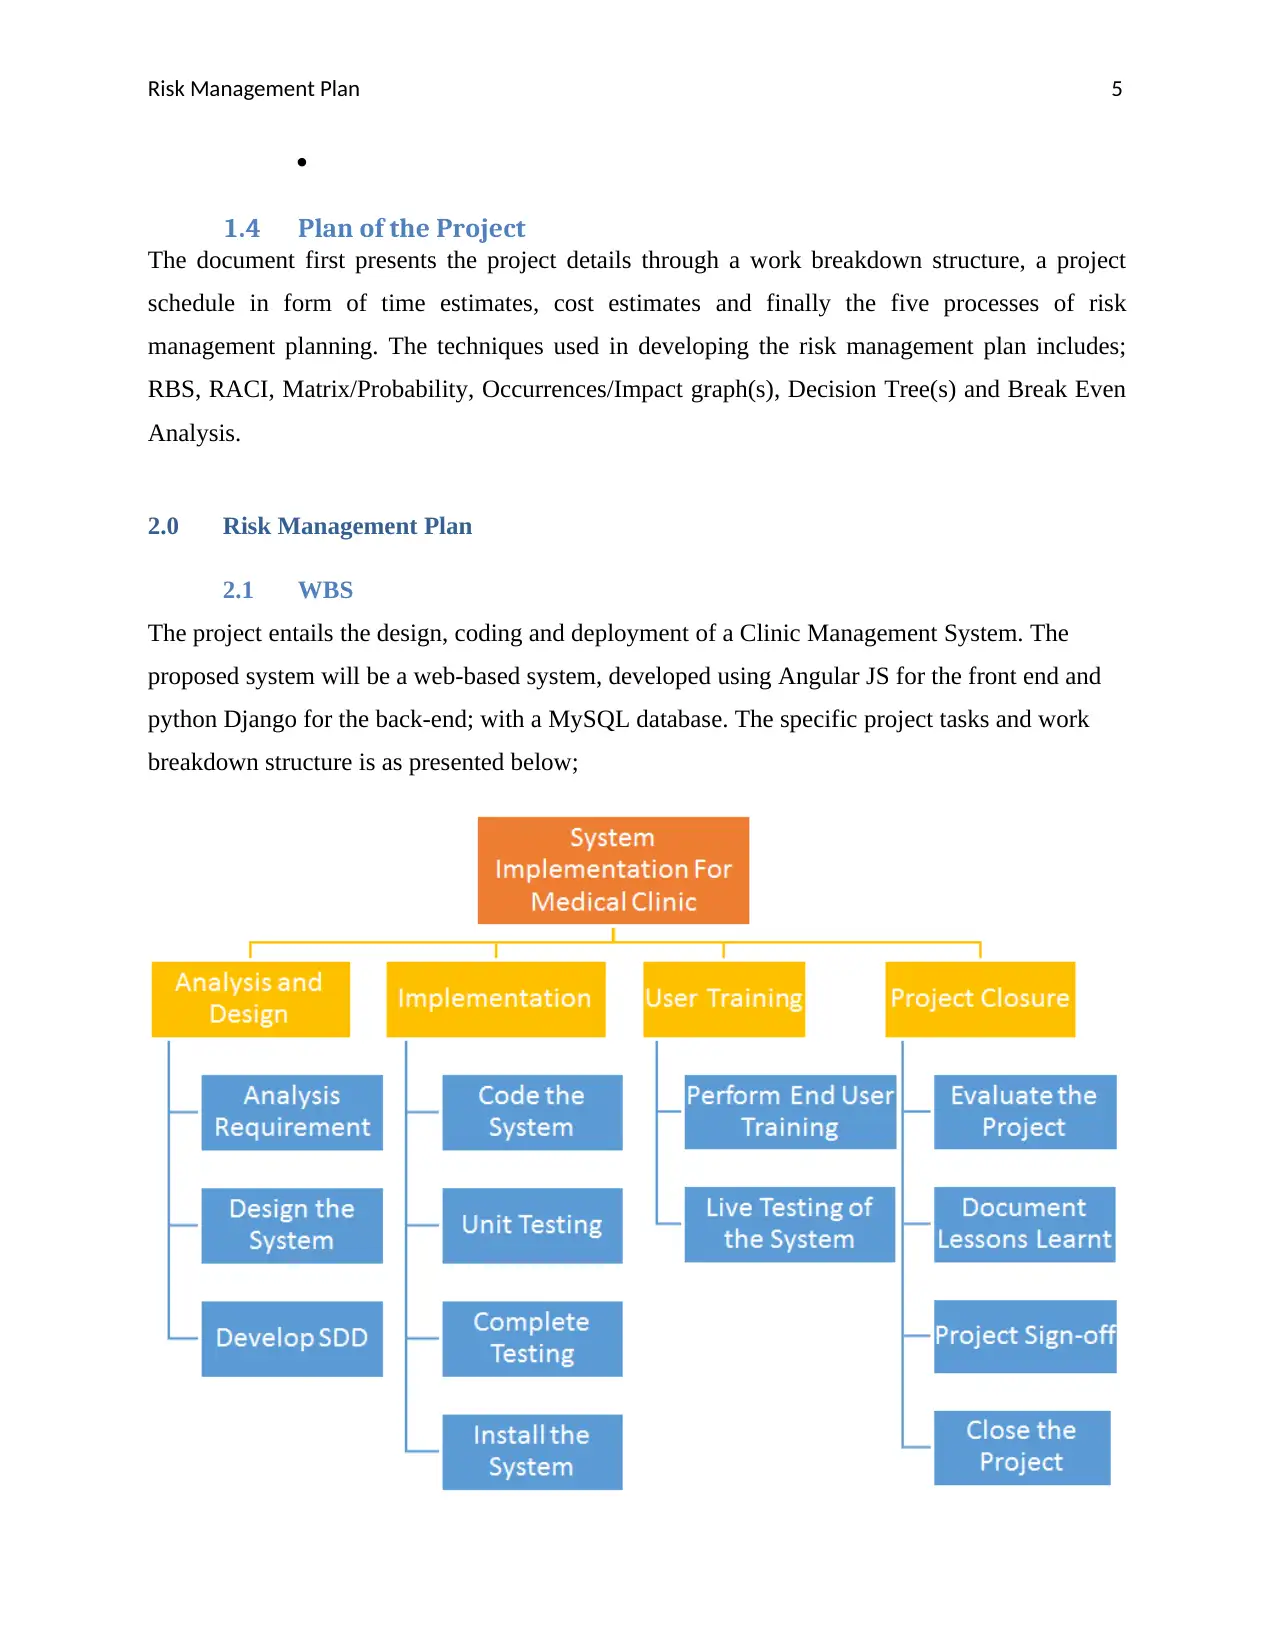
2.1 WBS
The project entails the design, coding and deployment of a Clinic Management System. The
proposed system will be a web-based system, developed using Angular JS for the front end and
python Django for the back-end; with a MySQL database. The specific project tasks and work
breakdown structure is as presented below;
1.4 Plan of the Project
The document first presents the project details through a work breakdown structure, a project
schedule in form of time estimates, cost estimates and finally the five processes of risk
management planning. The techniques used in developing the risk management plan includes;
RBS, RACI, Matrix/Probability, Occurrences/Impact graph(s), Decision Tree(s) and Break Even
Analysis.
2.0 Risk Management Plan
2.1 WBS
The project entails the design, coding and deployment of a Clinic Management System. The
proposed system will be a web-based system, developed using Angular JS for the front end and
python Django for the back-end; with a MySQL database. The specific project tasks and work
breakdown structure is as presented below;
Risk Management Plan 6
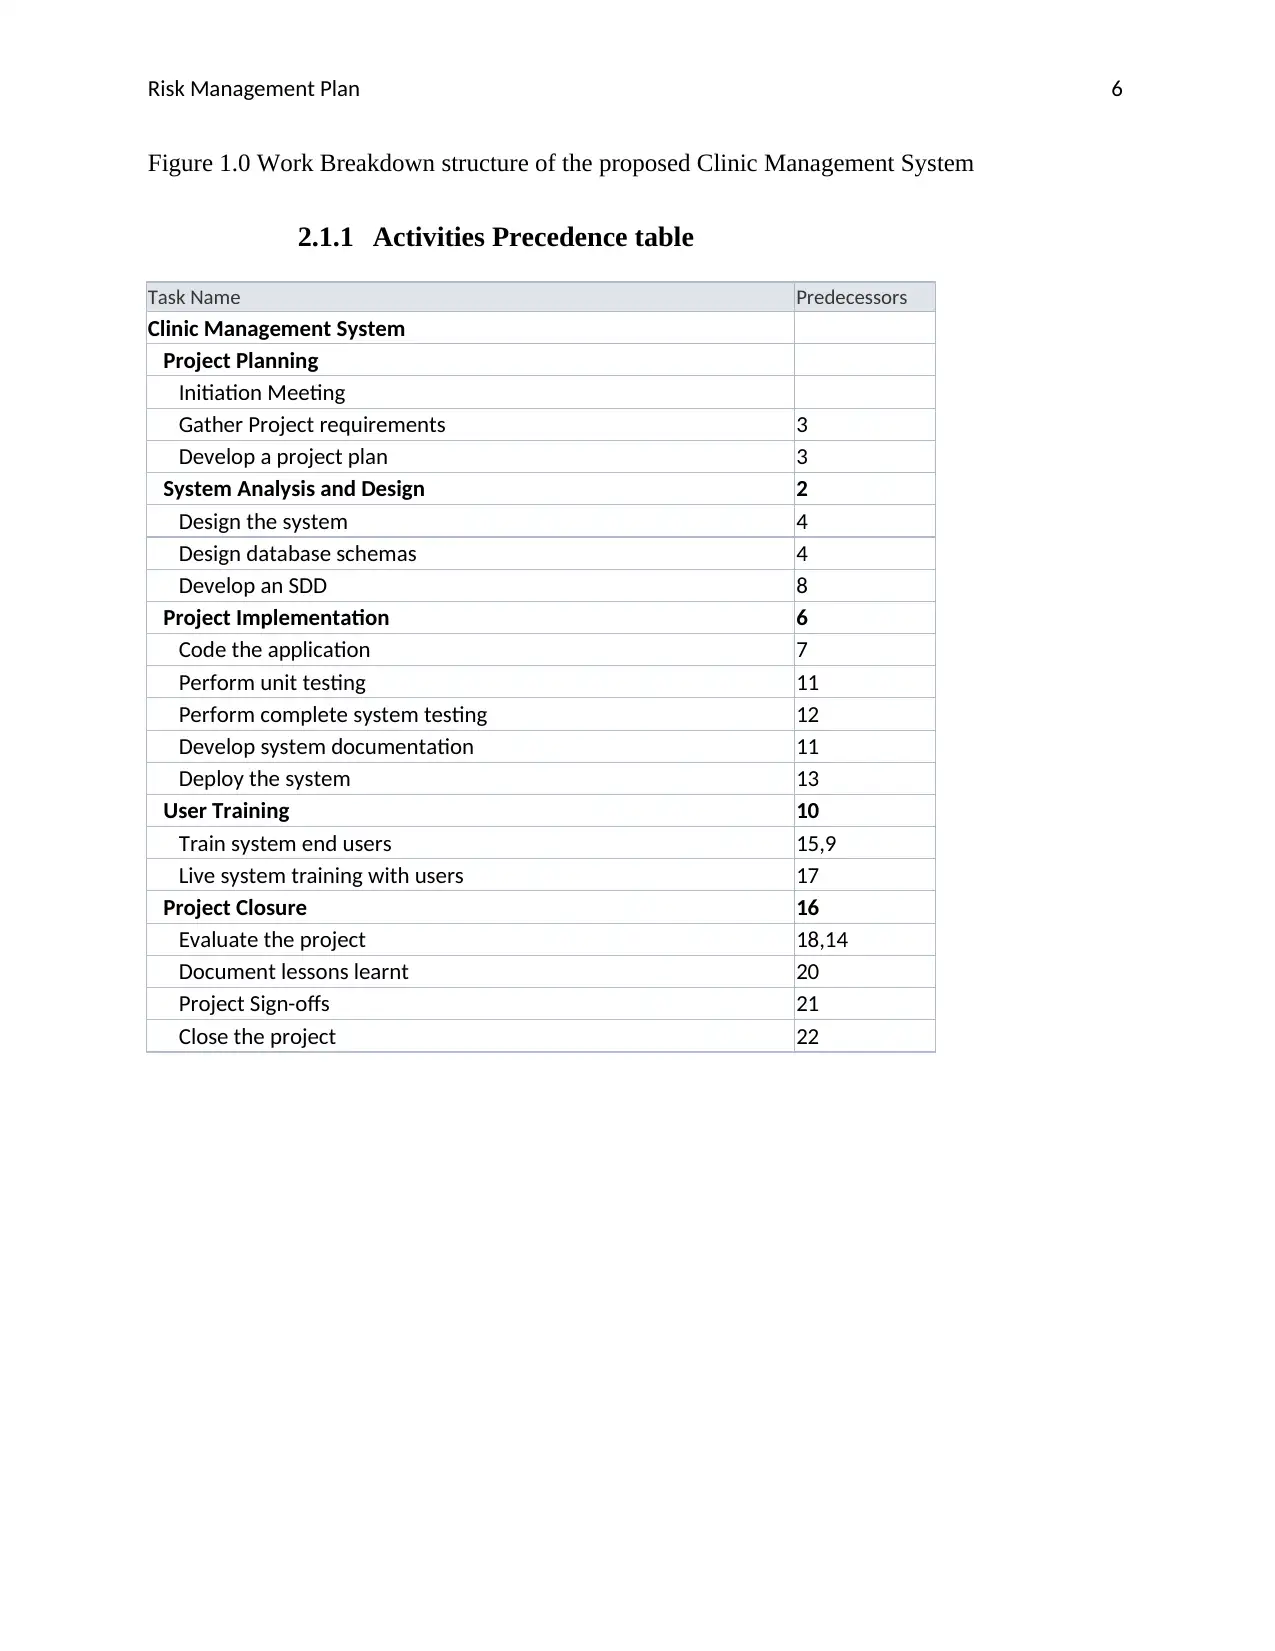
Figure 1.0 Work Breakdown structure of the proposed Clinic Management System
2.1.1 Activities Precedence table
Task Name Predecessors
Clinic Management System
Project Planning
Initiation Meeting
Gather Project requirements 3
Develop a project plan 3
System Analysis and Design 2
Design the system 4
Design database schemas 4
Develop an SDD 8
Project Implementation 6
Code the application 7
Perform unit testing 11
Perform complete system testing 12
Develop system documentation 11
Deploy the system 13
User Training 10
Train system end users 15,9
Live system training with users 17
Project Closure 16
Evaluate the project 18,14
Document lessons learnt 20
Project Sign-offs 21
Close the project 22
⊘ This is a preview!⊘
Do you want full access?
Subscribe today to unlock all pages.
Trusted by 1+ million students worldwide
Risk Management Plan 7
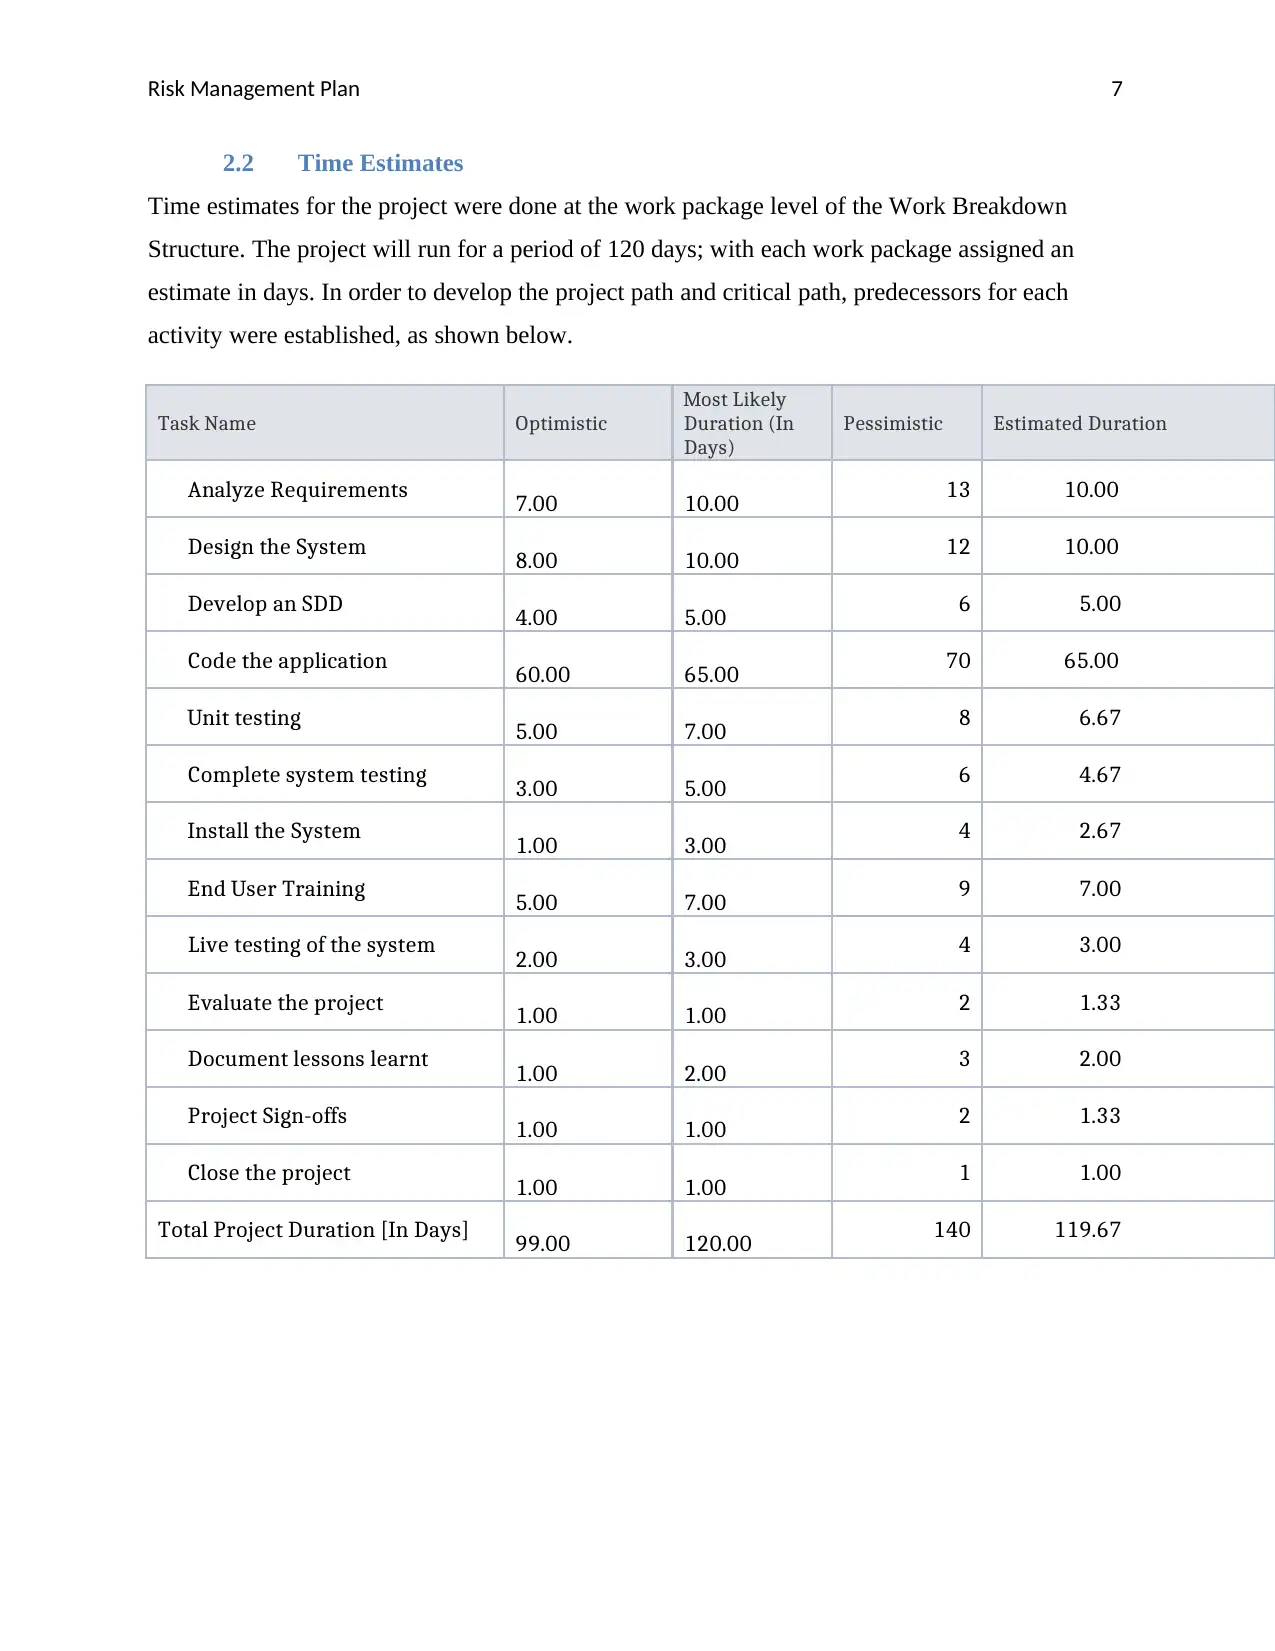
2.2 Time Estimates
Time estimates for the project were done at the work package level of the Work Breakdown
Structure. The project will run for a period of 120 days; with each work package assigned an
estimate in days. In order to develop the project path and critical path, predecessors for each
activity were established, as shown below.
Task Name Optimistic
Most Likely
Duration (In
Days)
Pessimistic Estimated Duration
Analyze Requirements 7.00 10.00 13 10.00
Design the System 8.00 10.00 12 10.00
Develop an SDD 4.00 5.00 6 5.00
Code the application 60.00 65.00 70 65.00
Unit testing 5.00 7.00 8 6.67
Complete system testing 3.00 5.00 6 4.67
Install the System 1.00 3.00 4 2.67
End User Training 5.00 7.00 9 7.00
Live testing of the system 2.00 3.00 4 3.00
Evaluate the project 1.00 1.00 2 1.33
Document lessons learnt 1.00 2.00 3 2.00
Project Sign-offs 1.00 1.00 2 1.33
Close the project 1.00 1.00 1 1.00
Total Project Duration [In Days] 99.00 120.00 140 119.67
Paraphrase This Document
Need a fresh take? Get an instant paraphrase of this document with our AI Paraphraser
Risk Management Plan 8
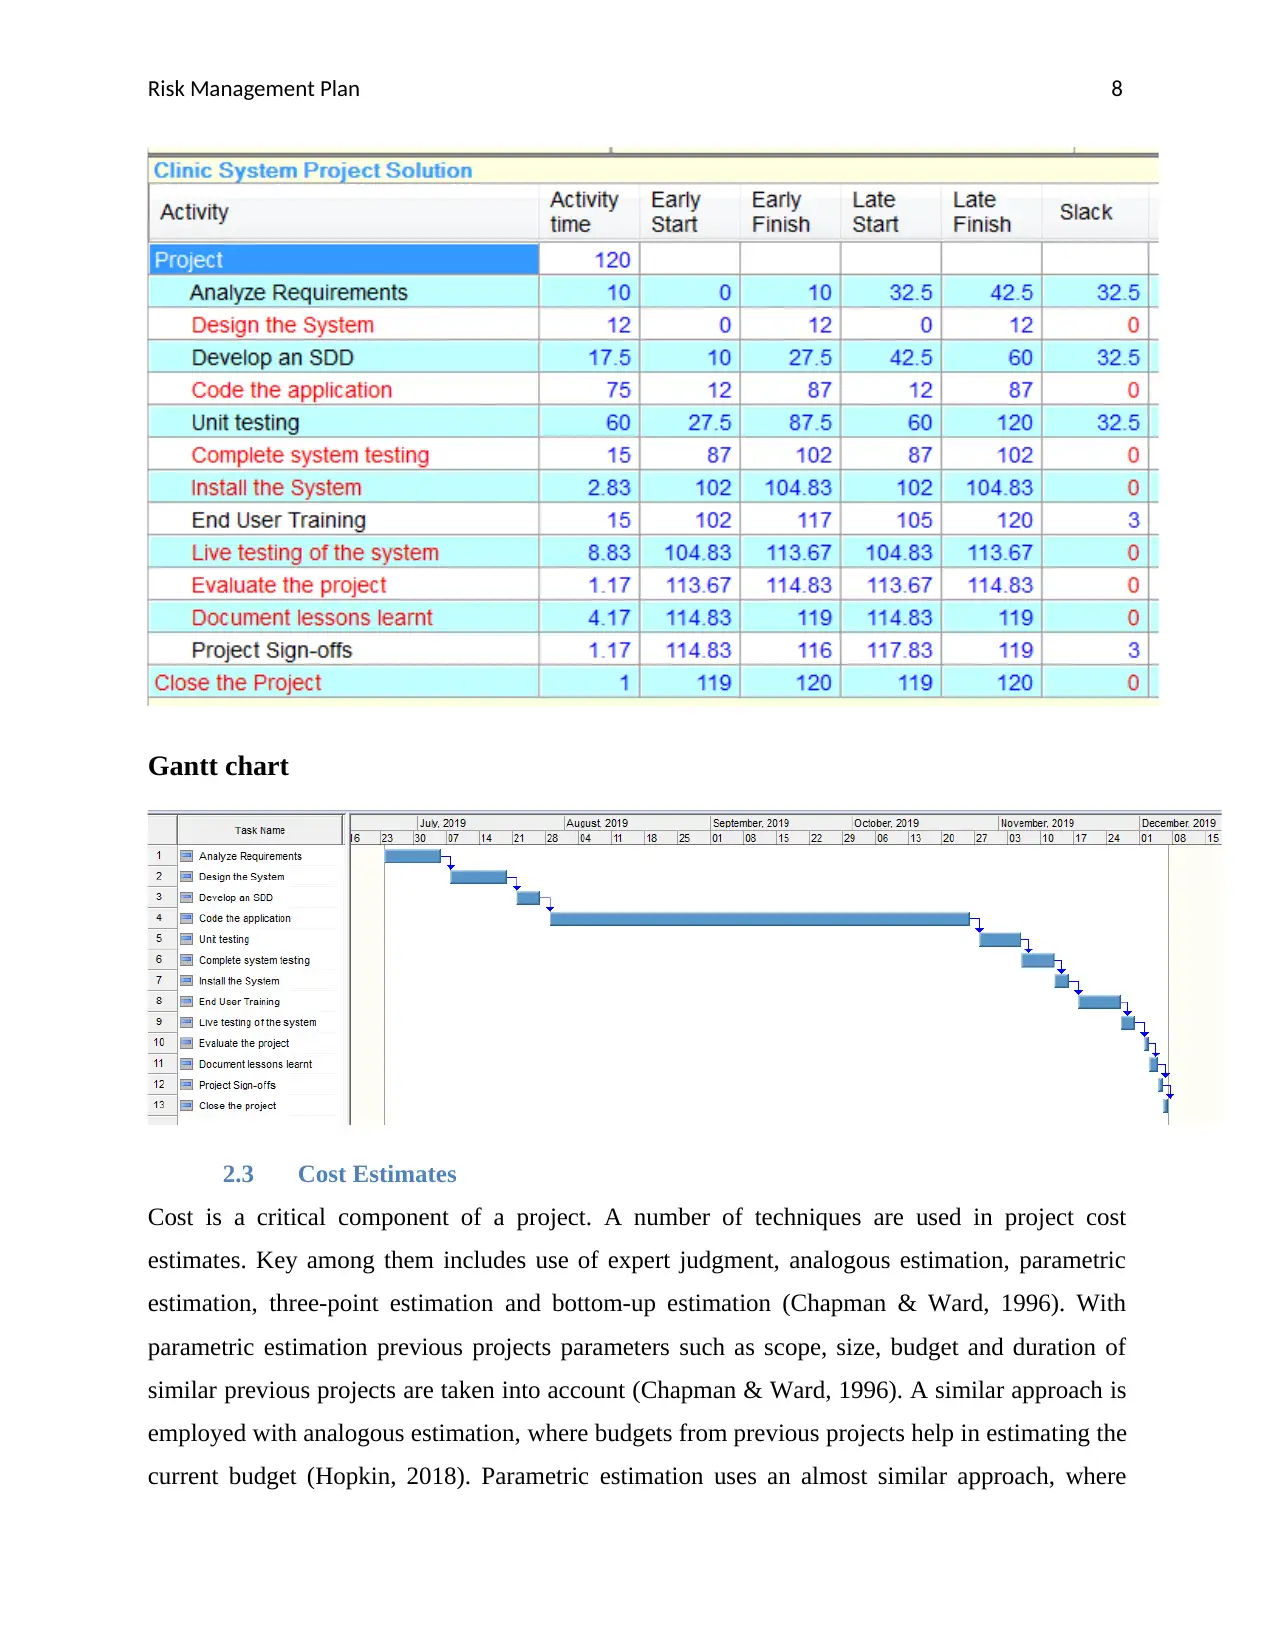
Gantt chart
2.3 Cost Estimates
Cost is a critical component of a project. A number of techniques are used in project cost
estimates. Key among them includes use of expert judgment, analogous estimation, parametric
estimation, three-point estimation and bottom-up estimation (Chapman & Ward, 1996). With
parametric estimation previous projects parameters such as scope, size, budget and duration of
similar previous projects are taken into account (Chapman & Ward, 1996). A similar approach is
employed with analogous estimation, where budgets from previous projects help in estimating the
current budget (Hopkin, 2018). Parametric estimation uses an almost similar approach, where
Risk Management Plan 9
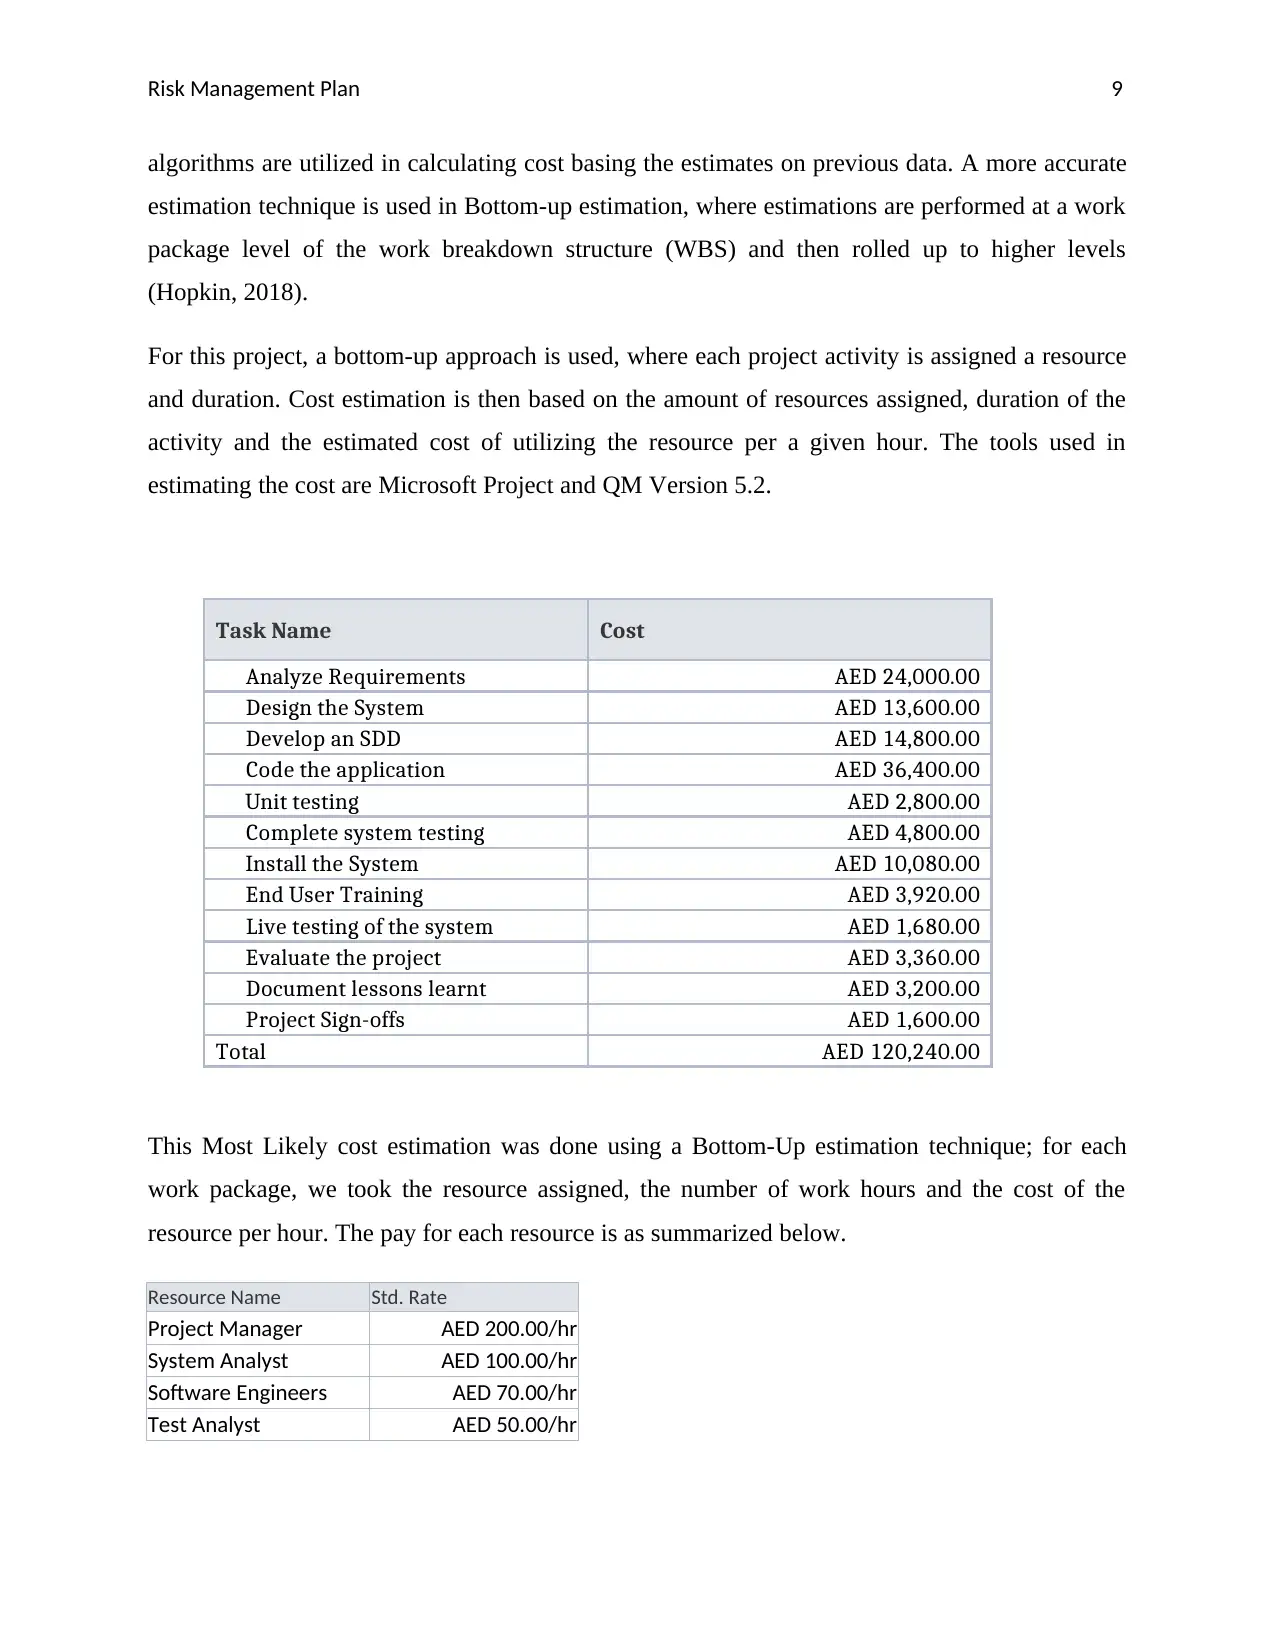
algorithms are utilized in calculating cost basing the estimates on previous data. A more accurate
estimation technique is used in Bottom-up estimation, where estimations are performed at a work
package level of the work breakdown structure (WBS) and then rolled up to higher levels
(Hopkin, 2018).
For this project, a bottom-up approach is used, where each project activity is assigned a resource
and duration. Cost estimation is then based on the amount of resources assigned, duration of the
activity and the estimated cost of utilizing the resource per a given hour. The tools used in
estimating the cost are Microsoft Project and QM Version 5.2.
Task Name Cost
Analyze Requirements AED 24,000.00
Design the System AED 13,600.00
Develop an SDD AED 14,800.00
Code the application AED 36,400.00
Unit testing AED 2,800.00
Complete system testing AED 4,800.00
Install the System AED 10,080.00
End User Training AED 3,920.00
Live testing of the system AED 1,680.00
Evaluate the project AED 3,360.00
Document lessons learnt AED 3,200.00
Project Sign-offs AED 1,600.00
Total AED 120,240.00
This Most Likely cost estimation was done using a Bottom-Up estimation technique; for each
work package, we took the resource assigned, the number of work hours and the cost of the
resource per hour. The pay for each resource is as summarized below.
Resource Name Std. Rate
Project Manager AED 200.00/hr
System Analyst AED 100.00/hr
Software Engineers AED 70.00/hr
Test Analyst AED 50.00/hr
⊘ This is a preview!⊘
Do you want full access?
Subscribe today to unlock all pages.
Trusted by 1+ million students worldwide
Risk Management Plan 10
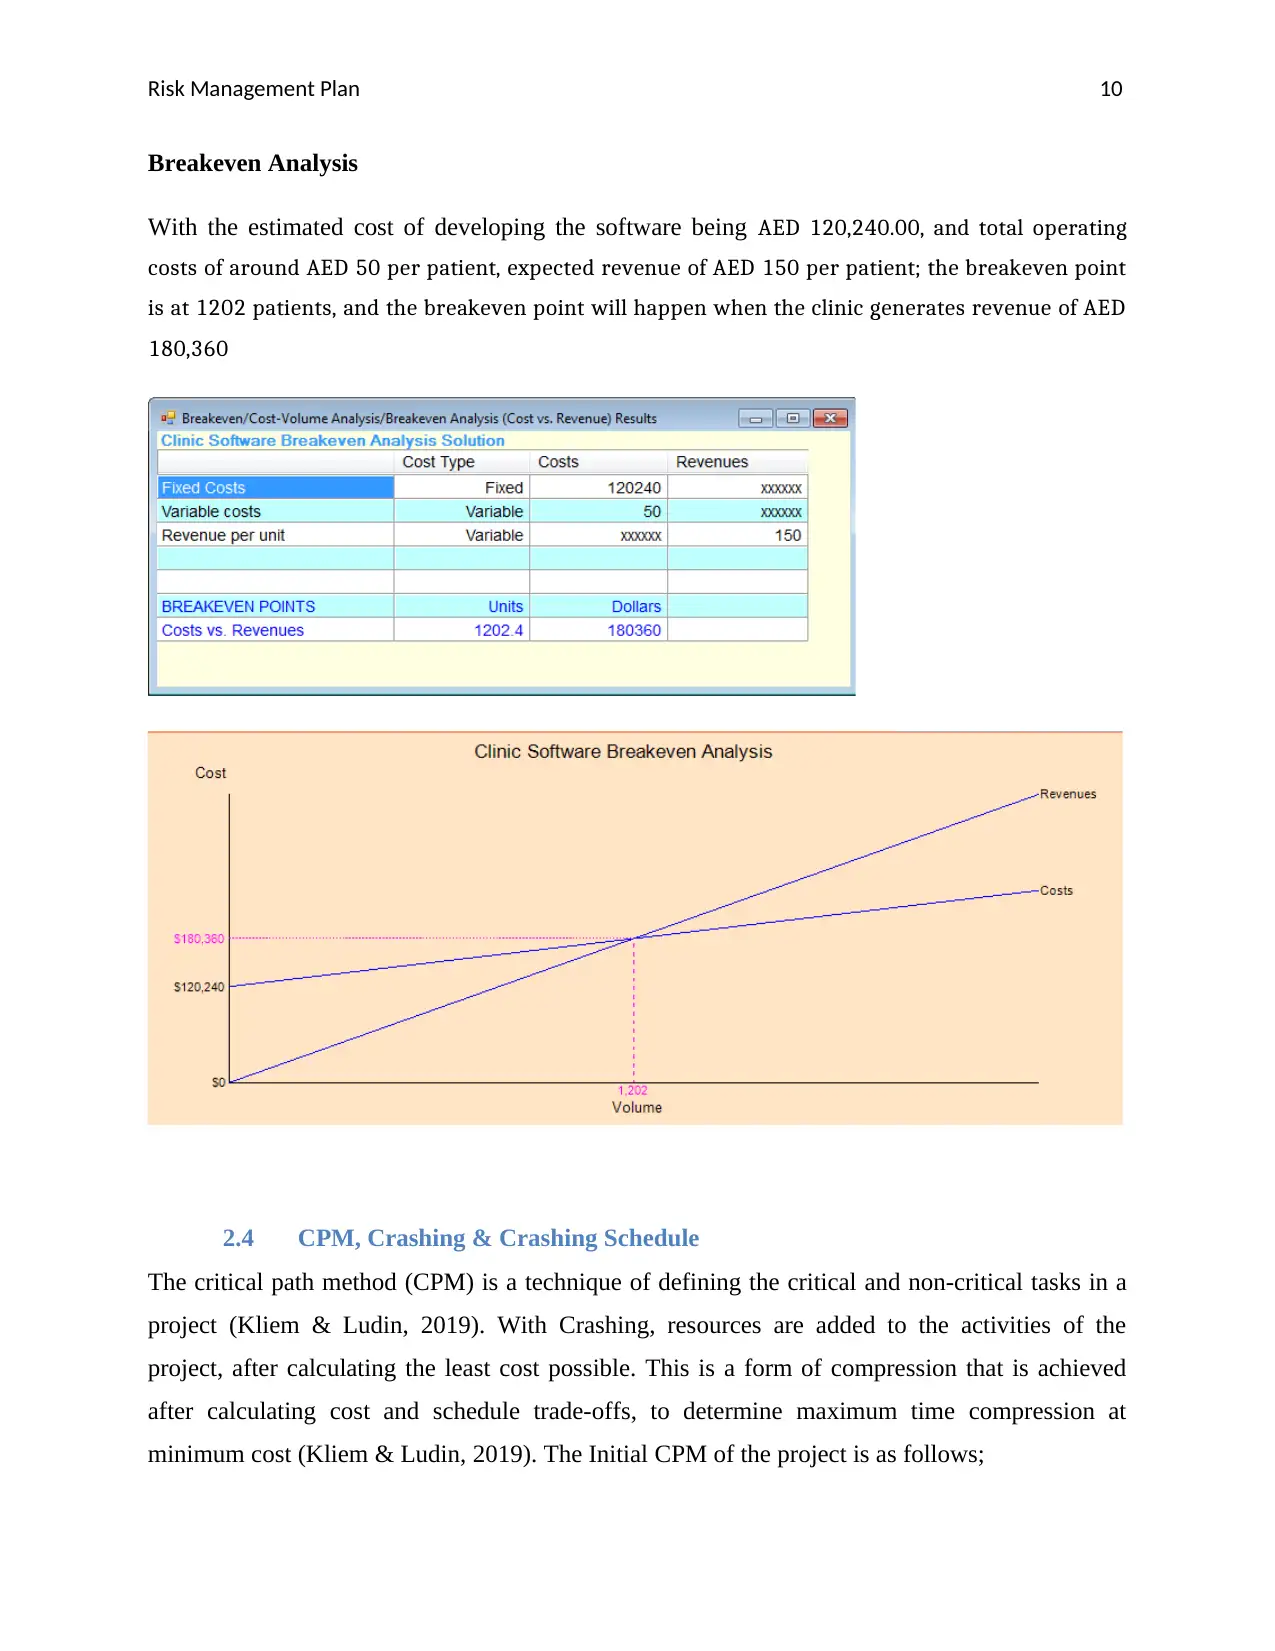
Breakeven Analysis
With the estimated cost of developing the software being AED 120,240.00, and total operating
costs of around AED 50 per patient, expected revenue of AED 150 per patient; the breakeven point
is at 1202 patients, and the breakeven point will happen when the clinic generates revenue of AED
180,360
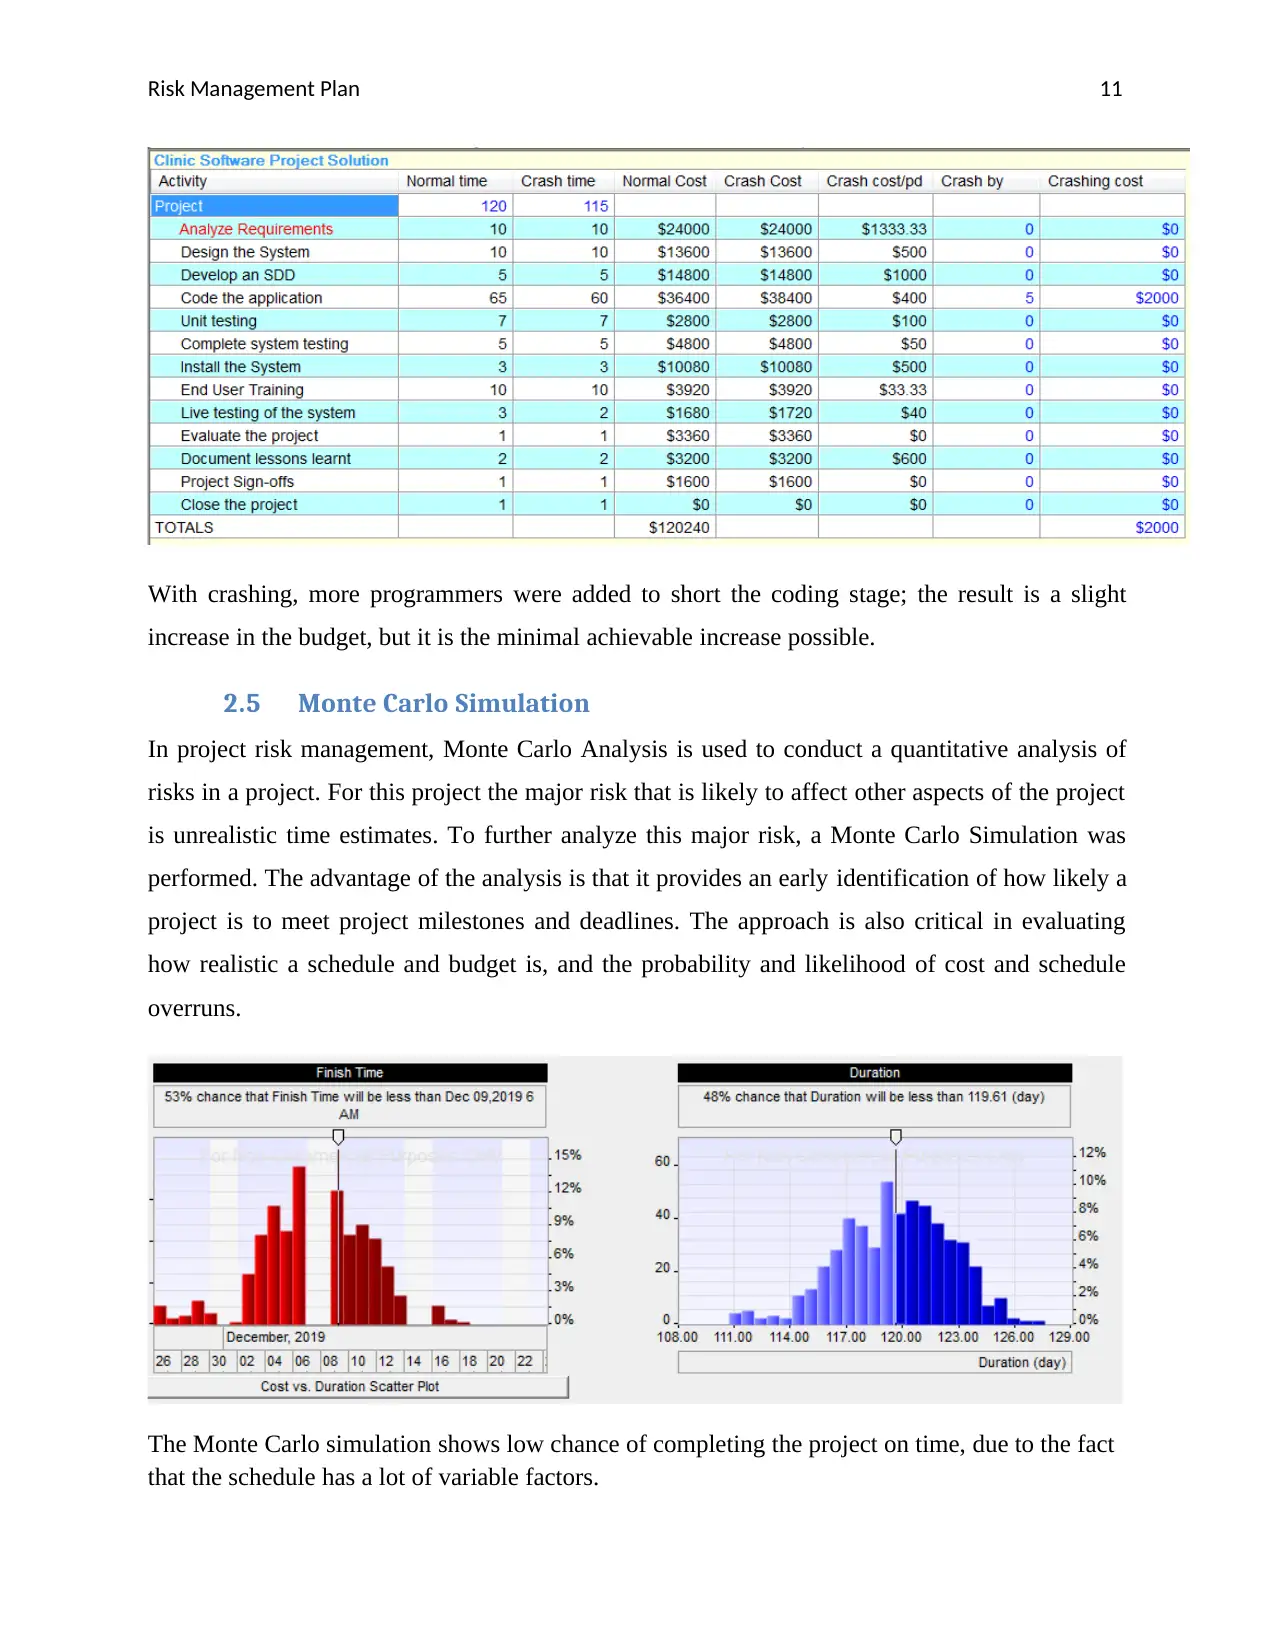
2.4 CPM, Crashing & Crashing Schedule
The critical path method (CPM) is a technique of defining the critical and non-critical tasks in a
project (Kliem & Ludin, 2019). With Crashing, resources are added to the activities of the
project, after calculating the least cost possible. This is a form of compression that is achieved
after calculating cost and schedule trade-offs, to determine maximum time compression at
minimum cost (Kliem & Ludin, 2019). The Initial CPM of the project is as follows;
Breakeven Analysis
With the estimated cost of developing the software being AED 120,240.00, and total operating
costs of around AED 50 per patient, expected revenue of AED 150 per patient; the breakeven point
is at 1202 patients, and the breakeven point will happen when the clinic generates revenue of AED
180,360
2.4 CPM, Crashing & Crashing Schedule
The critical path method (CPM) is a technique of defining the critical and non-critical tasks in a
project (Kliem & Ludin, 2019). With Crashing, resources are added to the activities of the
project, after calculating the least cost possible. This is a form of compression that is achieved
after calculating cost and schedule trade-offs, to determine maximum time compression at
minimum cost (Kliem & Ludin, 2019). The Initial CPM of the project is as follows;
Paraphrase This Document
Need a fresh take? Get an instant paraphrase of this document with our AI Paraphraser
Risk Management Plan 11
With crashing, more programmers were added to short the coding stage; the result is a slight
increase in the budget, but it is the minimal achievable increase possible.
2.5 Monte Carlo Simulation
In project risk management, Monte Carlo Analysis is used to conduct a quantitative analysis of
risks in a project. For this project the major risk that is likely to affect other aspects of the project
is unrealistic time estimates. To further analyze this major risk, a Monte Carlo Simulation was
performed. The advantage of the analysis is that it provides an early identification of how likely a
project is to meet project milestones and deadlines. The approach is also critical in evaluating
how realistic a schedule and budget is, and the probability and likelihood of cost and schedule
overruns.
The Monte Carlo simulation shows low chance of completing the project on time, due to the fact
that the schedule has a lot of variable factors.
Risk Management Plan 12
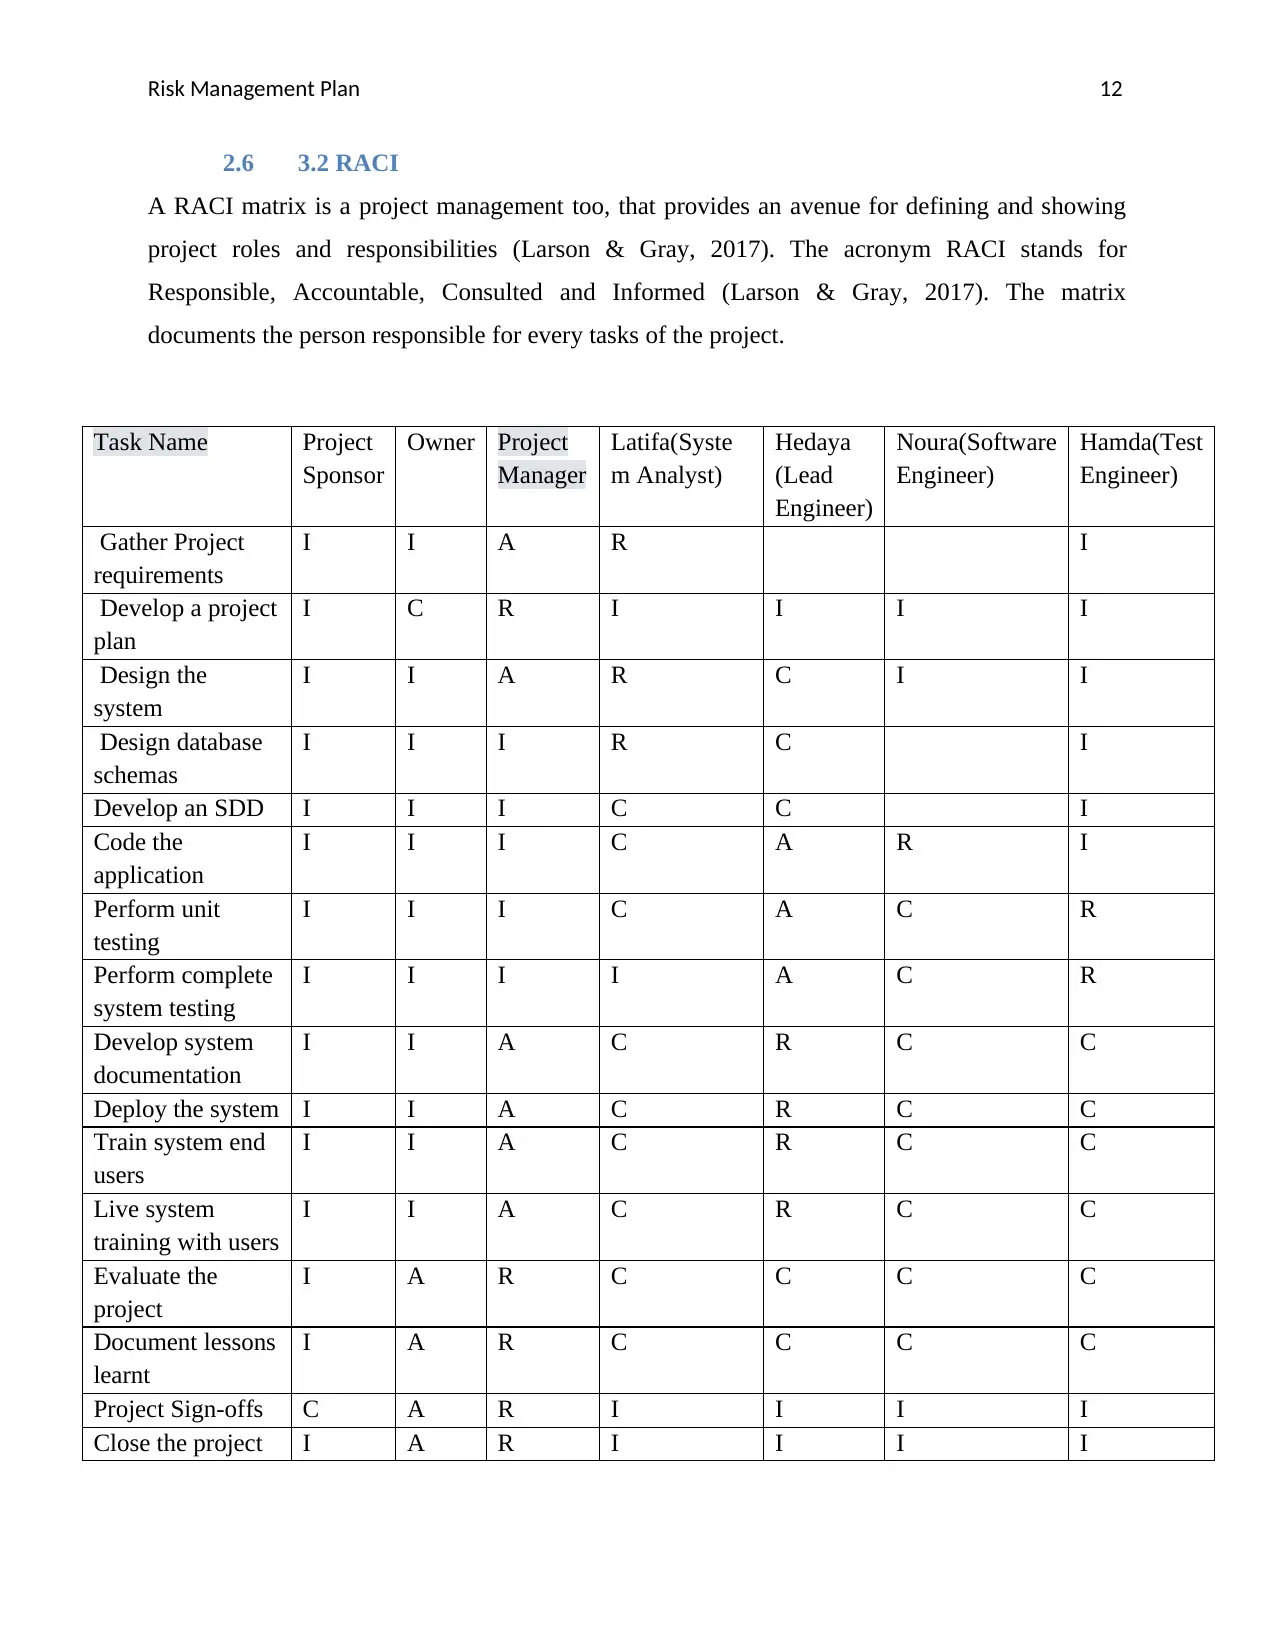
2.6 3.2 RACI
A RACI matrix is a project management too, that provides an avenue for defining and showing
project roles and responsibilities (Larson & Gray, 2017). The acronym RACI stands for
Responsible, Accountable, Consulted and Informed (Larson & Gray, 2017). The matrix
documents the person responsible for every tasks of the project.
Task Name Project
Sponsor
Owner Project
Manager
Latifa(Syste
m Analyst)
Hedaya
(Lead
Engineer)
Noura(Software
Engineer)
Hamda(Test
Engineer)
Gather Project
requirements
I I A R I
Develop a project
plan
I C R I I I I
Design the
system
I I A R C I I
Design database
schemas
I I I R C I
Develop an SDD I I I C C I
Code the
application
I I I C A R I
Perform unit
testing
I I I C A C R
Perform complete
system testing
I I I I A C R
Develop system
documentation
I I A C R C C
Deploy the system I I A C R C C
Train system end
users
I I A C R C C
Live system
training with users
I I A C R C C
Evaluate the
project
I A R C C C C
Document lessons
learnt
I A R C C C C
Project Sign-offs C A R I I I I
Close the project I A R I I I I
⊘ This is a preview!⊘
Do you want full access?
Subscribe today to unlock all pages.
Trusted by 1+ million students worldwide
1 out of 23
Related Documents


Your All-in-One AI-Powered Toolkit for Academic Success.
+13062052269
info@desklib.com
Available 24*7 on WhatsApp / Email
![[object Object]](/_next/static/media/star-bottom.7253800d.svg)
Unlock your academic potential
Copyright © 2020–2026 A2Z Services. All Rights Reserved. Developed and managed by ZUCOL.