Analysis and Forecasting of Clock House Station Usage Over 10 Years
VerifiedAdded on 2021/01/02
|9
|1440
|423
Report
AI Summary
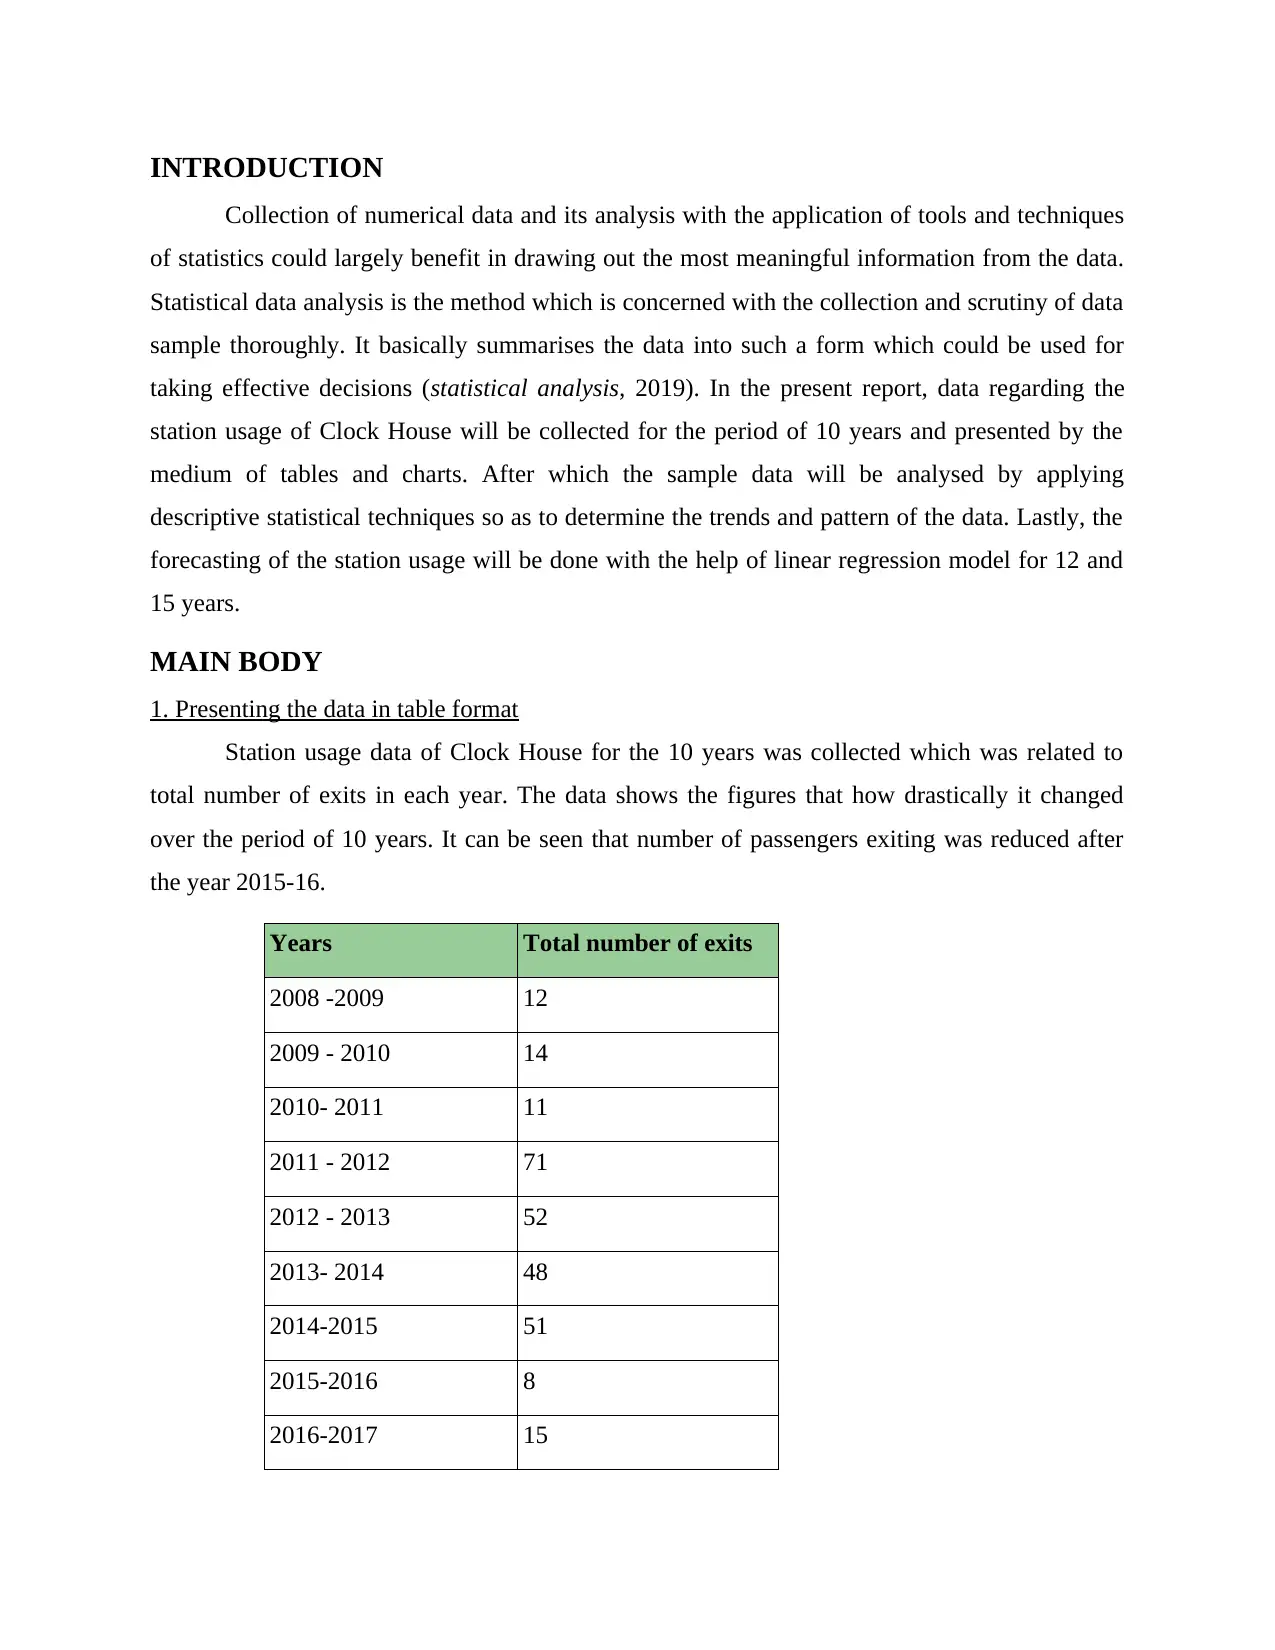
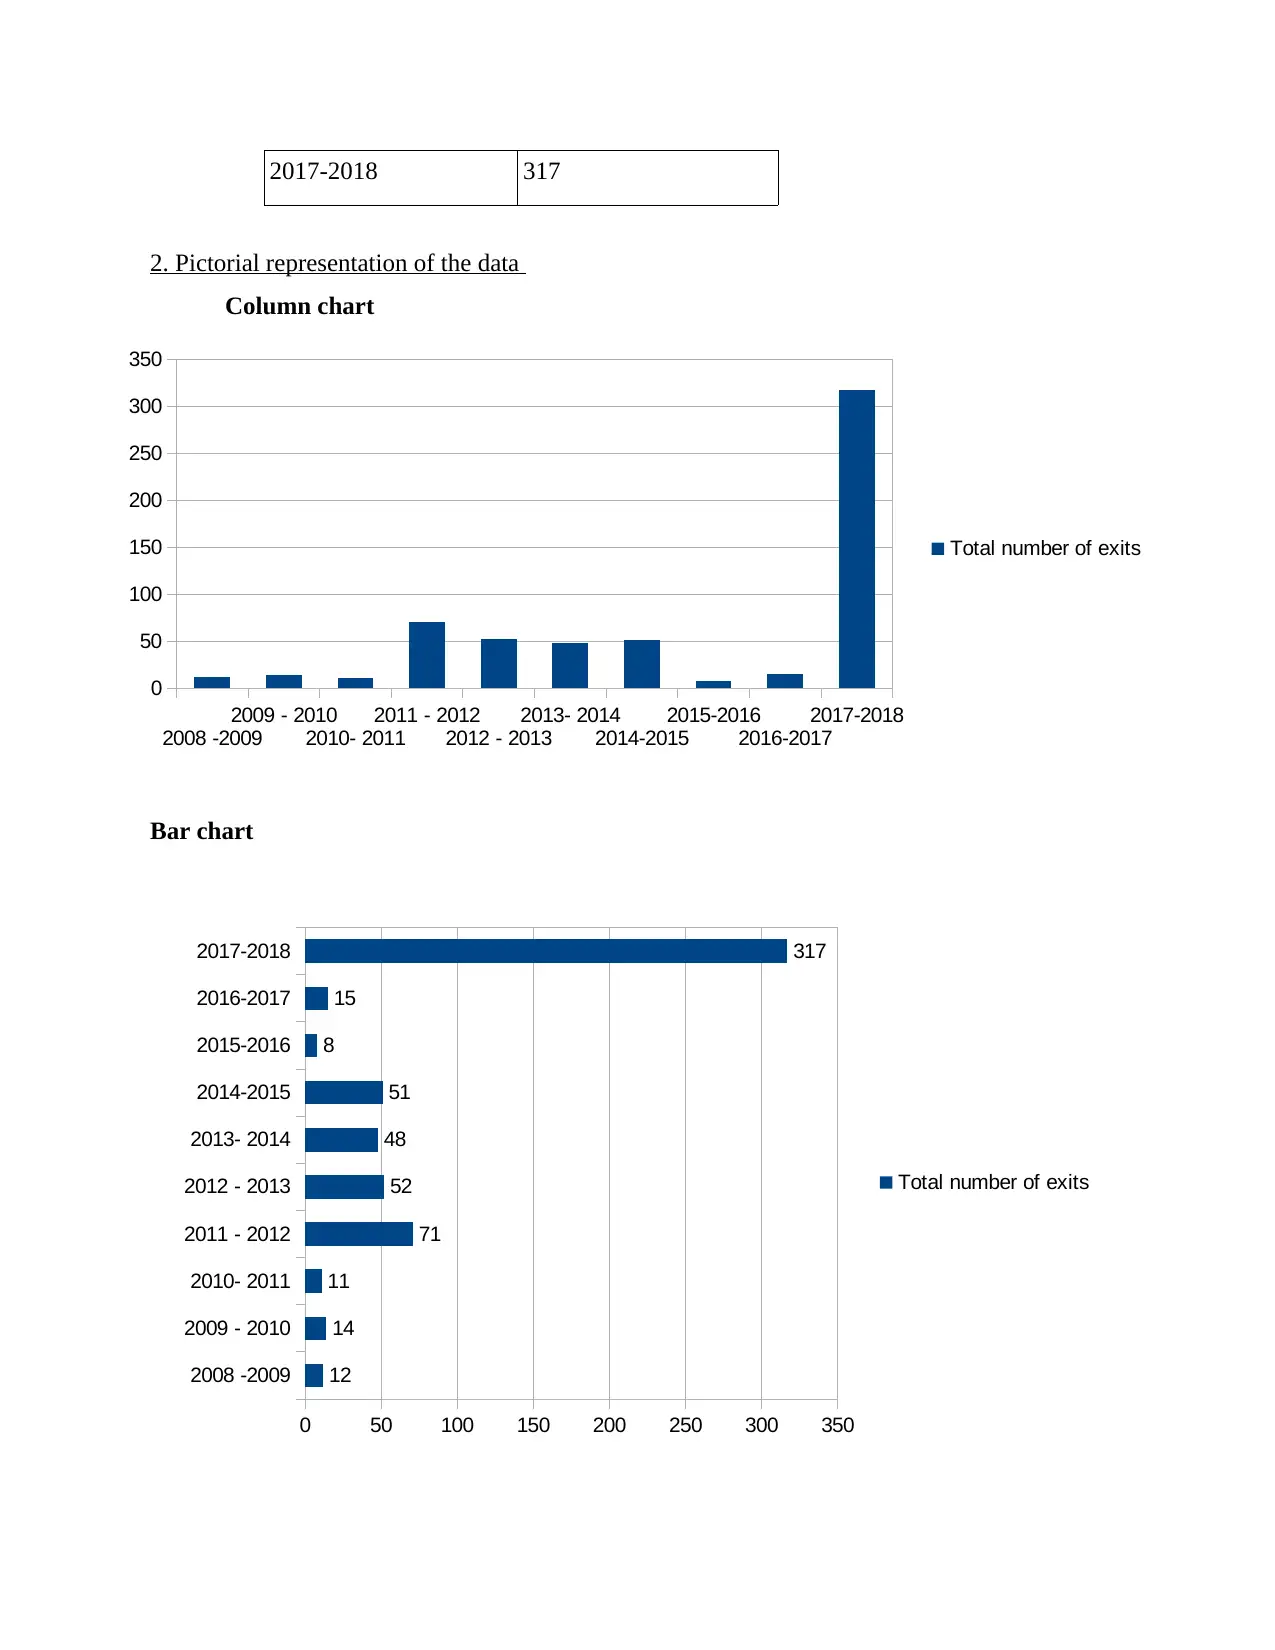
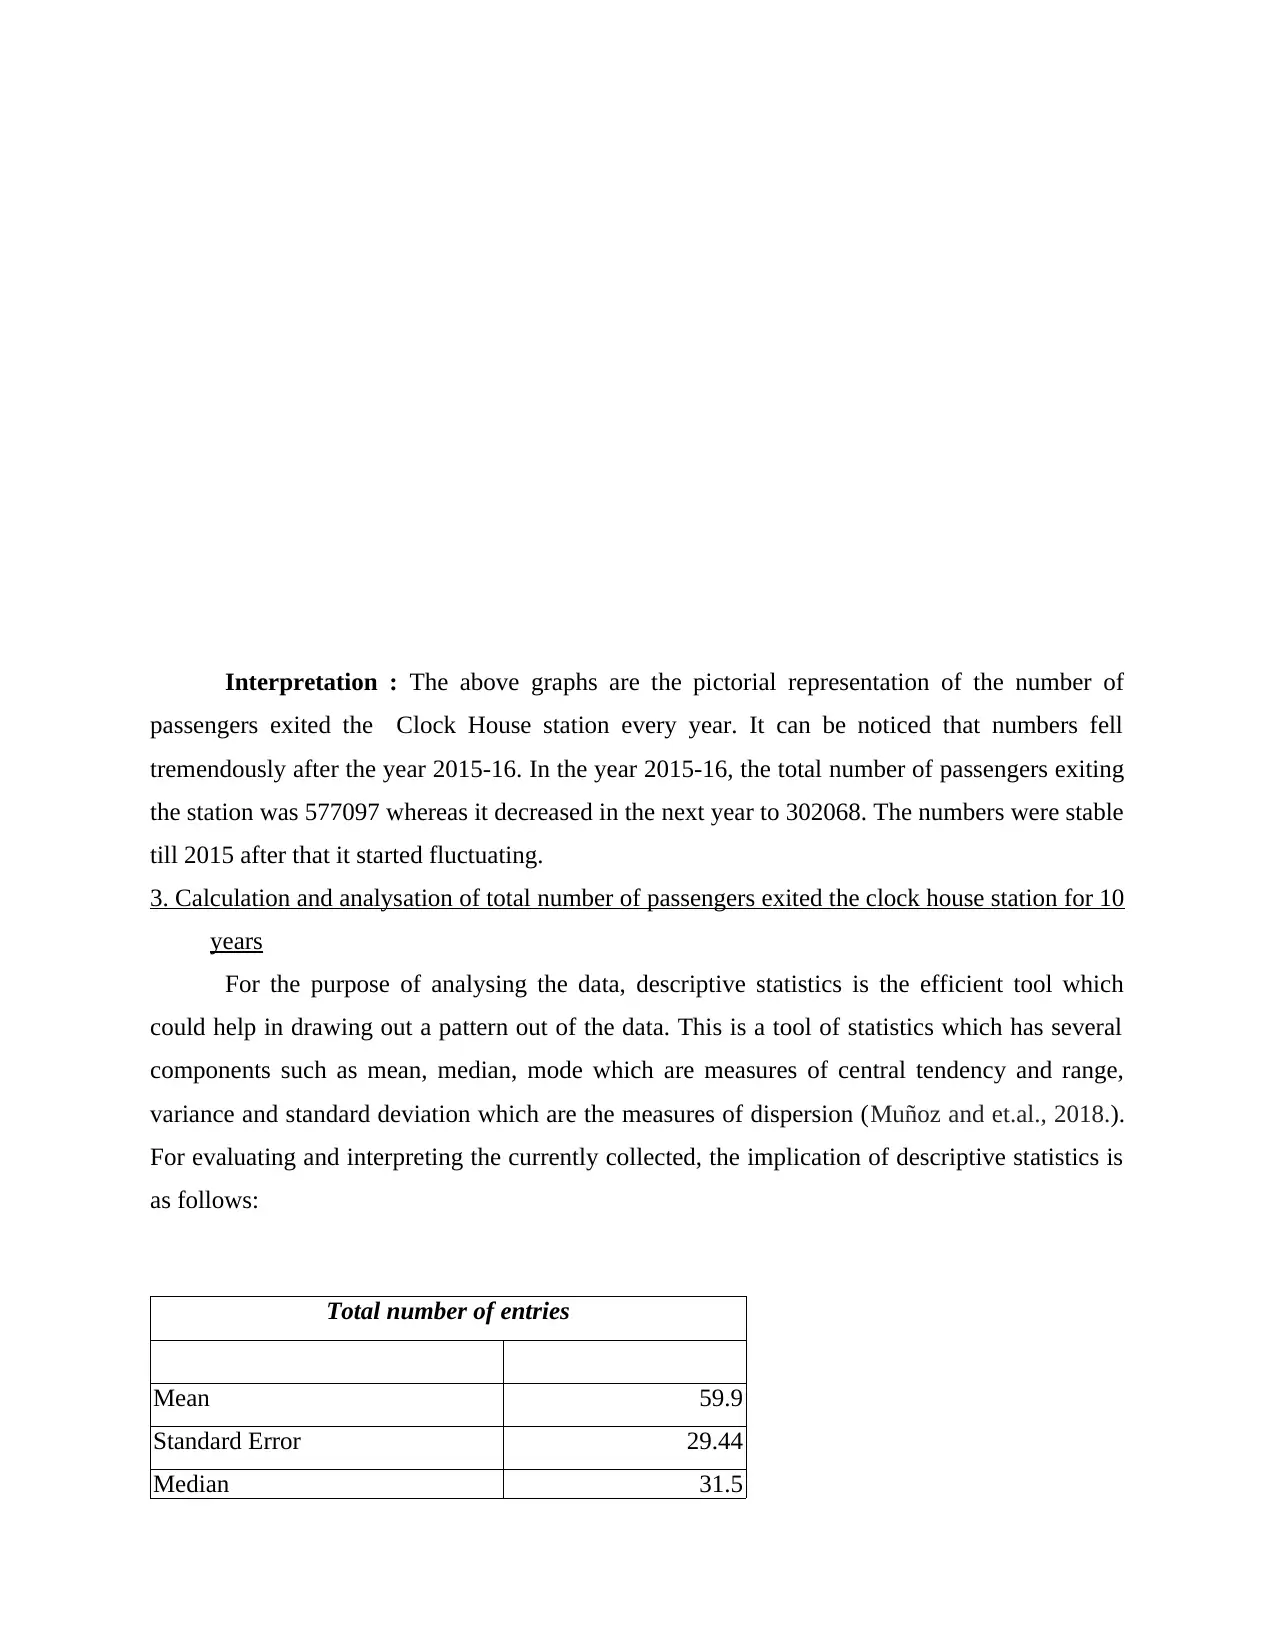
This report presents an analysis of Clock House station usage data collected over a 10-year period. The study begins with the presentation of the data in both tabular and pictorial formats, allowing for a clear visualization of passenger trends. Descriptive statistical techniques, including mean, median, mode, range, and standard deviation, are then applied to the data to identify patterns and key characteristics of station usage. Finally, a linear forecasting model is employed to predict station usage for the upcoming 12 and 15 years. The findings reveal insights into historical trends and provide estimated future passenger numbers, offering valuable information for station management and planning. The report concludes that descriptive statistical tools and techniques are of great help for the purpose of evaluating and analysing the data.
1 out of 9
Related Documents


Your All-in-One AI-Powered Toolkit for Academic Success.
+13062052269
info@desklib.com
Available 24*7 on WhatsApp / Email
![[object Object]](/_next/static/media/star-bottom.7253800d.svg)
Copyright © 2020–2026 A2Z Services. All Rights Reserved. Developed and managed by ZUCOL.