CO2222: Network Performance Analysis with Ping, Traceroute & MTU
VerifiedAdded on 2023/05/28
|26
|3918
|188
Report
AI Summary
This report provides a detailed analysis of network performance using ping and traceroute utilities, along with an investigation into Maximum Transmission Unit (MTU) size. The report begins with an introduction to computer information systems and the significance of network performance, detailing the features, operation, and utility of both ping and traceroute in network analysis. It outlines how ping is used to detect IP address accessibility, test connection speeds, and measure data packet travel time, while traceroute identifies the routes taken by data packets, the number of hops, and the time taken per hop. The report includes experimental results for MTU size determination, RTT (Round Trip Time) versus distance analysis for various websites, and Wireshark analysis, providing insights into network delays and congestion. The analysis includes scatter graphs, trendlines, and correlation calculations to illustrate the relationship between RTT and distance, concluding with key findings and references. This document is available on Desklib, a platform offering study tools and resources for students.

1
Computer Information System
COMPUTER INFORMATION SYSTEM
By (Student names)
[Course Name]
[Lecture Name]
[University Name]
[City where the university is located]
[Date]
Computer Information System
COMPUTER INFORMATION SYSTEM
By (Student names)
[Course Name]
[Lecture Name]
[University Name]
[City where the university is located]
[Date]
Paraphrase This Document
Need a fresh take? Get an instant paraphrase of this document with our AI Paraphraser
2
Computer Information System
Table of Contents
1 Introduction.........................................................................................................................................3
1.1 Ping and traceroute.....................................................................................................................3
1.1.1 Ping......................................................................................................................................3
1.1.2 Traceroute...........................................................................................................................4
2 MTU Size..............................................................................................................................................6
2.1 Method.........................................................................................................................................6
2.1.1 Requirements.......................................................................................................................6
2.1.2 Instructions..........................................................................................................................6
2.2 Results.........................................................................................................................................7
2.3 Analysis........................................................................................................................................8
3 RTT vs Distance....................................................................................................................................9
3.1 Method.........................................................................................................................................9
3.2 Results.......................................................................................................................................10
3.3 Analysis.....................................................................................................................................10
3.3.1 The XY (Scatter) Graph showing the relationship between RTT and distance....................10
3.3.2 Trendline (RTTs vs Distance Trend line).............................................................................11
3.3.3 Calculated correlation between RTT and distance.............................................................11
4 Traceroute.........................................................................................................................................12
4.1 Method......................................................................................................................................12
4.2 Results.......................................................................................................................................12
4.3 Analysis.....................................................................................................................................15
5 Wireshark..........................................................................................................................................15
5.1 Installation.................................................................................................................................15
5.2 Operation...................................................................................................................................22
5.3 Results.......................................................................................................................................22
5.4 Analysis.....................................................................................................................................24
6 Conclusions........................................................................................................................................24
Reference..................................................................................................................................................25
3
Computer Information System
1 Introduction
In the information technology there are various technological aspects that are used in the various
organizations to facilitate the communication and the management of the data and this is enabled
by use of the computer networking where various computer devices are interlinked together in
order to facilitate the communication between those devices.
The performance of the computer network is considered as one of the major aspect to be
considered in any organization, and therefore the network need to be tested and analyzed of its
performance or troubleshot in order to detect any possible cause of network failure.
The network analysis is done using network analysis tools which include the ping and traceroute
as described here below of their features, operations, performance and utilities.
1.1 Ping and traceroute
The ping and traceroute are the major software applications that are used in the testing of the
internet connectivity and also are used in the diagnosis of the computers congestions and finding
of the required destination computer to be reached.
The data transmission over the network or internet is done through the transmission of data
blocks called as data packets where the transmitted message is split into packets before sending
as individual packets and all can follow same or different route to their destinations and after
arriving destination the packets are converted to the initial message.
In some cases during sending or receiving data over internet there are timeouts or web server
going down that prevents one from having access services or the required website, therefore the
ping and traceroute are two major software applications that are used to test internet connections,
and do the diagnosis of congestions between the computer/internet service provider and the
destination servers to be reached as discussed below.
1.1.1 Ping
The ping is a utility that is used by network analysts to determine whether the destination servers
are online and the possible time that can be taken by client computer to send and receive data
packet to destinations host servers.
⊘ This is a preview!⊘
Do you want full access?
Subscribe today to unlock all pages.
Trusted by 1+ million students worldwide
4
Computer Information System
1.1.1.1 Features
The ping is one of the network testing utilities and it have various features which includes the
following.
i. Able to detect if specific IP addresses are accessible or not.
ii. Able to send data packets to certain addresses and wait for replies.
iii. Able to troubleshoot internet connection easily.
iv. Able to test the connection speed between client device and servers.
v. It is able to tell the client time taken for data packet with 32 bytes to move from client
to server and back.
1.1.1.2 Operation of utilities
The ping is operated through sending of data packets to specific addresses and then to wait for
the replies. This utility is therefore used in troubleshooting of the internet connectivity using
various free wares and share wares ping utilities.
1.1.1.3 How used to analyze network performance
The ping utility is used to analyze the network using the windows computer where it is done
using various ways which includes the software applications or using the windows command
prompts, below is the process used to analyze the network performance using ping utility.
i. Go to windows start button.
ii. Choose all programs.
iii. Type MS DOS prompt/cmd.
iv. On the cmd prompt enter the destination server name e.g. ping yahoo.com.
1.1.2 Traceroute
The traceroute is a network utility tool that the network analysts use to determine the exact routes
taken to reach the servers from the client computer and the time taken by each hop.
1.1.2.1 Features
The traceroute being one of the network performances testing utility it has various features which
include the following.
Paraphrase This Document
Need a fresh take? Get an instant paraphrase of this document with our AI Paraphraser
5
Computer Information System
i. It is able to trace data packets from the client device to the internet hosts.
ii. It is able to show the number of hops required by the data packet to reach the
destination host.
iii. It is able to indicated time taken by each hop.
iv. Able to send data packets which has low time to live fields.
v. Able to determine the number of hops the data packet is allowed to have before it
returns using the TTL values.
vi. It is able to identify the last host the packet reaches incase the packet don’t reach the
destination.
vii. It is able to identify the intermediary hosts that the data packet pass through.
1.1.2.2 Operation of utilities
The traceroute utility is operated through the sending of the data packets which has low time to
live fields where the TTL values gives the specifications of the number of hops which the data
packet is allowed to pass through before it returns back to source.
However in cases where the data packets are not reaching destinations due to low TTL value the
last host return the data packet and then identify it.
The traceroute is able to identify the various intermediary hosts by sending of series of data
packets and also increment of the TTL value to each successive data packets.
1.1.2.3 How used to analyze network performance
The traceroute is a utility that is used to test the number of hops the network data packet takes
before reaching the destination host and also it determine the time taken by data packet in each
hop.
Below is the process used to analyze the network performance.
i. On the windows computer.
ii. Go to start menu.
iii. Choose all programs.
iv. Choose the MS DOS prompt.
v. Run the command prompt.
6
Computer Information System
vi. On the command prompt type tracert then destination server’s name or IP addresses
e.g. Tracert yahoo.com.
vii. If a hop returns “Request timed out” it indicates there is network congestions which
results to slow website loading and connections dropping.
2 MTU Size
The MTU refers to the maximum transmission unit which is the largest size of bytes in the IP
packets or frames that can be transmitted over internet or any other frame based network and
consists of IP headers and protocol headers which includes TCP/UDP or the data payload.
The MTU size is going to be determined below where the selected website is www.google.com.
2.1 Method
To be able to get the MTU size the following are done by setting up requirements and
instructions to be followed.
2.1.1 Requirements
i. Have a computer installed with windows operating system.
ii. Have internet access to the computer.
iii. Must be able to open and access the windows command prompts.
2.1.2 Instructions
The maximum size of the IP data payload the following steps are followed:
i. Open the command prompt on the windows computer that connects to google.com.
ii. Ping the google.com by use of doesn’t fragment option as follows.
Ping <web/IP address>–f –l <data size>
E.g. ping google.com –f –l 1500
iii. Reduce the data sizes and then repeat the commands in the (ii) step until when no
error will be displayed as follows.
E.g. ping google.com –f –l 1472.
⊘ This is a preview!⊘
Do you want full access?
Subscribe today to unlock all pages.
Trusted by 1+ million students worldwide
7
Computer Information System
iv. Then repeat all the above steps in order to get maximum data size that one can ping
without receiving any error.
v. Then calculate the differences between the standard and reduced data size.
E.g. 1500 bytes-1472 bytes=128 bytes (Tycho, 2014).
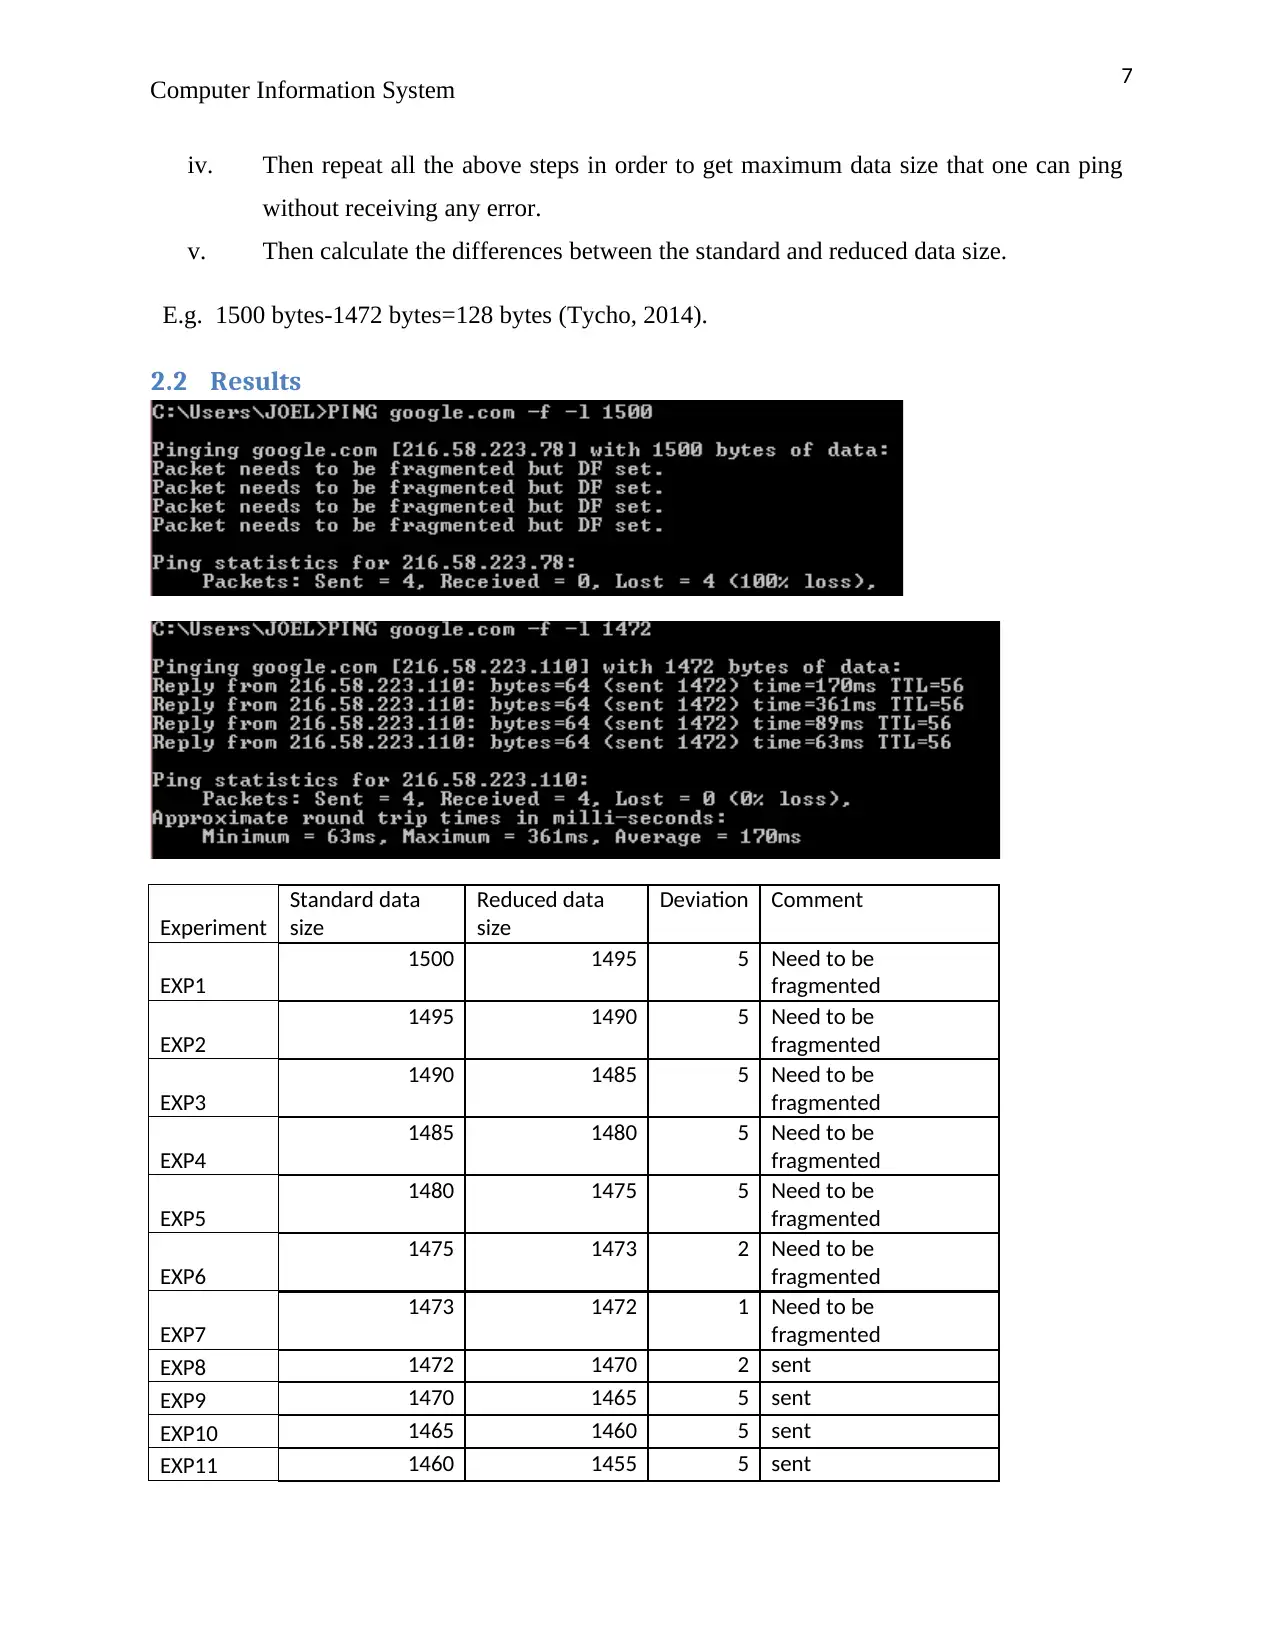
2.2 Results
Experiment
Standard data
size
Reduced data
size
Deviation Comment
EXP1
1500 1495 5 Need to be
fragmented
EXP2
1495 1490 5 Need to be
fragmented
EXP3
1490 1485 5 Need to be
fragmented
EXP4
1485 1480 5 Need to be
fragmented
EXP5
1480 1475 5 Need to be
fragmented
EXP6
1475 1473 2 Need to be
fragmented
EXP7
1473 1472 1 Need to be
fragmented
EXP8 1472 1470 2 sent
EXP9 1470 1465 5 sent
EXP10 1465 1460 5 sent
EXP11 1460 1455 5 sent
Computer Information System
iv. Then repeat all the above steps in order to get maximum data size that one can ping
without receiving any error.
v. Then calculate the differences between the standard and reduced data size.
E.g. 1500 bytes-1472 bytes=128 bytes (Tycho, 2014).
2.2 Results
Experiment
Standard data
size
Reduced data
size
Deviation Comment
EXP1
1500 1495 5 Need to be
fragmented
EXP2
1495 1490 5 Need to be
fragmented
EXP3
1490 1485 5 Need to be
fragmented
EXP4
1485 1480 5 Need to be
fragmented
EXP5
1480 1475 5 Need to be
fragmented
EXP6
1475 1473 2 Need to be
fragmented
EXP7
1473 1472 1 Need to be
fragmented
EXP8 1472 1470 2 sent
EXP9 1470 1465 5 sent
EXP10 1465 1460 5 sent
EXP11 1460 1455 5 sent
Paraphrase This Document
Need a fresh take? Get an instant paraphrase of this document with our AI Paraphraser
8
Computer Information System
EXP12 1455 1450 5 sent
EXP13 1450 1445 5 sent
EXP14 1445 1440 5 sent
EXP1
EXP2
EXP3
EXP4
EXP5
EXP6
EXP7
EXP8
EXP9
EXP10
EXP11
EXP12
EXP13
EXP14
1410
1420
1430
1440
1450
1460
1470
1480
1490
1500
1510
Standard data size
Standard data size
EXP1
EXP2
EXP3
EXP4
EXP5
EXP6
EXP7
EXP8
EXP9
EXP10
EXP11
EXP12
EXP13
EXP14
1410
1420
1430
1440
1450
1460
1470
1480
1490
1500
Reduced data size
(Dick, 2018).
2.3 Analysis
The above shows the results of the MTU size analysis where various data sizes were used , form
the results the maximum data size used was 1500 bytes which was not sent and it required to be
fragmented , the subsequent data sizes were sent and 1472 bytes was the first highest data size to
9
Computer Information System
be sent successfully without any data loss , however the subsequent reduced data sizes were also
sent and took lesser time than 1472 bytes data size , therefore the smaller the data size the faster
it gets transmitted.
3 RTT vs Distance
The RTT refers to the Round Trip time which is the duration which is measured in milliseconds
starting from the time the client computer browser send requests to the target server and the time
when it receives the response from the host server, it is therefore used as one of the main key
performance measure matrix for the web application (Michael, 2017).
The distance is the measure of how far the client computer is from the targeted host servers and
this can be obtained online, below is the method used in recording the RTT and distance records.
In this experiment the websites to be used are as follows.
i. http://www.uda.ad/ -Andorra
ii. http://www.aud.ac.in/ - India
iii. http://alhikmah.edu.ng/ -Nigeria
3.1 Method
To obtain the RTT and the distance the following steps are to be followed.
i. Open the command prompt on the windows computer that connects to the selected
websites.
ii. Ping the selected website by use of doesn’t fragment option as follows.
Ping <web/IP address>–f –l <data size>
E.g. ping uda.ad –f –l 1472
iii. Record the average RTT time.
iv. Repeat steps (ii) and (iii) for all other selected websites.
v. Open web browser (Specialist, 2018) .
vi. In the URL enter this link : http://www.indo.com/distance/
vii. On the “From” text box enter the current location e.g. Chicago, IL
⊘ This is a preview!⊘
Do you want full access?
Subscribe today to unlock all pages.
Trusted by 1+ million students worldwide
10
Computer Information System
viii. On the “To” text box enter the website host server location e.g. Jakarta
ix. Click on the “look it up” button to get the distance
x. Record the distance on the table below.
xi. Repeat steps (vii), (viii), (x) and (ix) for all selected websites.
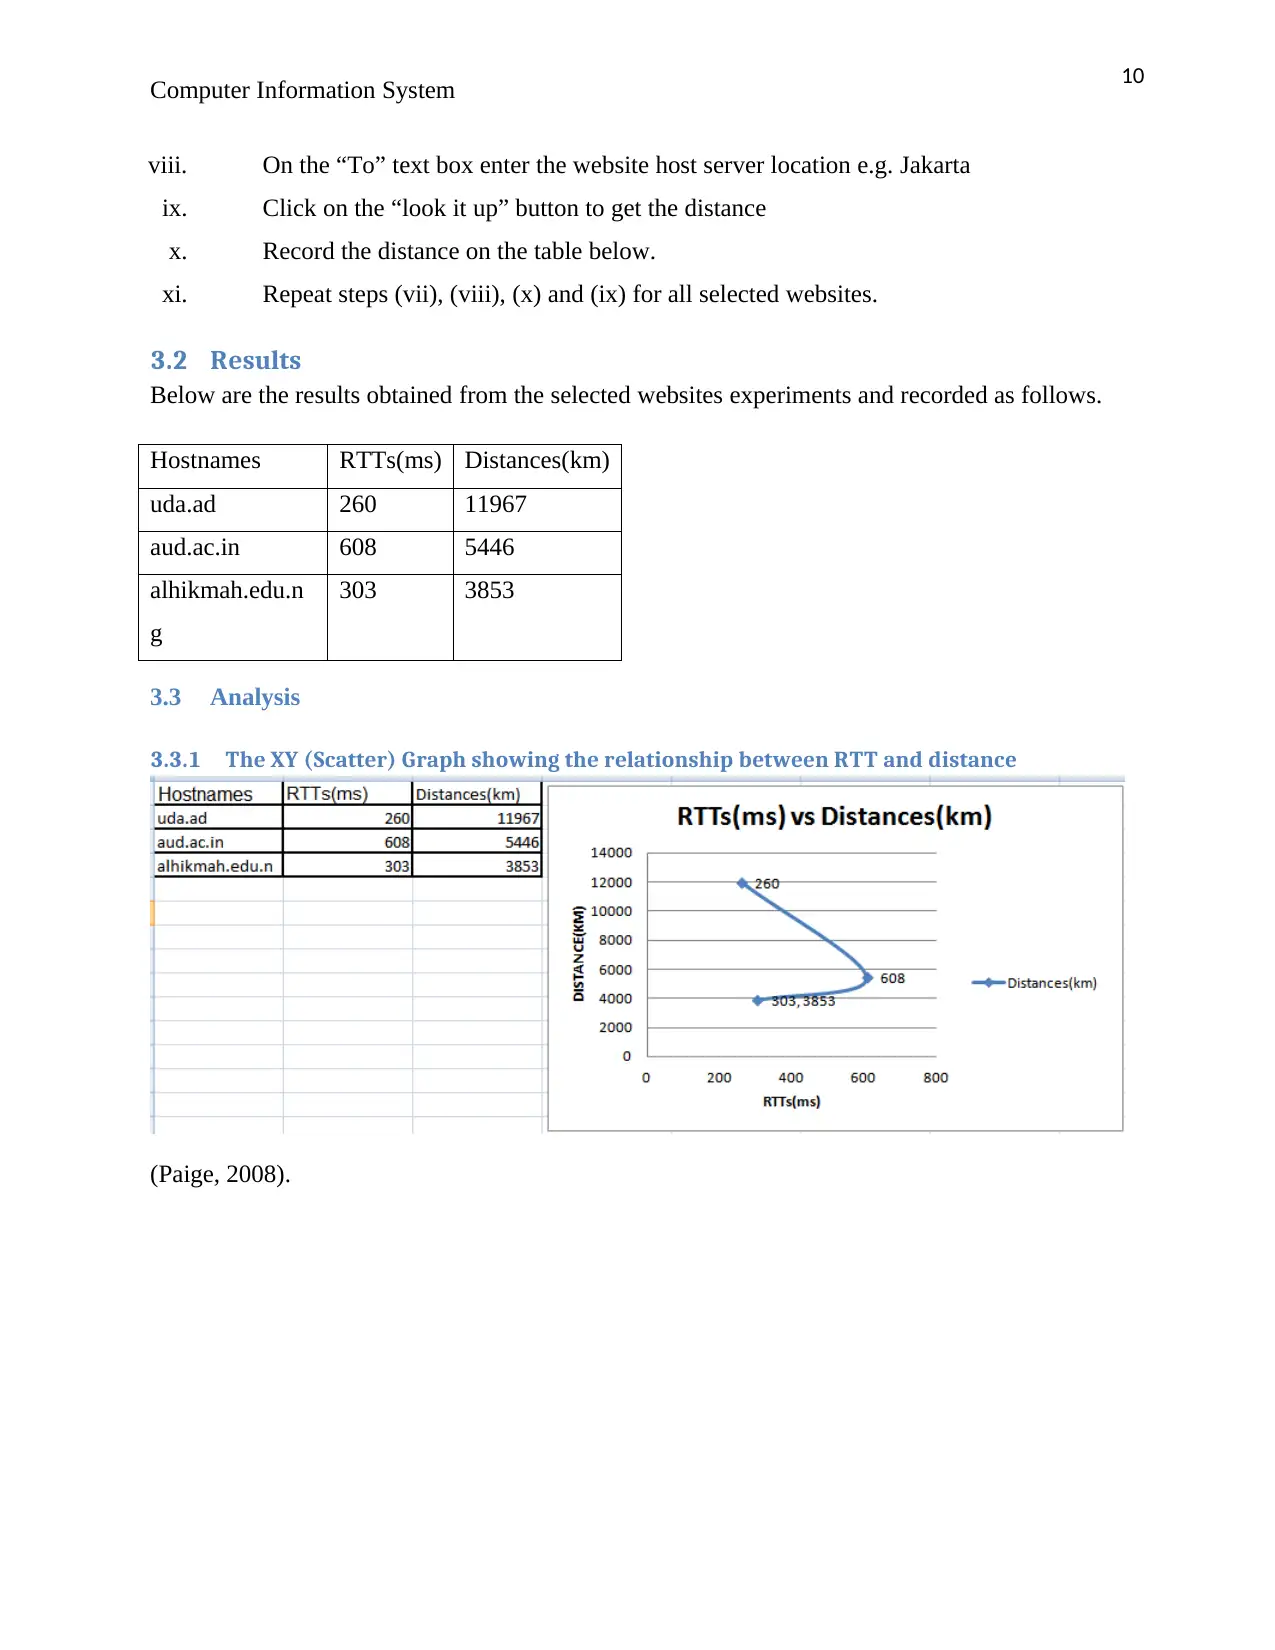
3.2 Results
Below are the results obtained from the selected websites experiments and recorded as follows.
Hostnames RTTs(ms) Distances(km)
uda.ad 260 11967
aud.ac.in 608 5446
alhikmah.edu.n
g
303 3853
3.3 Analysis
3.3.1 The XY (Scatter) Graph showing the relationship between RTT and distance
(Paige, 2008).
Computer Information System
viii. On the “To” text box enter the website host server location e.g. Jakarta
ix. Click on the “look it up” button to get the distance
x. Record the distance on the table below.
xi. Repeat steps (vii), (viii), (x) and (ix) for all selected websites.
3.2 Results
Below are the results obtained from the selected websites experiments and recorded as follows.
Hostnames RTTs(ms) Distances(km)
uda.ad 260 11967
aud.ac.in 608 5446
alhikmah.edu.n
g
303 3853
3.3 Analysis
3.3.1 The XY (Scatter) Graph showing the relationship between RTT and distance
(Paige, 2008).
Paraphrase This Document
Need a fresh take? Get an instant paraphrase of this document with our AI Paraphraser
11
Computer Information System
3.3.2 Trendline (RTTs vs Distance Trend line)
uda.ad aud.ac.in alhikmah.edu.ng
0
2000
4000
6000
8000
10000
12000
14000
260 608 303
11967
5446
3853
RTTs vs Distance Trend line
Distances(km)
RTTs(ms)
3.3.3 Calculated correlation between RTT and distance
The correlation is calculated to show the relationship between the RTT and Distance where the
RTTs is not influenced by the change in distance, this is because the correlation coefficient is -
0.435703139 which is almost equal to zero as obtained from the below excel results and graphs.
0.5 1 1.5 2 2.5 3 3.5
0
2000
4000
6000
8000
10000
12000
14000
RTTs(ms)
Linear (RTTs(ms))
Distance(KM)
Linear (Distance(KM))
RTTs(ms)
Distsnce(km)
From the above analysis it is clear that the RTTs and the Distance do not correlates such that the
change in distance do not affect the change in RTTs, however there is likely hood of having a
positive correlation between the RTTs and other attributes like propagation, transmission and
12
Computer Information System
queuing delays when they change either positively or negatively unlike the change in distance
(Stephen, 2008).
4 Traceroute
4.1 Method
The traceroute is a utility tool used to obtain the various hops that the data packet follows to the
destination, however in this project the following steps are used to get the traceroute of the
various selected websites (Maeve, 2007).
i. Open the command prompt on the windows computer that connects to the selected
websites.
ii. Tracert the selected website by use of doesn’t fragment option as follows.
Tracert <web/IP address>
E.g. Tracert uda.ad
iii. Record the IP addresses, hostnames
iv. Open the web browser.
v. On the URL enter http://www.whois.net.
vi. On the Your Domain Starting Place text box enter the domain name
vii. Record the owner/location of the router in table (Karumanchi, 2012).
4.2 Results
Below are the results obtained from the traceroute and the owner of the hosts as recorded here
below.
Obtained from the following pings
i. Ping uda.ad.
⊘ This is a preview!⊘
Do you want full access?
Subscribe today to unlock all pages.
Trusted by 1+ million students worldwide
1 out of 26
Related Documents


Your All-in-One AI-Powered Toolkit for Academic Success.
+13062052269
info@desklib.com
Available 24*7 on WhatsApp / Email
![[object Object]](/_next/static/media/star-bottom.7253800d.svg)
Unlock your academic potential
Copyright © 2020–2026 A2Z Services. All Rights Reserved. Developed and managed by ZUCOL.