Managerial Finance Report: Coca-Cola Amatil Business Finance Overview
VerifiedAdded on 2022/11/13
|17
|2803
|84
Report
AI Summary
This report provides a comprehensive analysis of the financial activities of Coca-Cola Amatil, an ASX-listed company. It begins with an executive summary and introduction, followed by an examination of the company's risk profile, encompassing both systematic and unsystematic risks. The report then delves into the overall financial performance, including income statements, balance sheets, cash flow, and key financial ratios. A significant portion is dedicated to the time value of money, its importance, and its application to Coca-Cola Amatil's investments. Furthermore, the report explores the company's sources of finance, including debts and equity capital, and its payout policy, including dividend reinvestment plans. The analysis incorporates relevant financial theories and provides insights into the company's strategic decisions and financial health, supported by references to academic sources and company reports.
Running Head: Managerial Finance
Managerial Finance
[Type the document subtitle]
Laptop04011
[Pick the date]
Managerial Finance
[Type the document subtitle]
Laptop04011
[Pick the date]
Paraphrase This Document
Need a fresh take? Get an instant paraphrase of this document with our AI Paraphraser
Managerial Finance 1
Executive Summary
The below mentioned paper elaborates the theories about understanding business finance in
external environment. The paper relates to the business finance activities of the ASX listed
company Coca Cola along with the elaboration of various theories in the environment. The risk
profile, time value of money, sources of finance and payout policies are identified in the paper in
relation to various activities of the company Coca Cola Amatil. The financial analysis of the
company has been conducted to give proof to the theories stated in the environment. Further, it
should be noted that the time value of money is crucial in increasing the profitability of the
company in the business environment. The company has invested in various segments which are
expected to provide growth of the business in international environment. More information about
the business finance activities of the company Coca Cola Amatil are discussed below:
Managerial Finance 2
Contents
Introduction......................................................................................................................................3
Risk Profile......................................................................................................................................3
Overall Financial Performance........................................................................................................5
Income Statement........................................................................................................................5
Balance Sheet...............................................................................................................................6
Cash Flow....................................................................................................................................8
Financial Ratios...........................................................................................................................9
Time Value for Money..................................................................................................................12
Sources of Finance.........................................................................................................................13
Payout Policy.................................................................................................................................13
Conclusion.....................................................................................................................................14
References......................................................................................................................................15
⊘ This is a preview!⊘
Do you want full access?
Subscribe today to unlock all pages.
Trusted by 1+ million students worldwide
Managerial Finance 3
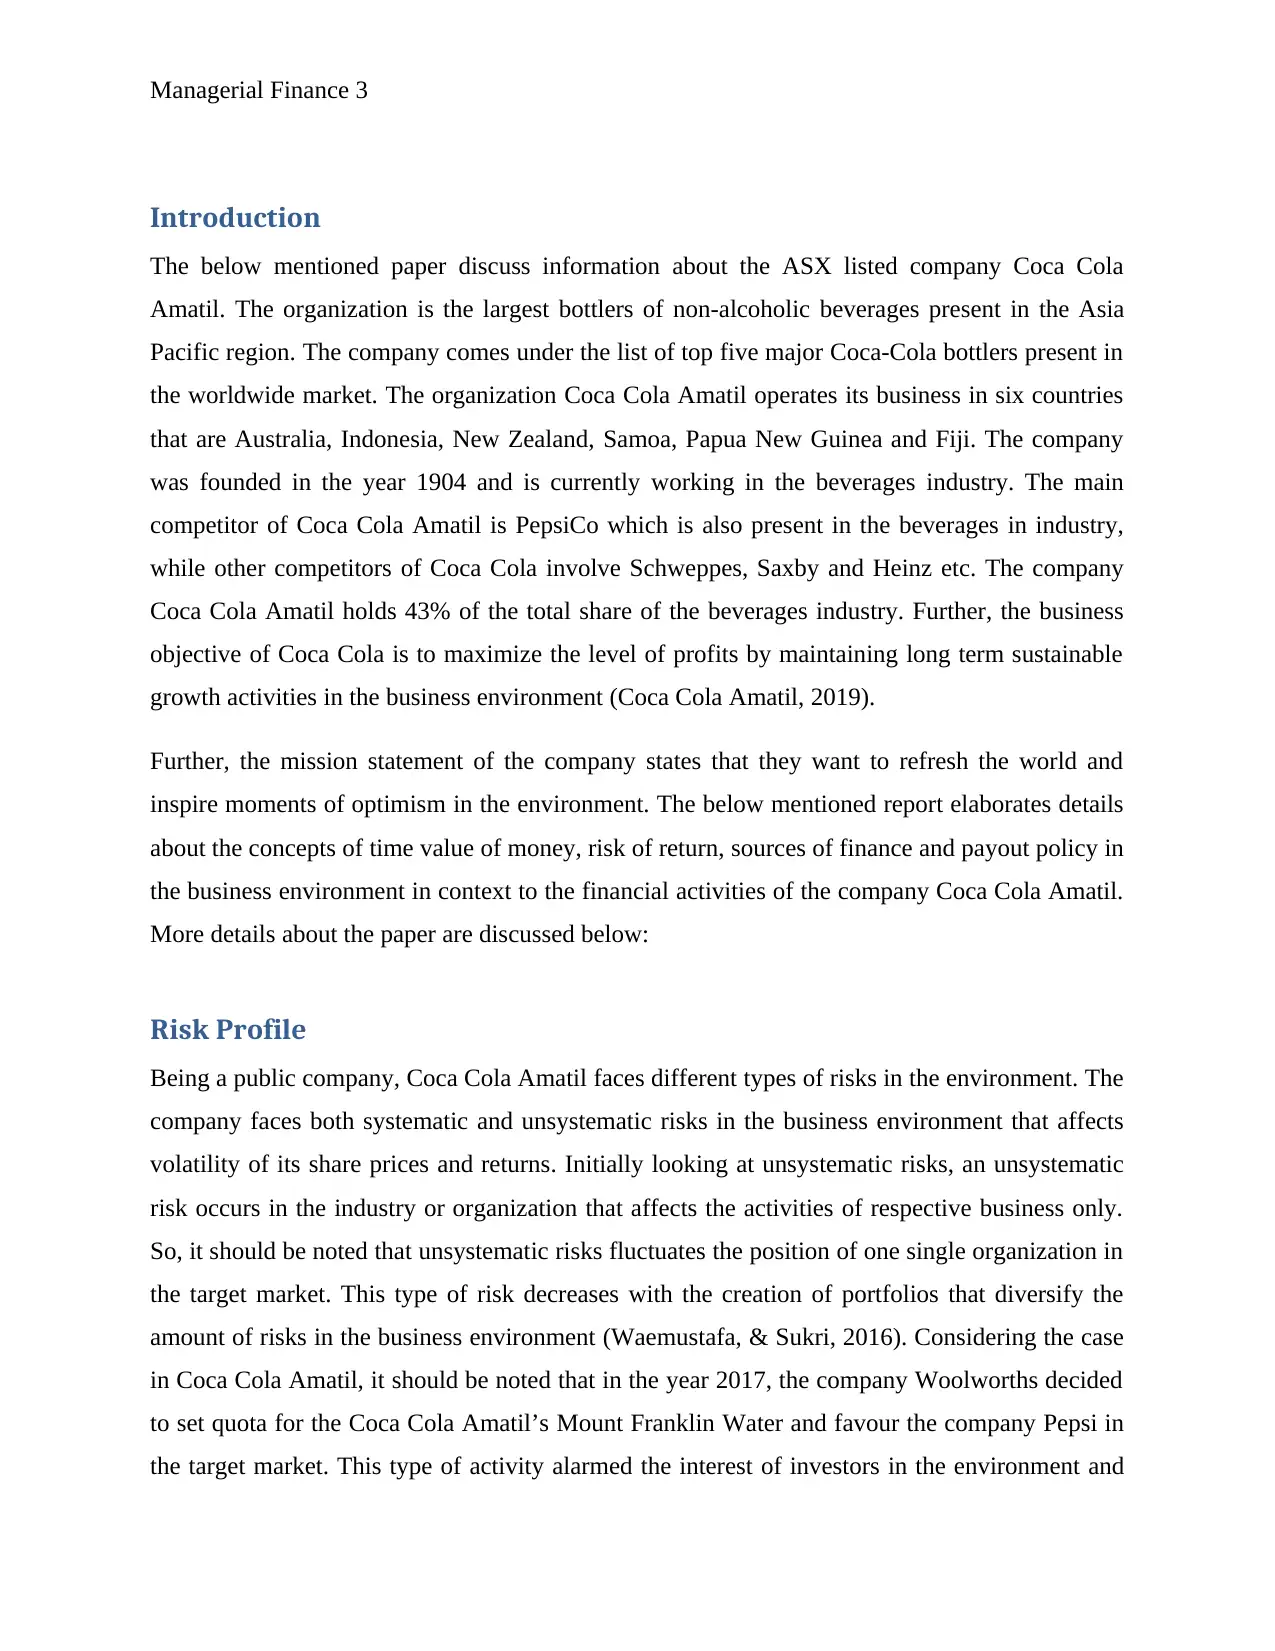
Introduction
The below mentioned paper discuss information about the ASX listed company Coca Cola
Amatil. The organization is the largest bottlers of non-alcoholic beverages present in the Asia
Pacific region. The company comes under the list of top five major Coca-Cola bottlers present in
the worldwide market. The organization Coca Cola Amatil operates its business in six countries
that are Australia, Indonesia, New Zealand, Samoa, Papua New Guinea and Fiji. The company
was founded in the year 1904 and is currently working in the beverages industry. The main
competitor of Coca Cola Amatil is PepsiCo which is also present in the beverages in industry,
while other competitors of Coca Cola involve Schweppes, Saxby and Heinz etc. The company
Coca Cola Amatil holds 43% of the total share of the beverages industry. Further, the business
objective of Coca Cola is to maximize the level of profits by maintaining long term sustainable
growth activities in the business environment (Coca Cola Amatil, 2019).
Further, the mission statement of the company states that they want to refresh the world and
inspire moments of optimism in the environment. The below mentioned report elaborates details
about the concepts of time value of money, risk of return, sources of finance and payout policy in
the business environment in context to the financial activities of the company Coca Cola Amatil.
More details about the paper are discussed below:
Risk Profile
Being a public company, Coca Cola Amatil faces different types of risks in the environment. The
company faces both systematic and unsystematic risks in the business environment that affects
volatility of its share prices and returns. Initially looking at unsystematic risks, an unsystematic
risk occurs in the industry or organization that affects the activities of respective business only.
So, it should be noted that unsystematic risks fluctuates the position of one single organization in
the target market. This type of risk decreases with the creation of portfolios that diversify the
amount of risks in the business environment (Waemustafa, & Sukri, 2016). Considering the case
in Coca Cola Amatil, it should be noted that in the year 2017, the company Woolworths decided
to set quota for the Coca Cola Amatil’s Mount Franklin Water and favour the company Pepsi in
the target market. This type of activity alarmed the interest of investors in the environment and
Paraphrase This Document
Need a fresh take? Get an instant paraphrase of this document with our AI Paraphraser
Managerial Finance 4
they started selling their shares in the market due to which the share price of the company’s
product was reduced by almost 3.75% in the business environment (Bhuyan, Reza, & El-Houbi,
2016).
Further, talking about systematic risks, it should be noted that systematic risks includes the
factors that affect the position of the market on a whole. This type of risk can be local or global
in nature but it affects to all the companies present in the industry. This type of fluctuation
creates impact on the whole society in the business environment. Also, this type of risk cannot be
diversified using portfolio diversification in the business environment (Chatzilakos, 2018).
Considering the case of Coca Cola Amatil Company it should be noted that increased use of
online shopping techniques has decreased the sales of the companies present the target market.
Through online sales many organization get to target the customers through multi-level
marketing and provide them products at discounts (Ayoob, 2018).
Resulting in which, customers reduces Coca Cola faces difficulty in supplying the products
online to small retailers due to which the sales revenue of the company is reduced. It should be
noted that systematic risks are much more risky than the unsystematic risk because in case of
unsystematic risk, the organization has the opportunity to pitch in for their risk and negotiate it in
the environment by diversifying the portfolio while in the case of systematic risks, the
organization do not have any way to go where they can manage their growth in market as all
other organizations present in the same industry are struggling to manage their position (Stewart,
2019).
Managerial Finance 5
Overall Financial Performance
Income Statement
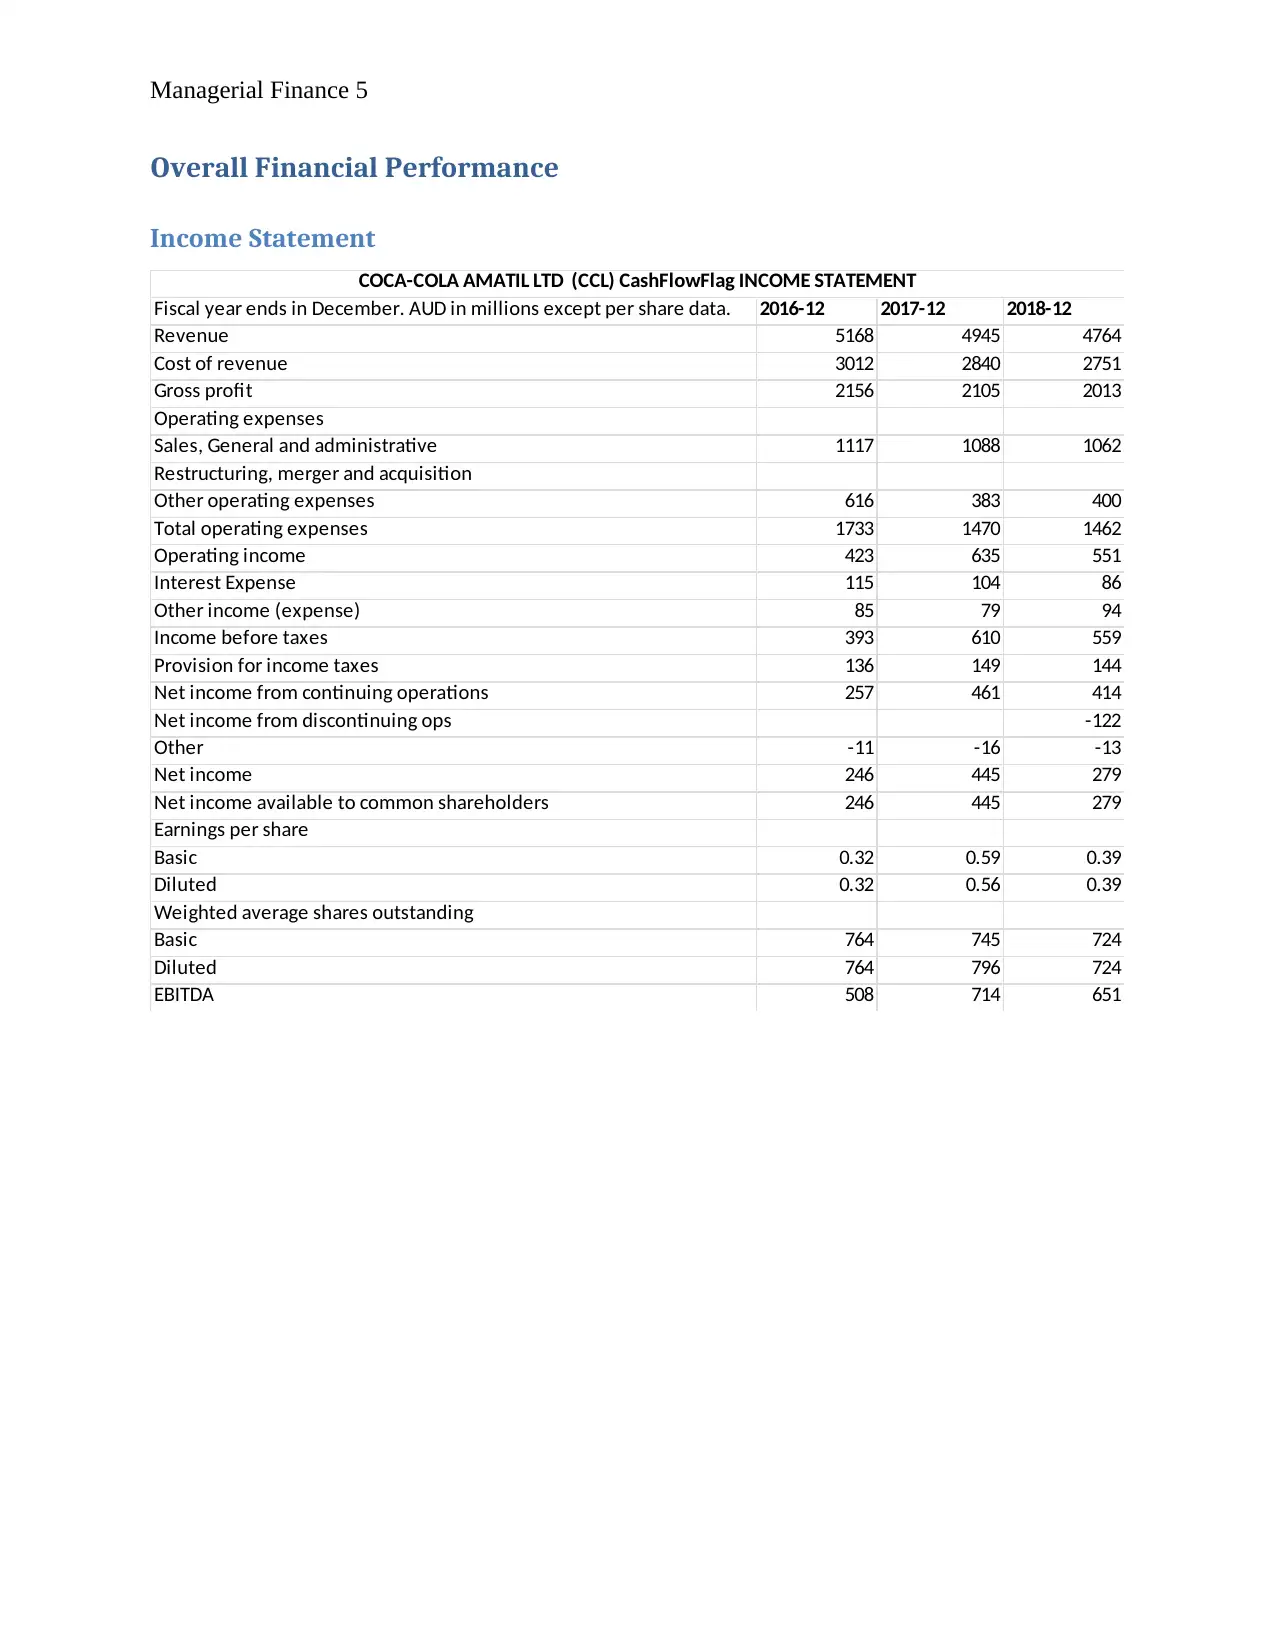
Fiscal year ends in December. AUD in millions except per share data. 2016-12 2017-12 2018-12
Revenue 5168 4945 4764
Cost of revenue 3012 2840 2751
Gross profit 2156 2105 2013
Operating expenses
Sales, General and administrative 1117 1088 1062
Restructuring, merger and acquisition
Other operating expenses 616 383 400
Total operating expenses 1733 1470 1462
Operating income 423 635 551
Interest Expense 115 104 86
Other income (expense) 85 79 94
Income before taxes 393 610 559
Provision for income taxes 136 149 144
Net income from continuing operations 257 461 414
Net income from discontinuing ops -122
Other -11 -16 -13
Net income 246 445 279
Net income available to common shareholders 246 445 279
Earnings per share
Basic 0.32 0.59 0.39
Diluted 0.32 0.56 0.39
Weighted average shares outstanding
Basic 764 745 724
Diluted 764 796 724
EBITDA 508 714 651
COCA-COLA AMATIL LTD (CCL) CashFlowFlag INCOME STATEMENT
Overall Financial Performance
Income Statement
Fiscal year ends in December. AUD in millions except per share data. 2016-12 2017-12 2018-12
Revenue 5168 4945 4764
Cost of revenue 3012 2840 2751
Gross profit 2156 2105 2013
Operating expenses
Sales, General and administrative 1117 1088 1062
Restructuring, merger and acquisition
Other operating expenses 616 383 400
Total operating expenses 1733 1470 1462
Operating income 423 635 551
Interest Expense 115 104 86
Other income (expense) 85 79 94
Income before taxes 393 610 559
Provision for income taxes 136 149 144
Net income from continuing operations 257 461 414
Net income from discontinuing ops -122
Other -11 -16 -13
Net income 246 445 279
Net income available to common shareholders 246 445 279
Earnings per share
Basic 0.32 0.59 0.39
Diluted 0.32 0.56 0.39
Weighted average shares outstanding
Basic 764 745 724
Diluted 764 796 724
EBITDA 508 714 651
COCA-COLA AMATIL LTD (CCL) CashFlowFlag INCOME STATEMENT
⊘ This is a preview!⊘
Do you want full access?
Subscribe today to unlock all pages.
Trusted by 1+ million students worldwide
Managerial Finance 6
Balance Sheet
Balance Sheet
Paraphrase This Document
Need a fresh take? Get an instant paraphrase of this document with our AI Paraphraser
Managerial Finance 7
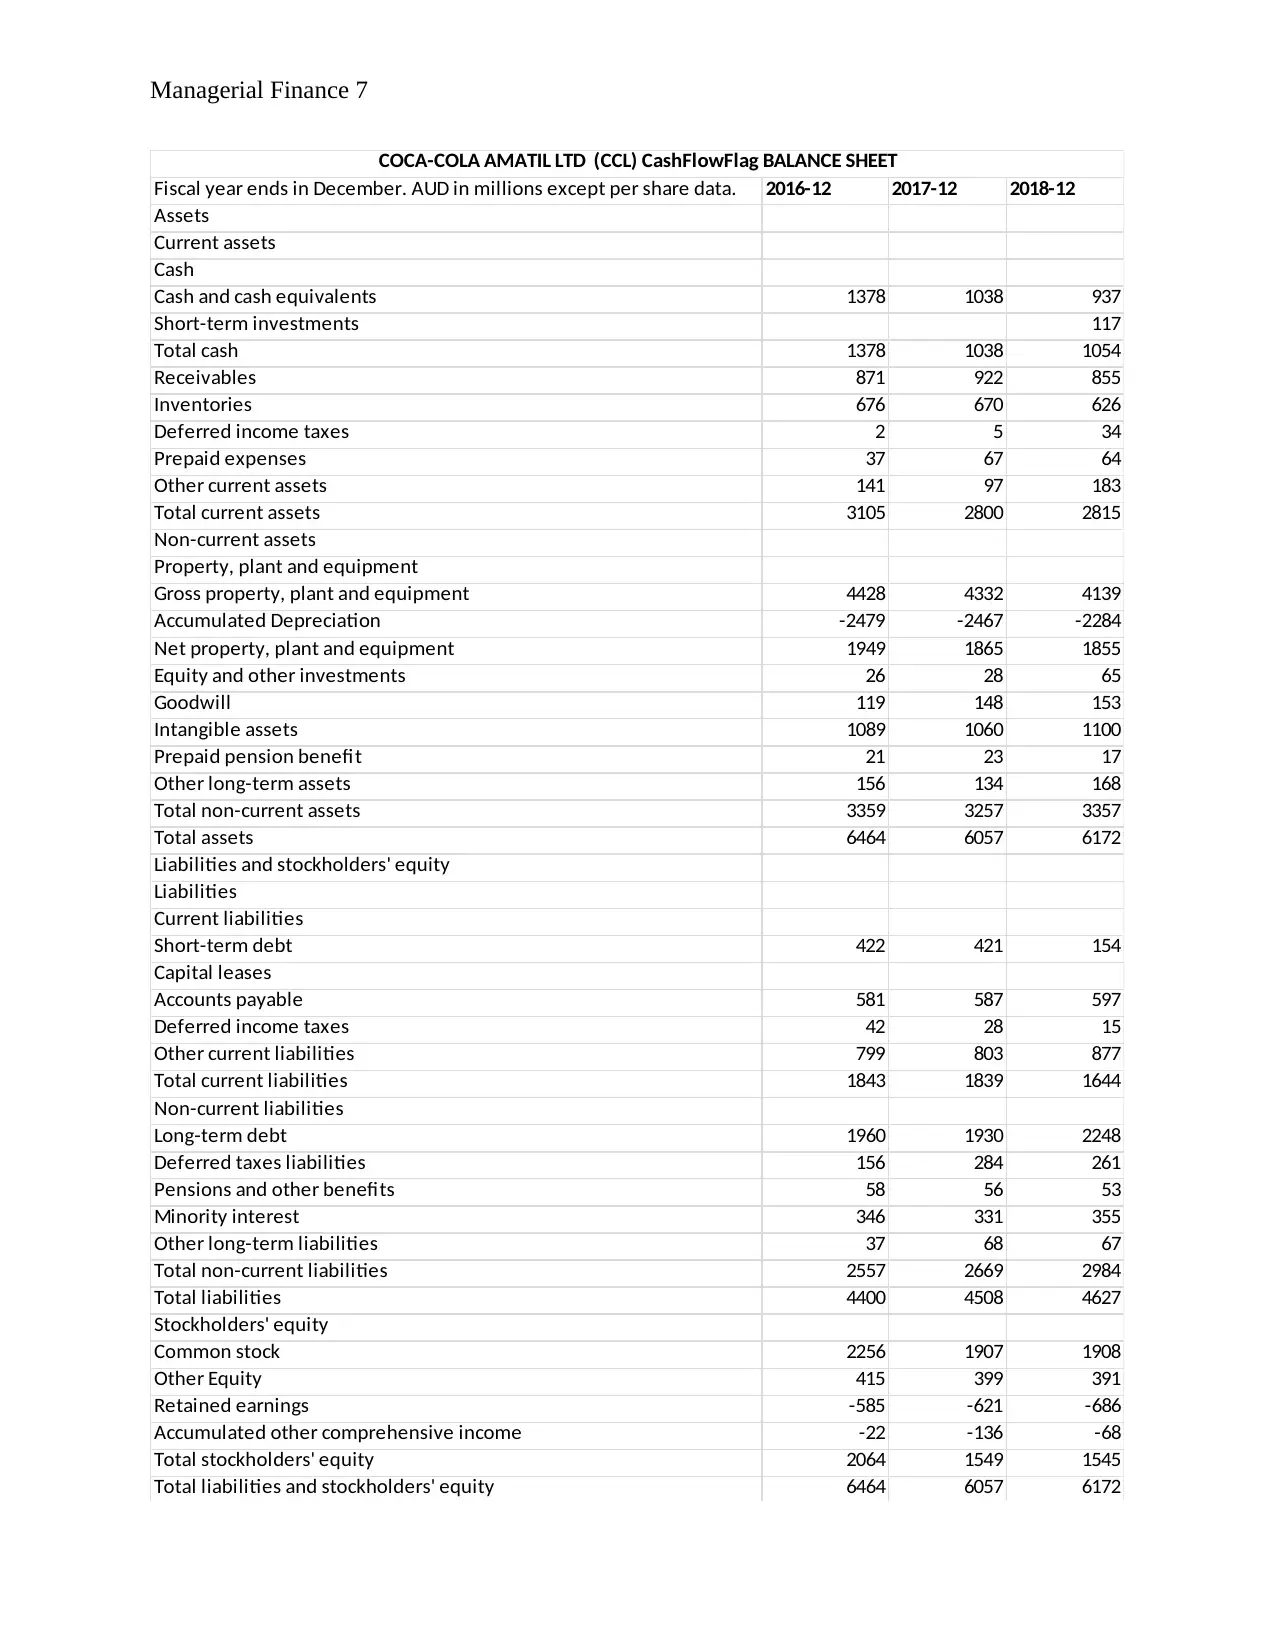
Fiscal year ends in December. AUD in millions except per share data. 2016-12 2017-12 2018-12
Assets
Current assets
Cash
Cash and cash equivalents 1378 1038 937
Short-term investments 117
Total cash 1378 1038 1054
Receivables 871 922 855
Inventories 676 670 626
Deferred income taxes 2 5 34
Prepaid expenses 37 67 64
Other current assets 141 97 183
Total current assets 3105 2800 2815
Non-current assets
Property, plant and equipment
Gross property, plant and equipment 4428 4332 4139
Accumulated Depreciation -2479 -2467 -2284
Net property, plant and equipment 1949 1865 1855
Equity and other investments 26 28 65
Goodwill 119 148 153
Intangible assets 1089 1060 1100
Prepaid pension benefit 21 23 17
Other long-term assets 156 134 168
Total non-current assets 3359 3257 3357
Total assets 6464 6057 6172
Liabilities and stockholders' equity
Liabilities
Current liabilities
Short-term debt 422 421 154
Capital leases
Accounts payable 581 587 597
Deferred income taxes 42 28 15
Other current liabilities 799 803 877
Total current liabilities 1843 1839 1644
Non-current liabilities
Long-term debt 1960 1930 2248
Deferred taxes liabilities 156 284 261
Pensions and other benefits 58 56 53
Minority interest 346 331 355
Other long-term liabilities 37 68 67
Total non-current liabilities 2557 2669 2984
Total liabilities 4400 4508 4627
Stockholders' equity
Common stock 2256 1907 1908
Other Equity 415 399 391
Retained earnings -585 -621 -686
Accumulated other comprehensive income -22 -136 -68
Total stockholders' equity 2064 1549 1545
Total liabilities and stockholders' equity 6464 6057 6172
COCA-COLA AMATIL LTD (CCL) CashFlowFlag BALANCE SHEET
Managerial Finance 8
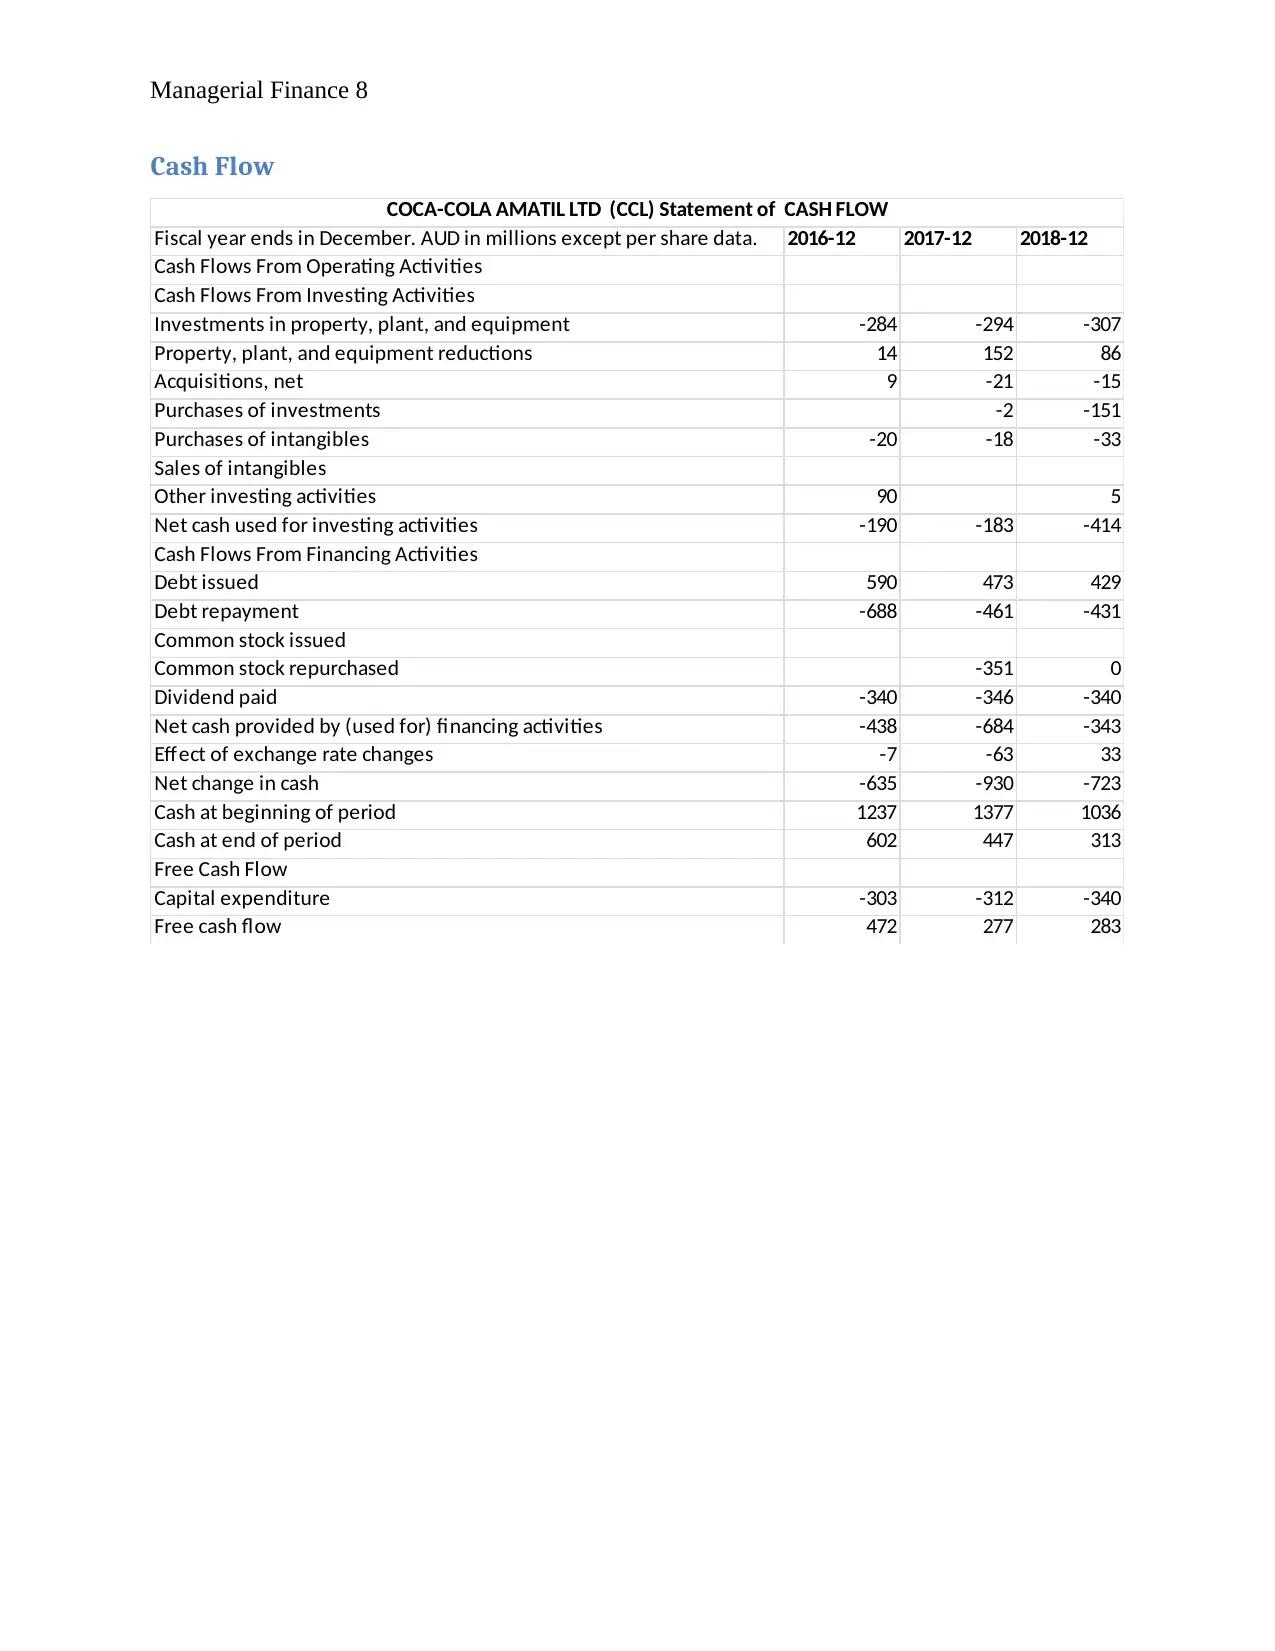
Cash Flow
Fiscal year ends in December. AUD in millions except per share data. 2016-12 2017-12 2018-12
Cash Flows From Operating Activities
Cash Flows From Investing Activities
Investments in property, plant, and equipment -284 -294 -307
Property, plant, and equipment reductions 14 152 86
Acquisitions, net 9 -21 -15
Purchases of investments -2 -151
Purchases of intangibles -20 -18 -33
Sales of intangibles
Other investing activities 90 5
Net cash used for investing activities -190 -183 -414
Cash Flows From Financing Activities
Debt issued 590 473 429
Debt repayment -688 -461 -431
Common stock issued
Common stock repurchased -351 0
Dividend paid -340 -346 -340
Net cash provided by (used for) financing activities -438 -684 -343
Effect of exchange rate changes -7 -63 33
Net change in cash -635 -930 -723
Cash at beginning of period 1237 1377 1036
Cash at end of period 602 447 313
Free Cash Flow
Capital expenditure -303 -312 -340
Free cash flow 472 277 283
COCA-COLA AMATIL LTD (CCL) Statement of CASH FLOW
⊘ This is a preview!⊘
Do you want full access?
Subscribe today to unlock all pages.
Trusted by 1+ million students worldwide
Managerial Finance 9
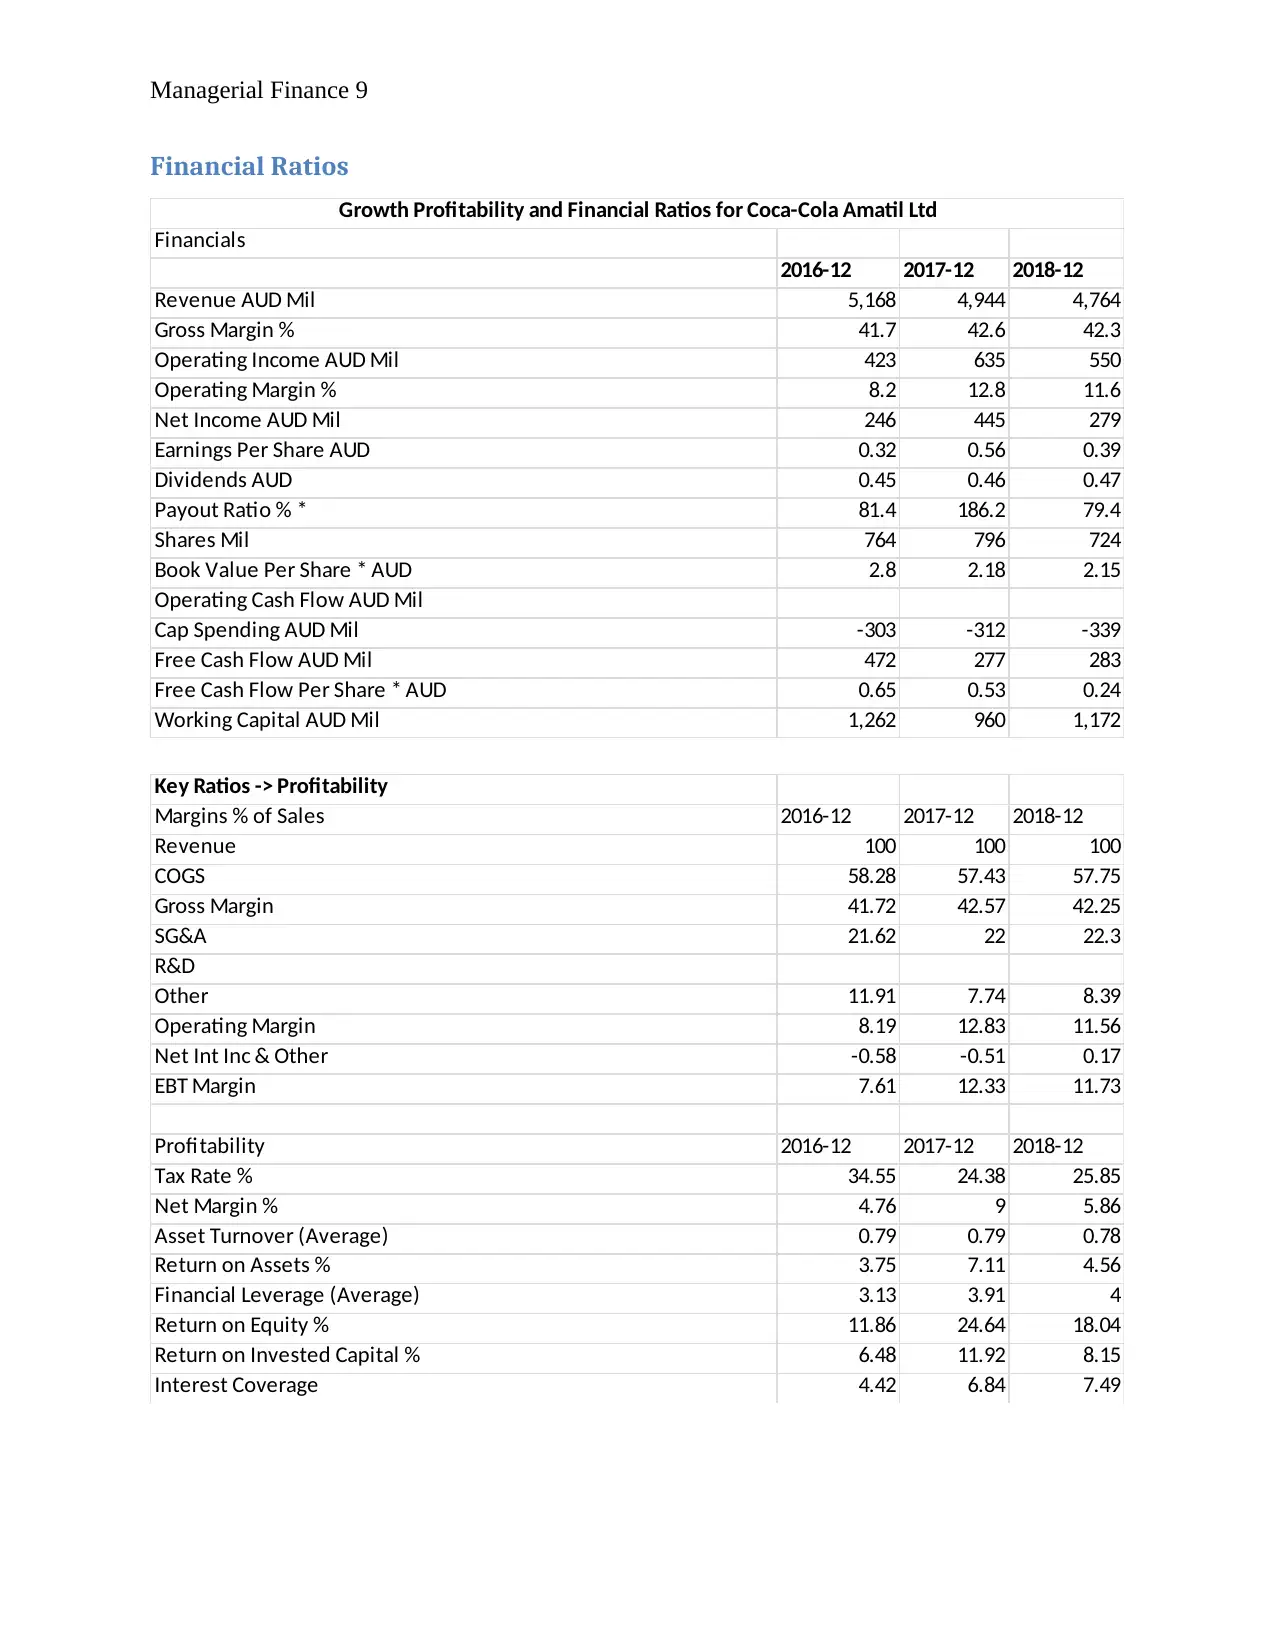
Financial Ratios
Financials
2016-12 2017-12 2018-12
Revenue AUD Mil 5,168 4,944 4,764
Gross Margin % 41.7 42.6 42.3
Operating Income AUD Mil 423 635 550
Operating Margin % 8.2 12.8 11.6
Net Income AUD Mil 246 445 279
Earnings Per Share AUD 0.32 0.56 0.39
Dividends AUD 0.45 0.46 0.47
Payout Ratio % * 81.4 186.2 79.4
Shares Mil 764 796 724
Book Value Per Share * AUD 2.8 2.18 2.15
Operating Cash Flow AUD Mil
Cap Spending AUD Mil -303 -312 -339
Free Cash Flow AUD Mil 472 277 283
Free Cash Flow Per Share * AUD 0.65 0.53 0.24
Working Capital AUD Mil 1,262 960 1,172
Growth Profitability and Financial Ratios for Coca-Cola Amatil Ltd
Key Ratios -> Profitability
Margins % of Sales 2016-12 2017-12 2018-12
Revenue 100 100 100
COGS 58.28 57.43 57.75
Gross Margin 41.72 42.57 42.25
SG&A 21.62 22 22.3
R&D
Other 11.91 7.74 8.39
Operating Margin 8.19 12.83 11.56
Net Int Inc & Other -0.58 -0.51 0.17
EBT Margin 7.61 12.33 11.73
Profitability 2016-12 2017-12 2018-12
Tax Rate % 34.55 24.38 25.85
Net Margin % 4.76 9 5.86
Asset Turnover (Average) 0.79 0.79 0.78
Return on Assets % 3.75 7.11 4.56
Financial Leverage (Average) 3.13 3.91 4
Return on Equity % 11.86 24.64 18.04
Return on Invested Capital % 6.48 11.92 8.15
Interest Coverage 4.42 6.84 7.49
Paraphrase This Document
Need a fresh take? Get an instant paraphrase of this document with our AI Paraphraser
Managerial Finance 10
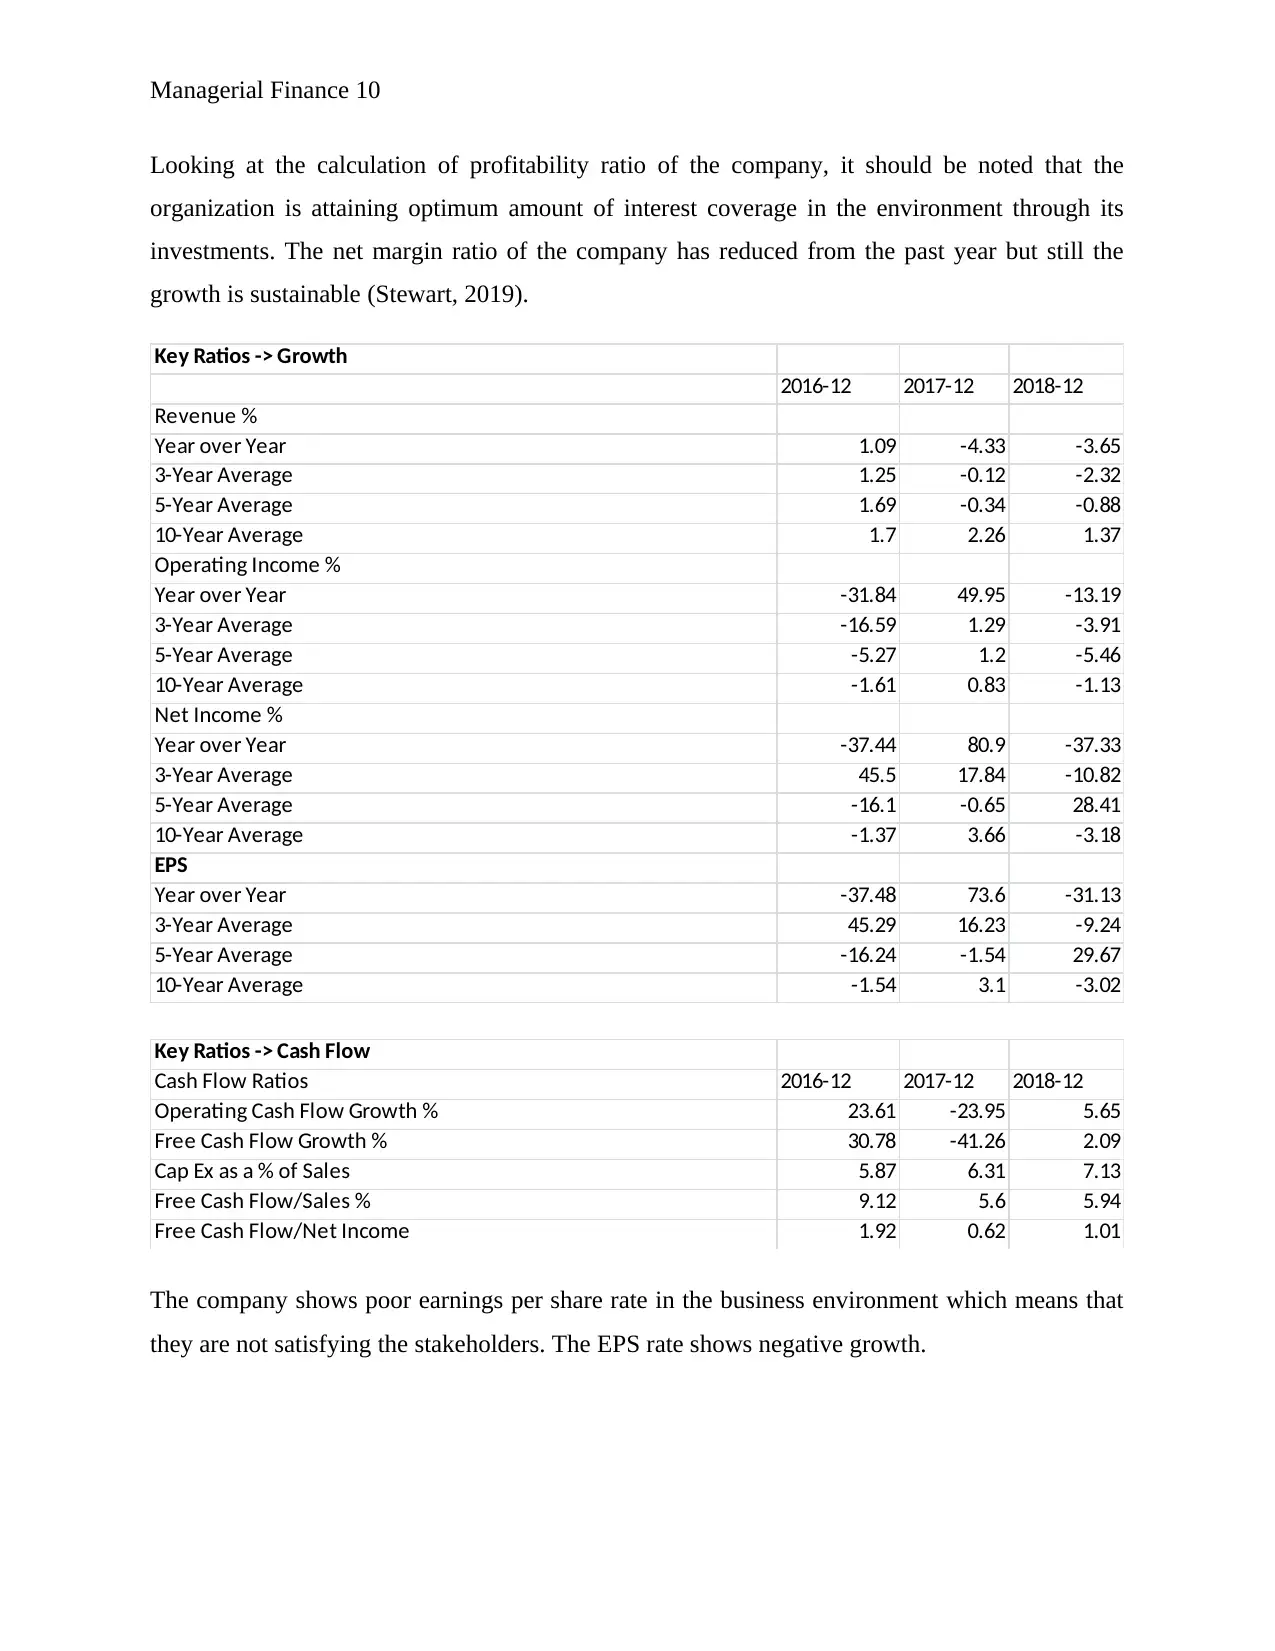
Looking at the calculation of profitability ratio of the company, it should be noted that the
organization is attaining optimum amount of interest coverage in the environment through its
investments. The net margin ratio of the company has reduced from the past year but still the
growth is sustainable (Stewart, 2019).
Key Ratios -> Growth
2016-12 2017-12 2018-12
Revenue %
Year over Year 1.09 -4.33 -3.65
3-Year Average 1.25 -0.12 -2.32
5-Year Average 1.69 -0.34 -0.88
10-Year Average 1.7 2.26 1.37
Operating Income %
Year over Year -31.84 49.95 -13.19
3-Year Average -16.59 1.29 -3.91
5-Year Average -5.27 1.2 -5.46
10-Year Average -1.61 0.83 -1.13
Net Income %
Year over Year -37.44 80.9 -37.33
3-Year Average 45.5 17.84 -10.82
5-Year Average -16.1 -0.65 28.41
10-Year Average -1.37 3.66 -3.18
EPS
Year over Year -37.48 73.6 -31.13
3-Year Average 45.29 16.23 -9.24
5-Year Average -16.24 -1.54 29.67
10-Year Average -1.54 3.1 -3.02
Key Ratios -> Cash Flow
Cash Flow Ratios 2016-12 2017-12 2018-12
Operating Cash Flow Growth % 23.61 -23.95 5.65
Free Cash Flow Growth % 30.78 -41.26 2.09
Cap Ex as a % of Sales 5.87 6.31 7.13
Free Cash Flow/Sales % 9.12 5.6 5.94
Free Cash Flow/Net Income 1.92 0.62 1.01
The company shows poor earnings per share rate in the business environment which means that
they are not satisfying the stakeholders. The EPS rate shows negative growth.
Managerial Finance 11
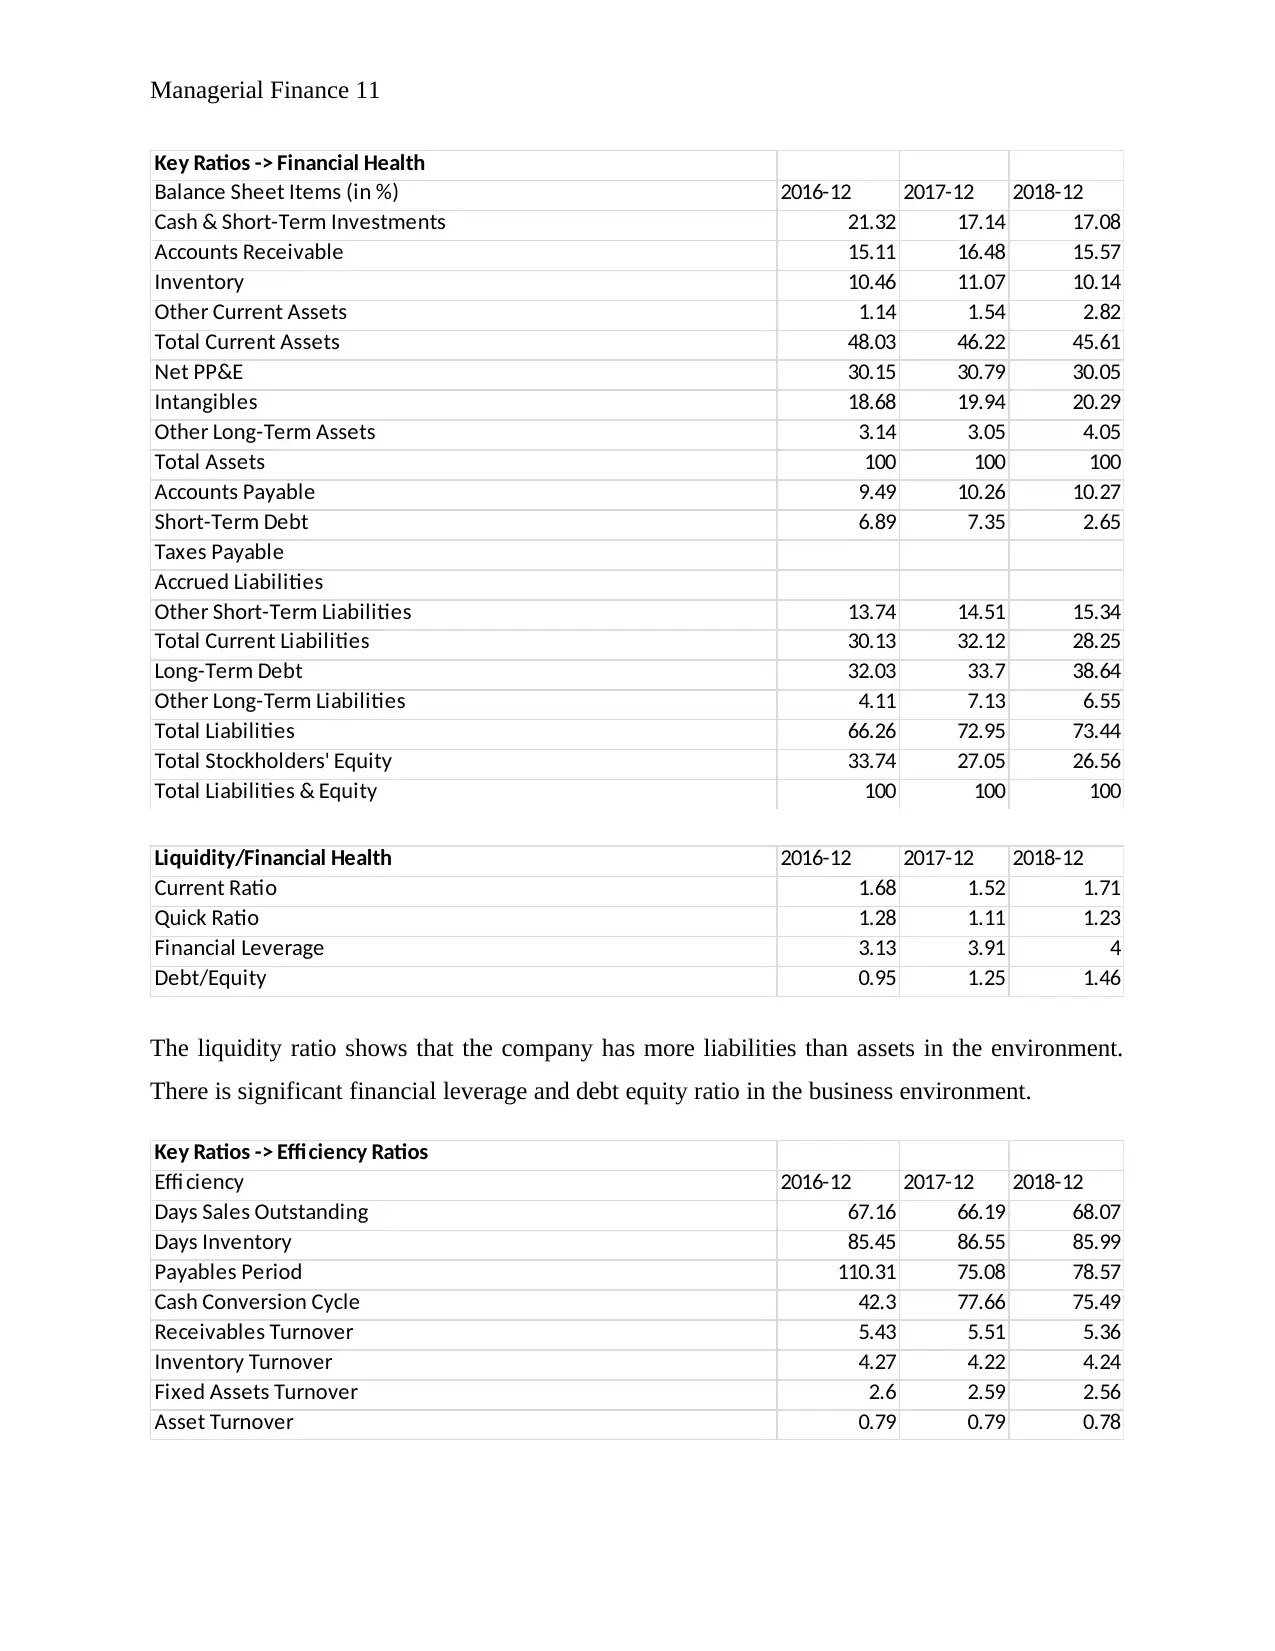
Key Ratios -> Financial Health
Balance Sheet Items (in %) 2016-12 2017-12 2018-12
Cash & Short-Term Investments 21.32 17.14 17.08
Accounts Receivable 15.11 16.48 15.57
Inventory 10.46 11.07 10.14
Other Current Assets 1.14 1.54 2.82
Total Current Assets 48.03 46.22 45.61
Net PP&E 30.15 30.79 30.05
Intangibles 18.68 19.94 20.29
Other Long-Term Assets 3.14 3.05 4.05
Total Assets 100 100 100
Accounts Payable 9.49 10.26 10.27
Short-Term Debt 6.89 7.35 2.65
Taxes Payable
Accrued Liabilities
Other Short-Term Liabilities 13.74 14.51 15.34
Total Current Liabilities 30.13 32.12 28.25
Long-Term Debt 32.03 33.7 38.64
Other Long-Term Liabilities 4.11 7.13 6.55
Total Liabilities 66.26 72.95 73.44
Total Stockholders' Equity 33.74 27.05 26.56
Total Liabilities & Equity 100 100 100
Liquidity/Financial Health 2016-12 2017-12 2018-12
Current Ratio 1.68 1.52 1.71
Quick Ratio 1.28 1.11 1.23
Financial Leverage 3.13 3.91 4
Debt/Equity 0.95 1.25 1.46
The liquidity ratio shows that the company has more liabilities than assets in the environment.
There is significant financial leverage and debt equity ratio in the business environment.
Key Ratios -> Efficiency Ratios
Effi ciency 2016-12 2017-12 2018-12
Days Sales Outstanding 67.16 66.19 68.07
Days Inventory 85.45 86.55 85.99
Payables Period 110.31 75.08 78.57
Cash Conversion Cycle 42.3 77.66 75.49
Receivables Turnover 5.43 5.51 5.36
Inventory Turnover 4.27 4.22 4.24
Fixed Assets Turnover 2.6 2.59 2.56
Asset Turnover 0.79 0.79 0.78
⊘ This is a preview!⊘
Do you want full access?
Subscribe today to unlock all pages.
Trusted by 1+ million students worldwide
1 out of 17
Related Documents


Your All-in-One AI-Powered Toolkit for Academic Success.
+13062052269
info@desklib.com
Available 24*7 on WhatsApp / Email
![[object Object]](/_next/static/media/star-bottom.7253800d.svg)
Unlock your academic potential
Copyright © 2020–2026 A2Z Services. All Rights Reserved. Developed and managed by ZUCOL.