Finance for Business: Coca-Cola Performance Analysis Report - HI5002
VerifiedAdded on 2022/11/09
|9
|1001
|226
Report
AI Summary
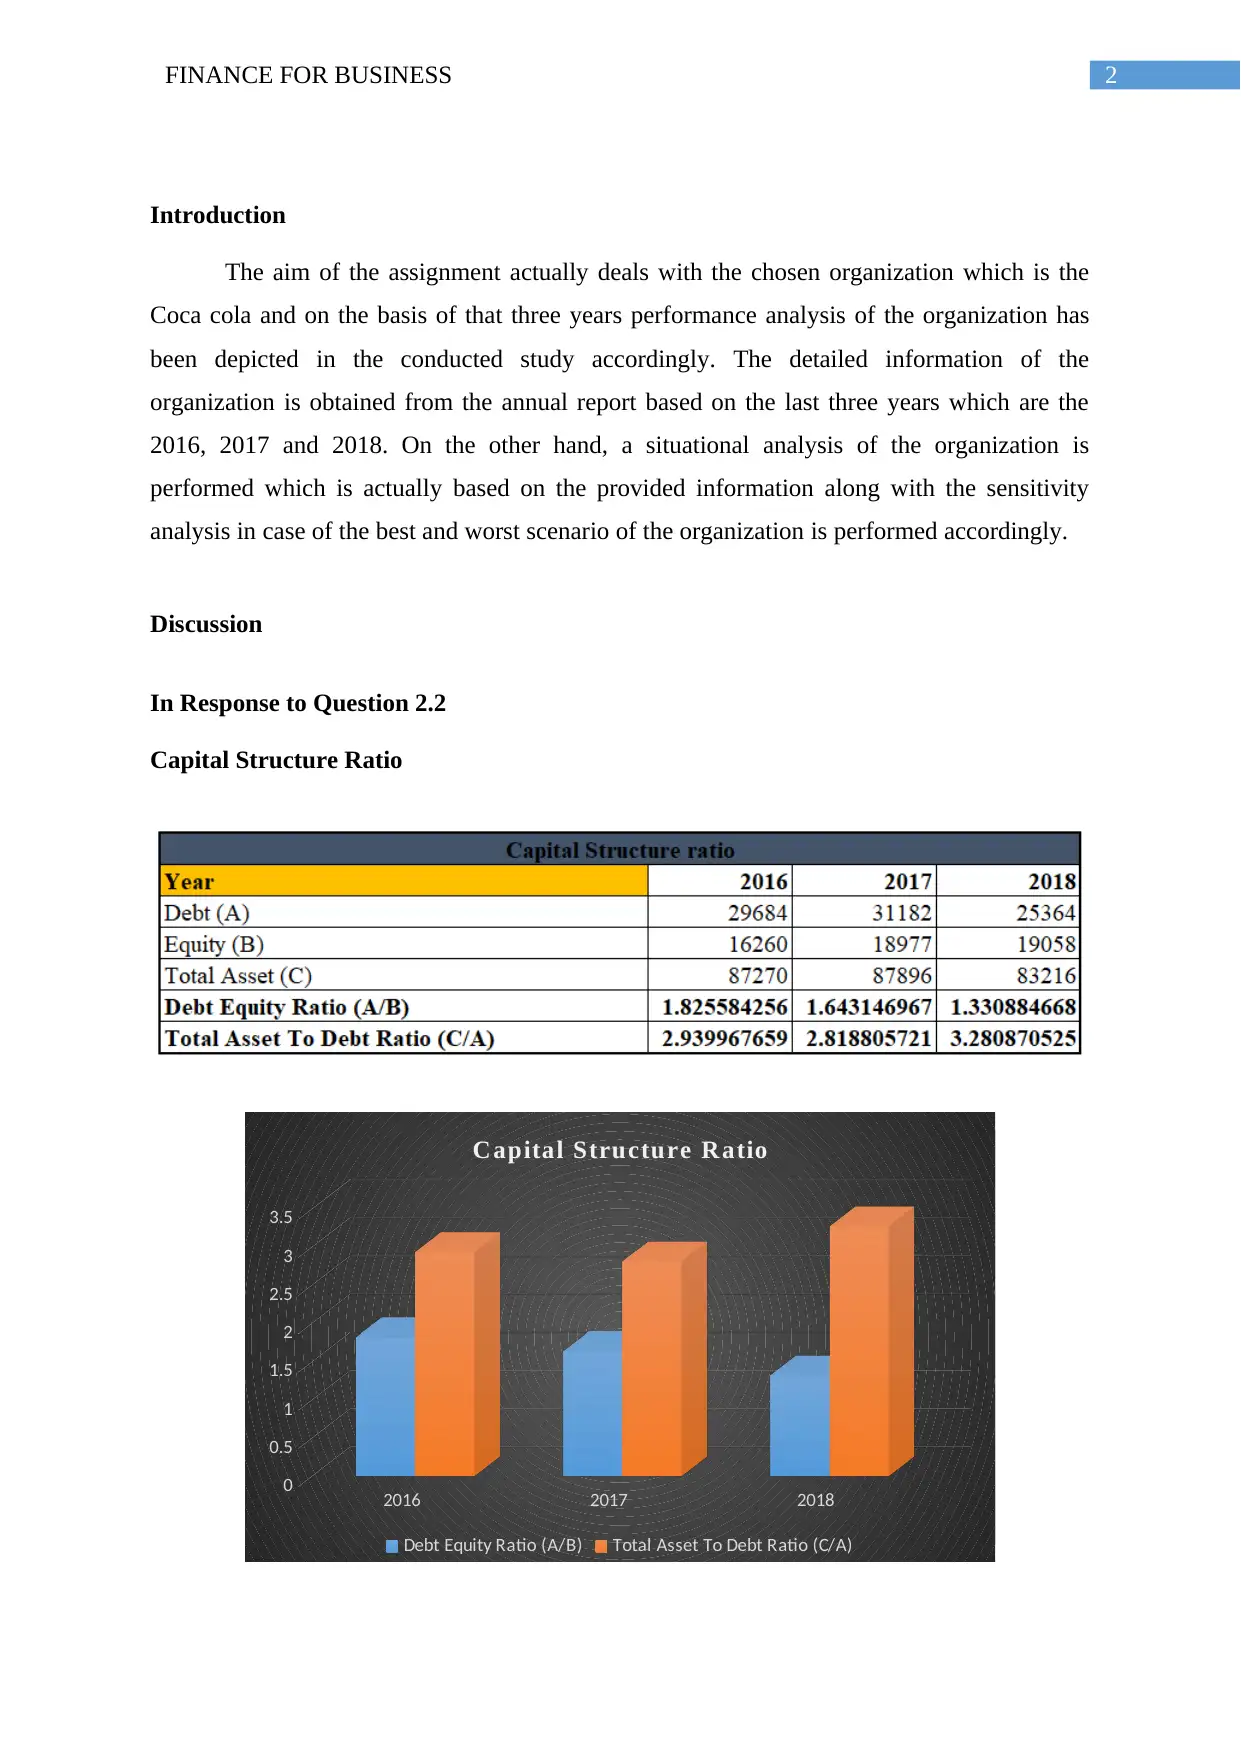
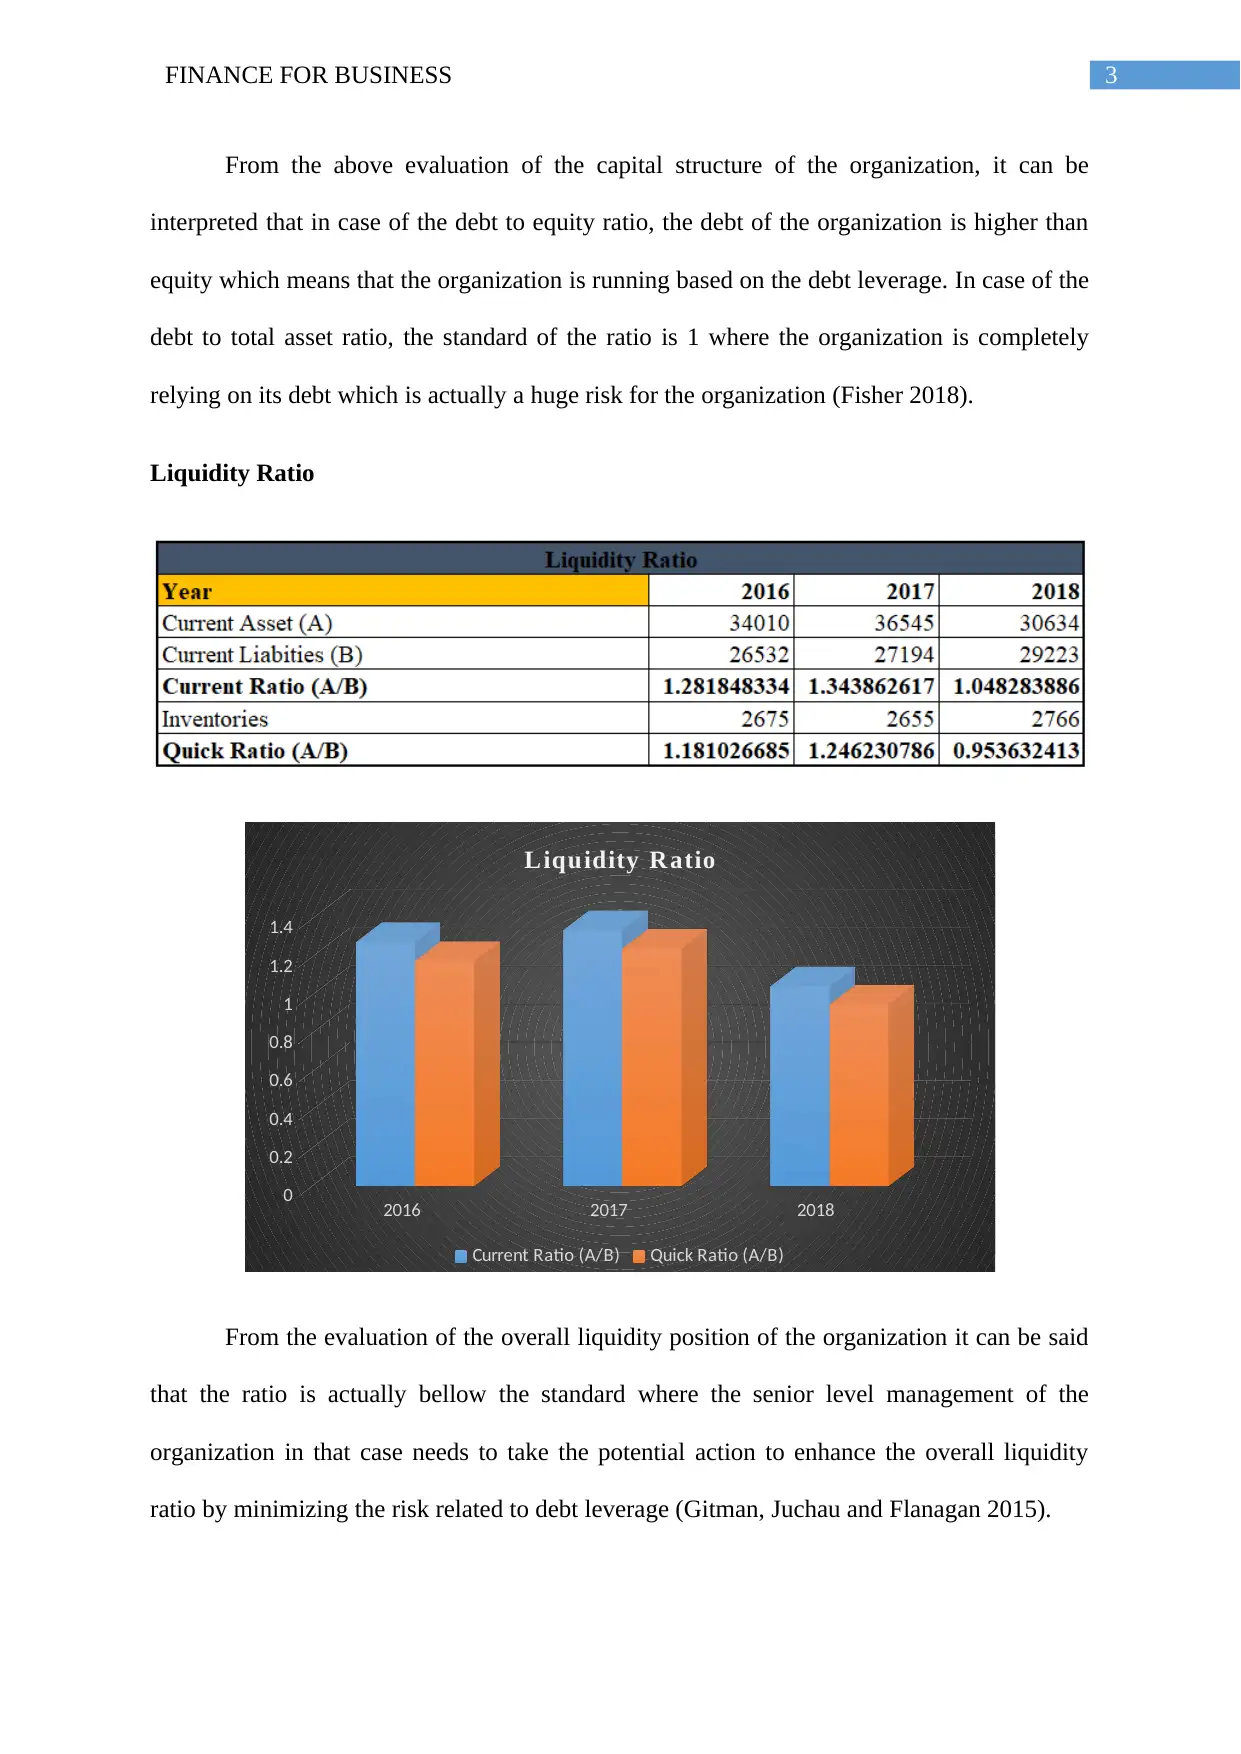
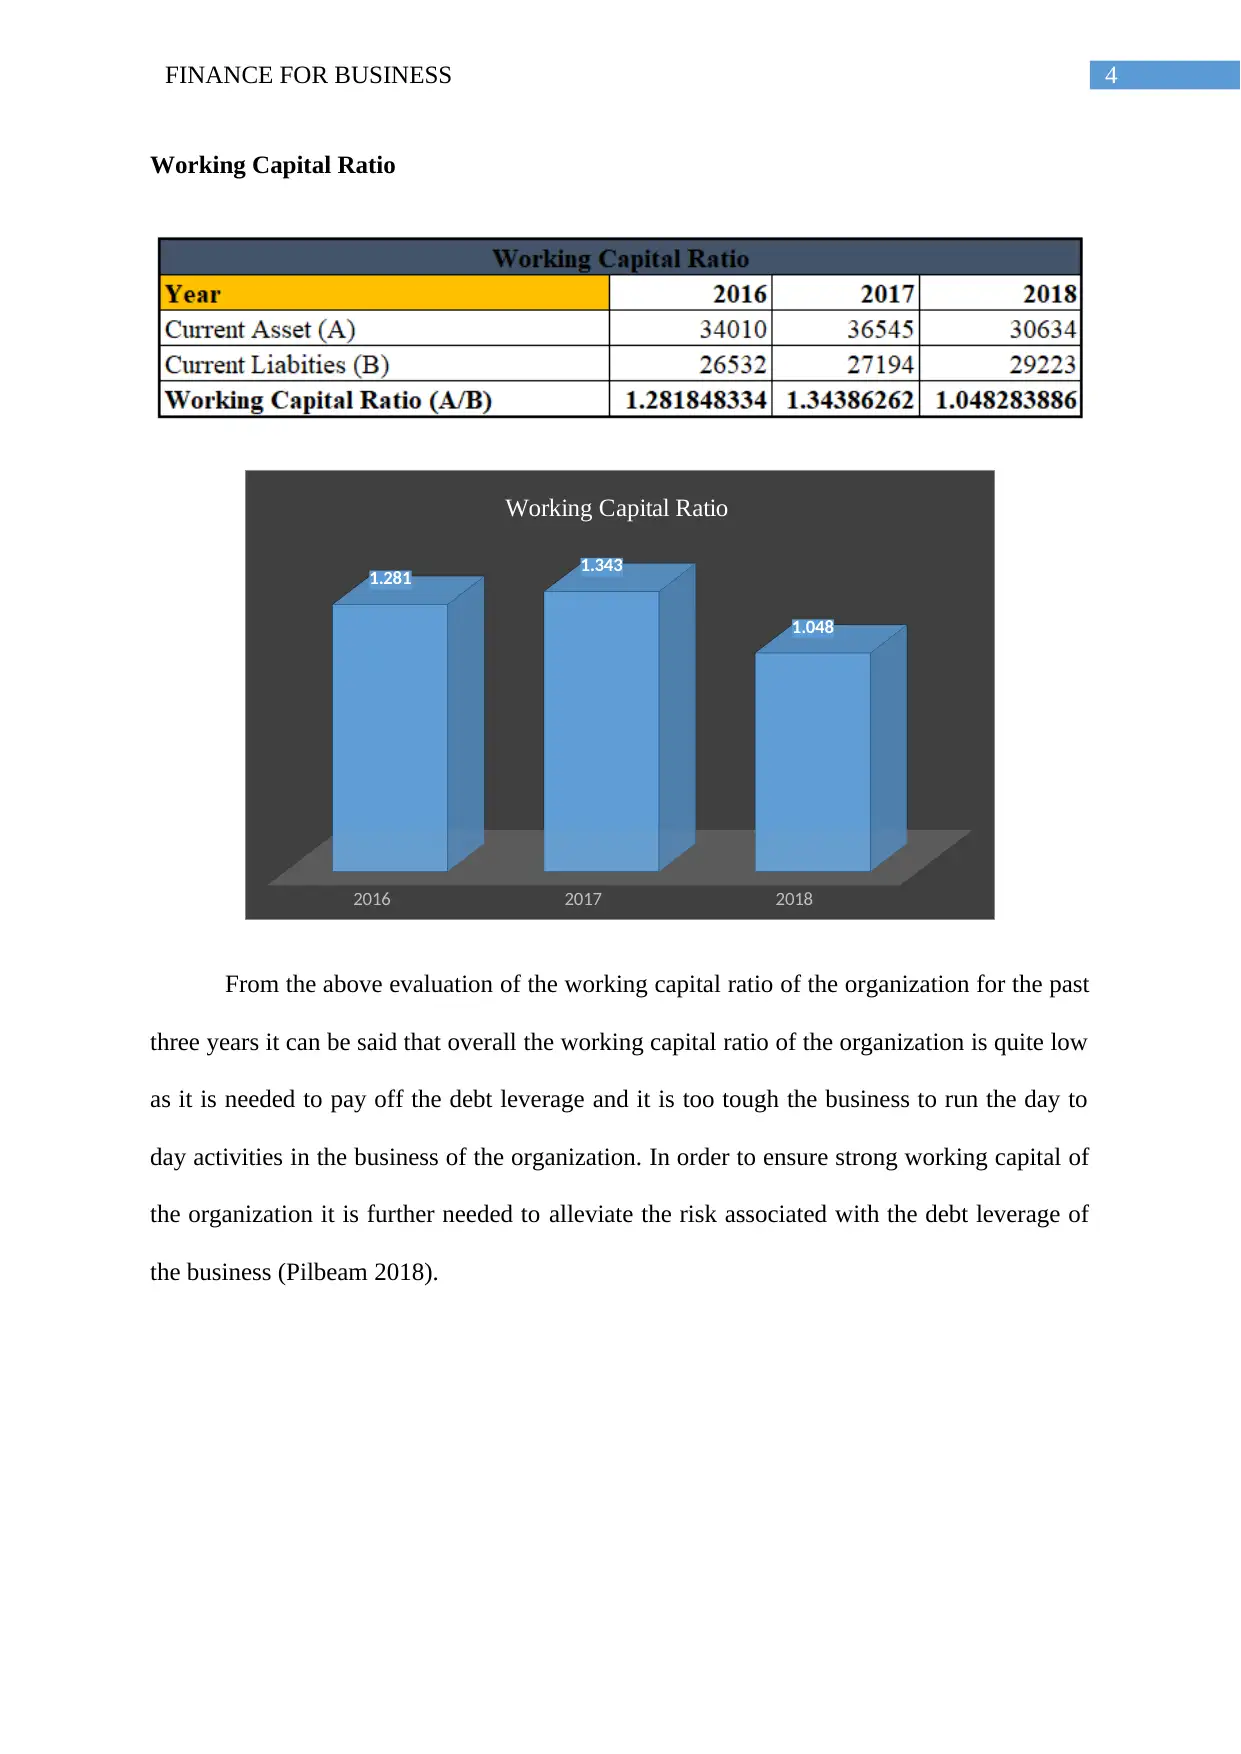
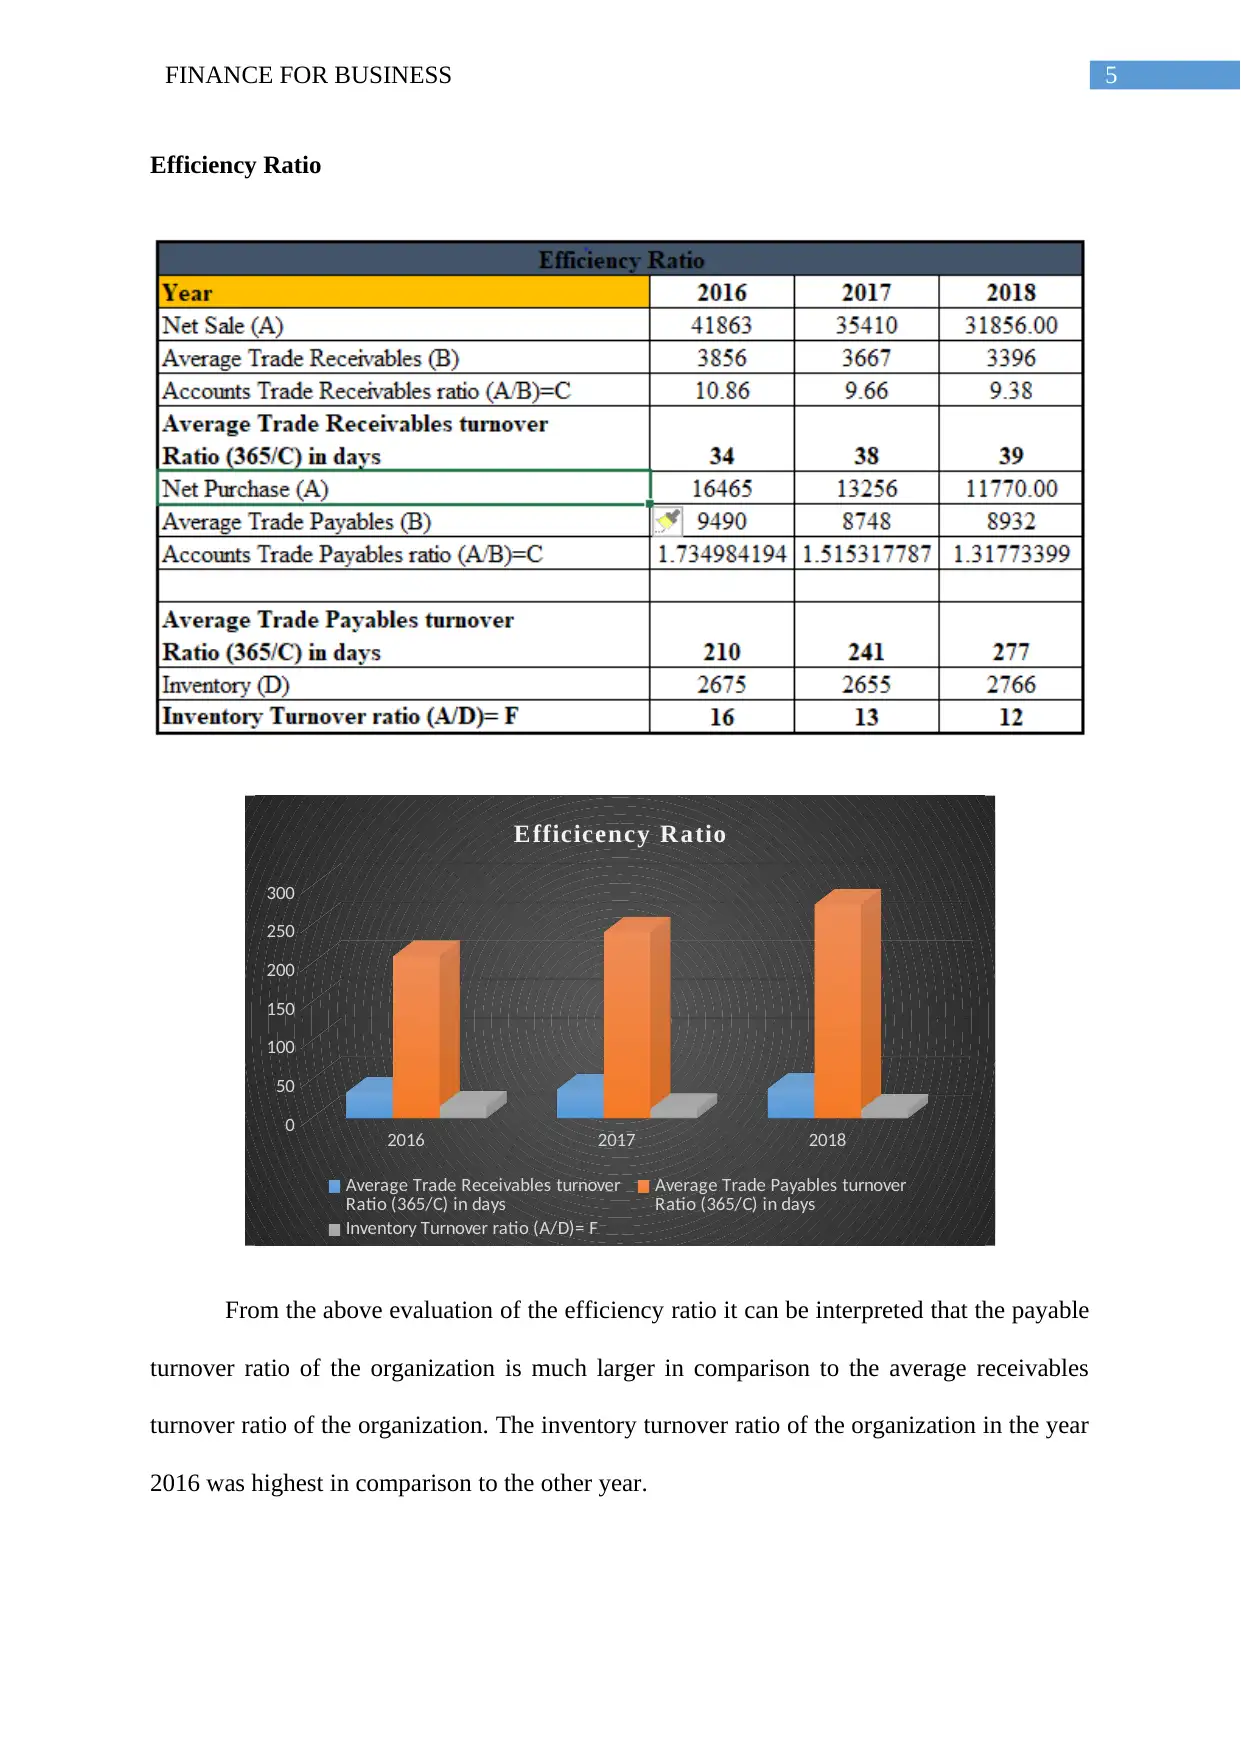
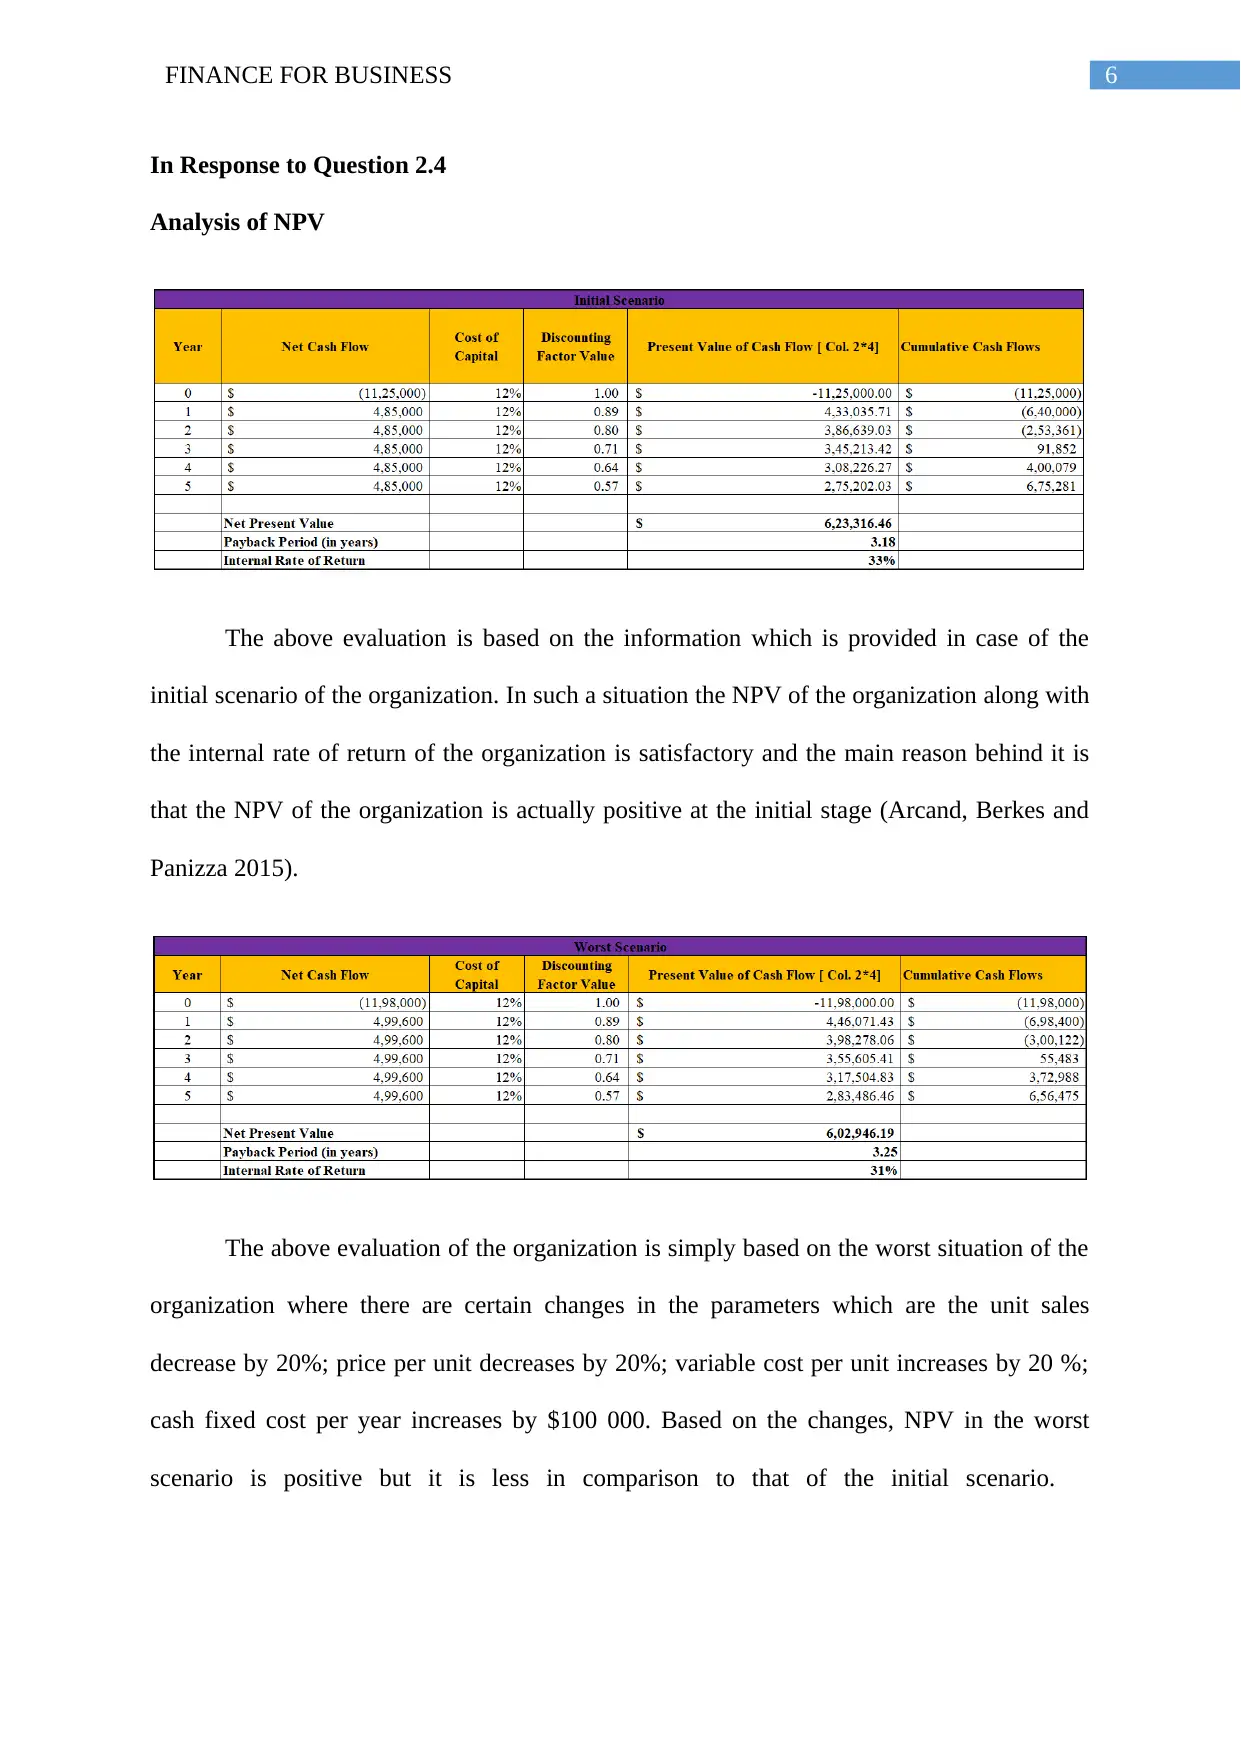
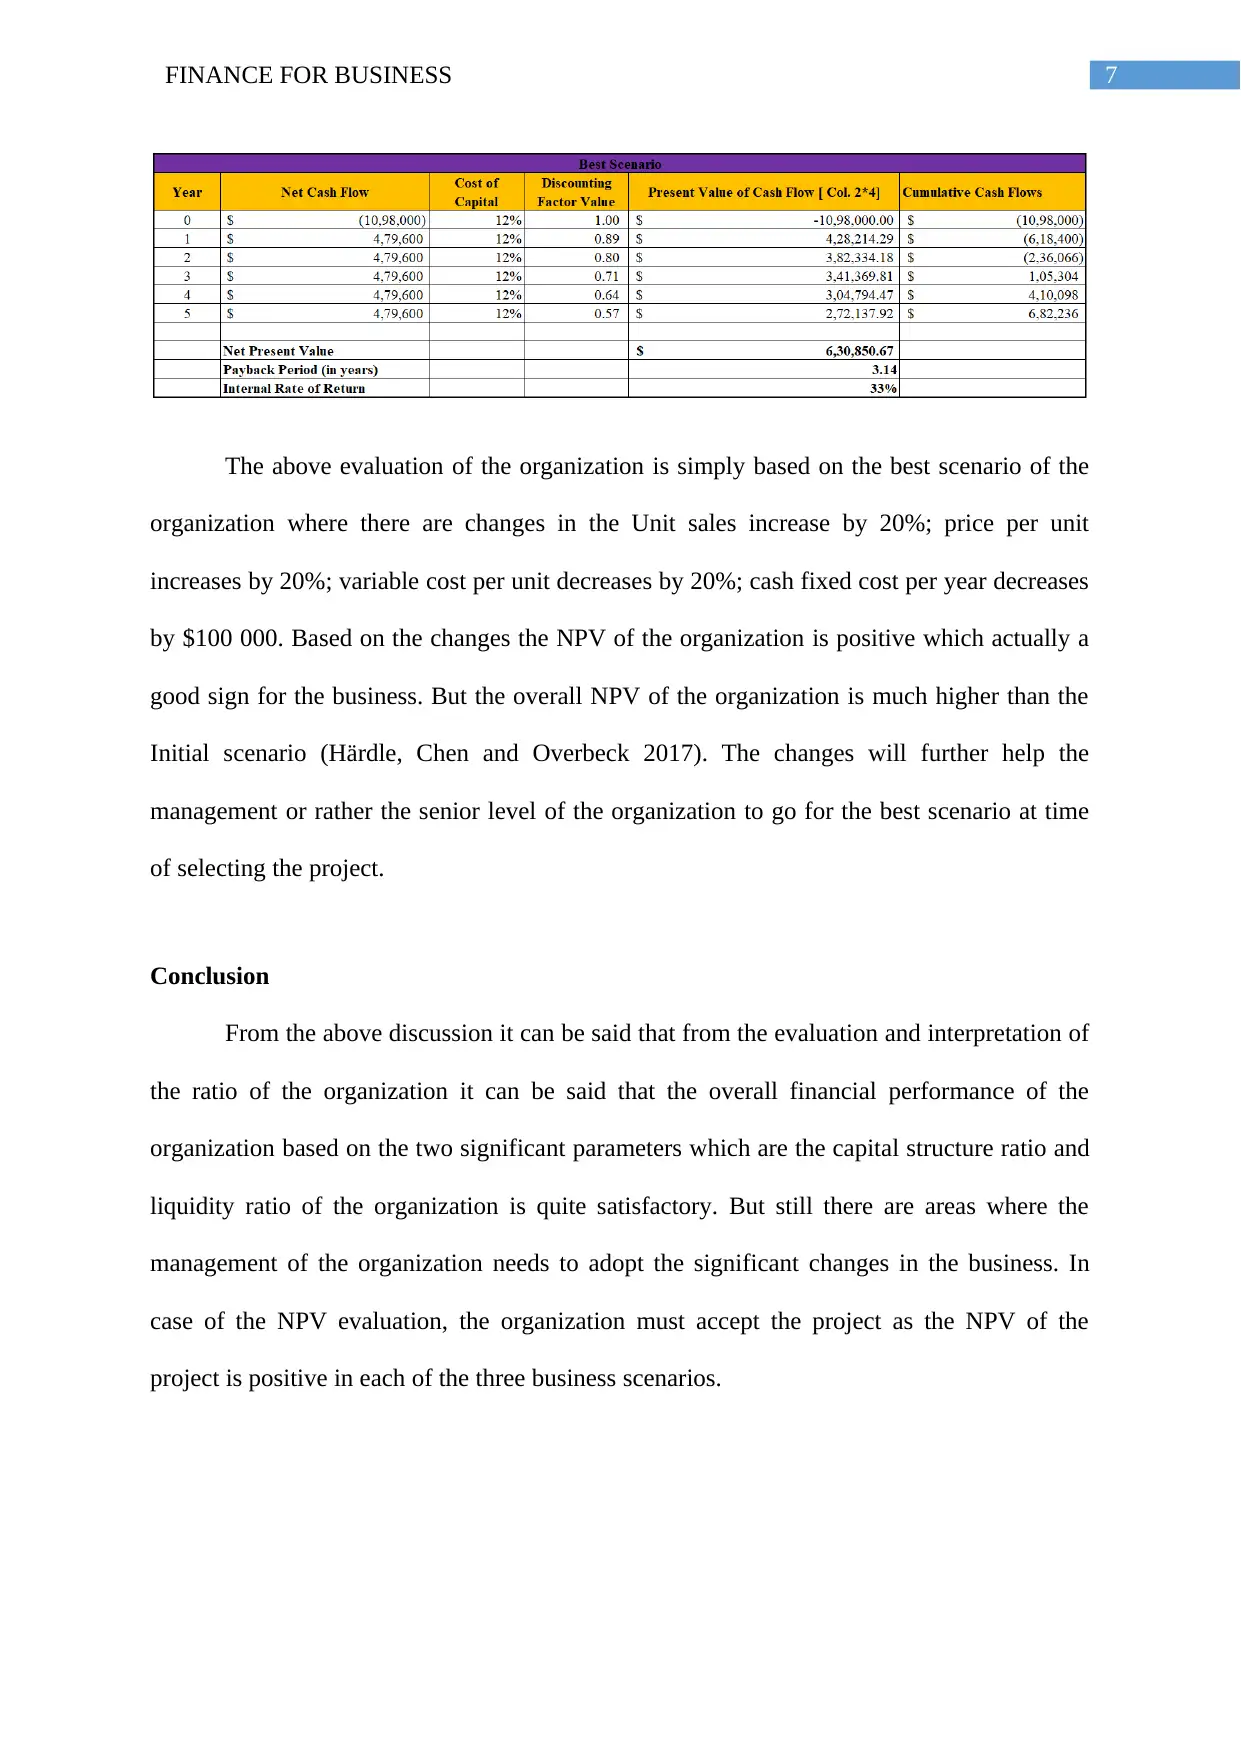
This report provides a comprehensive financial analysis of Coca-Cola's performance over three years (2016-2018), examining capital structure, liquidity, working capital, and efficiency ratios. The analysis includes a detailed assessment of the company's debt-to-equity ratio, debt-to-total-asset ratio, and liquidity position, highlighting areas for potential improvement. Furthermore, the report evaluates Coca-Cola's efficiency ratios, including payable turnover and inventory turnover. The study also presents a Net Present Value (NPV) analysis under initial, best-case, and worst-case scenarios, offering insights into the project's viability. The conclusion summarizes the financial performance, suggesting that while the financial performance based on capital structure and liquidity is satisfactory, the management should consider changes in certain areas. The report recommends accepting the project based on positive NPV across all scenarios.

Running head: FINANCE FOR BUSINESS
FINANCE FOR BUSINESS
Name of the student:
Name of the university:
Author Note:
FINANCE FOR BUSINESS
Name of the student:
Name of the university:
Author Note:
Paraphrase This Document
Need a fresh take? Get an instant paraphrase of this document with our AI Paraphraser

1FINANCE FOR BUSINESS
Table of Contents
Introduction................................................................................................................................2
Discussion..................................................................................................................................2
In Response to Question 2.2...................................................................................................2
In Response to Question 2.4...................................................................................................5
Conclusion..................................................................................................................................6
References..................................................................................................................................7

2FINANCE FOR BUSINESS
Introduction
The aim of the assignment actually deals with the chosen organization which is the
Coca cola and on the basis of that three years performance analysis of the organization has
been depicted in the conducted study accordingly. The detailed information of the
organization is obtained from the annual report based on the last three years which are the
2016, 2017 and 2018. On the other hand, a situational analysis of the organization is
performed which is actually based on the provided information along with the sensitivity
analysis in case of the best and worst scenario of the organization is performed accordingly.
Discussion
In Response to Question 2.2
Capital Structure Ratio
2016 2017 2018
0
0.5
1
1.5
2
2.5
3
3.5
C apital Structure R atio
Debt Equity Ratio (A/B) Total Asset To Debt Ratio (C/A)
⊘ This is a preview!⊘
Do you want full access?
Subscribe today to unlock all pages.

Trusted by 1+ million students worldwide

3FINANCE FOR BUSINESS
From the above evaluation of the capital structure of the organization, it can be
interpreted that in case of the debt to equity ratio, the debt of the organization is higher than
equity which means that the organization is running based on the debt leverage. In case of the
debt to total asset ratio, the standard of the ratio is 1 where the organization is completely
relying on its debt which is actually a huge risk for the organization (Fisher 2018).
Liquidity Ratio
2016 2017 2018
0
0.2
0.4
0.6
0.8
1
1.2
1.4
Liquidity R atio
Current Ratio (A/B) Quick Ratio (A/B)
From the evaluation of the overall liquidity position of the organization it can be said
that the ratio is actually bellow the standard where the senior level management of the
organization in that case needs to take the potential action to enhance the overall liquidity
ratio by minimizing the risk related to debt leverage (Gitman, Juchau and Flanagan 2015).
Paraphrase This Document
Need a fresh take? Get an instant paraphrase of this document with our AI Paraphraser

4FINANCE FOR BUSINESS
Working Capital Ratio
2016 2017 2018
1.281 1.343
1.048
Working Capital Ratio
From the above evaluation of the working capital ratio of the organization for the past
three years it can be said that overall the working capital ratio of the organization is quite low
as it is needed to pay off the debt leverage and it is too tough the business to run the day to
day activities in the business of the organization. In order to ensure strong working capital of
the organization it is further needed to alleviate the risk associated with the debt leverage of
the business (Pilbeam 2018).
Working Capital Ratio
2016 2017 2018
1.281 1.343
1.048
Working Capital Ratio
From the above evaluation of the working capital ratio of the organization for the past
three years it can be said that overall the working capital ratio of the organization is quite low
as it is needed to pay off the debt leverage and it is too tough the business to run the day to
day activities in the business of the organization. In order to ensure strong working capital of
the organization it is further needed to alleviate the risk associated with the debt leverage of
the business (Pilbeam 2018).

5FINANCE FOR BUSINESS
Efficiency Ratio
2016 2017 2018
0
50
100
150
200
250
300
Efficicency Ratio
Average Trade Receivables turnover
Ratio (365/C) in days Average Trade Payables turnover
Ratio (365/C) in days
Inventory Turnover ratio (A/D)= F
From the above evaluation of the efficiency ratio it can be interpreted that the payable
turnover ratio of the organization is much larger in comparison to the average receivables
turnover ratio of the organization. The inventory turnover ratio of the organization in the year
2016 was highest in comparison to the other year.
⊘ This is a preview!⊘
Do you want full access?
Subscribe today to unlock all pages.

Trusted by 1+ million students worldwide

6FINANCE FOR BUSINESS
In Response to Question 2.4
Analysis of NPV
The above evaluation is based on the information which is provided in case of the
initial scenario of the organization. In such a situation the NPV of the organization along with
the internal rate of return of the organization is satisfactory and the main reason behind it is
that the NPV of the organization is actually positive at the initial stage (Arcand, Berkes and
Panizza 2015).
The above evaluation of the organization is simply based on the worst situation of the
organization where there are certain changes in the parameters which are the unit sales
decrease by 20%; price per unit decreases by 20%; variable cost per unit increases by 20 %;
cash fixed cost per year increases by $100 000. Based on the changes, NPV in the worst
scenario is positive but it is less in comparison to that of the initial scenario.
Paraphrase This Document
Need a fresh take? Get an instant paraphrase of this document with our AI Paraphraser

7FINANCE FOR BUSINESS
The above evaluation of the organization is simply based on the best scenario of the
organization where there are changes in the Unit sales increase by 20%; price per unit
increases by 20%; variable cost per unit decreases by 20%; cash fixed cost per year decreases
by $100 000. Based on the changes the NPV of the organization is positive which actually a
good sign for the business. But the overall NPV of the organization is much higher than the
Initial scenario (Härdle, Chen and Overbeck 2017). The changes will further help the
management or rather the senior level of the organization to go for the best scenario at time
of selecting the project.
Conclusion
From the above discussion it can be said that from the evaluation and interpretation of
the ratio of the organization it can be said that the overall financial performance of the
organization based on the two significant parameters which are the capital structure ratio and
liquidity ratio of the organization is quite satisfactory. But still there are areas where the
management of the organization needs to adopt the significant changes in the business. In
case of the NPV evaluation, the organization must accept the project as the NPV of the
project is positive in each of the three business scenarios.

8FINANCE FOR BUSINESS
References
Arcand, J.L., Berkes, E. and Panizza, U., 2015. Too much finance?. Journal of Economic
Growth, 20(2), pp.105-148.
Fisher, R.C., 2018. State and local public finance. Routledge.
Gitman, L.J., Juchau, R. and Flanagan, J., 2015. Principles of managerial finance. Pearson
Higher Education AU.
Härdle, W.K., Chen, C.Y.H. and Overbeck, L. eds., 2017. Applied quantitative finance (Vol.
2). Springer.
Pilbeam, K., 2018. Finance & financial markets. Macmillan International Higher Education.
Shoup, C., 2017. Public finance. Routledge.
⊘ This is a preview!⊘
Do you want full access?
Subscribe today to unlock all pages.

Trusted by 1+ million students worldwide
1 out of 9
Related Documents
Your All-in-One AI-Powered Toolkit for Academic Success.
+13062052269
info@desklib.com
Available 24*7 on WhatsApp / Email
Unlock your academic potential
Copyright © 2020–2025 A2Z Services. All Rights Reserved. Developed and managed by ZUCOL.


