BUS106 Report: Coca-Cola Amatil Financial Performance Ratio Analysis
VerifiedAdded on 2023/06/07
|11
|2171
|71
Report
AI Summary
This report provides a comprehensive ratio analysis of Coca-Cola Amatil, examining its financial performance and position. The analysis includes key ratios such as current ratio, quick ratio, gross profit margin, return on equity, return on sales, and inventory turnover ratio. The report explains the purpose, scope, and limitations of the analysis, followed by an overview of the company. It then delves into the calculation and interpretation of each ratio, highlighting trends and insights from 2016 to 2017. A comparison of inventory turnover ratios between Coca-Cola Amatil and Blackmore Limited is also presented, providing a comparative perspective on inventory management efficiency. The report concludes with a bibliography of cited sources.
Accounting for Business
Paraphrase This Document
Need a fresh take? Get an instant paraphrase of this document with our AI Paraphraser
Executive Summary
Ratio analysis is a tool that is used to analyse the financial statements in great depth. It helps
us to know about the financial performance and financial position of the company. There are
different categories of ratio that helps us to know the profitability, efficiency as well as
solvency. In this report, a ratio analysis of coca cola amatil has been done which gives us the
true picture of the company’s performance and position. Also there has been a comparison
made between the two company’s inventory turnover ratios. All the ratios have their
individual importance which has been explained in this report.
i
Contents
Executive Summary...............................................................................................................................2
1.0 Introduction.....................................................................................................................................4
1.1 Purpose........................................................................................................................................4
1.2 Scope...........................................................................................................................................4
1.3 Limitations...................................................................................................................................4
2.0 Company Overview..........................................................................................................................5
3.0 RATIO ANALYSIS...............................................................................................................................6
3.1 Current ratio................................................................................................................................6
3.2 Quick ratio..................................................................................................................................6
3.3 Gross profit margin......................................................................................................................7
3.4 Return on equity..........................................................................................................................8
3.5 Return on sales............................................................................................................................8
4.0 Analysis and Comparison using the Inventory Ratio........................................................................9
Bibliography.........................................................................................................................................11
ii
⊘ This is a preview!⊘
Do you want full access?
Subscribe today to unlock all pages.
Trusted by 1+ million students worldwide
1.0 Introduction
1.1 Purpose
The purpose of the following report is to have an insight in the financial performance of the
company Coca Cola Amatil. The following report contains an analysis on the financial data,
which will help us understand the viability of the company. The following will also help us
understand how ratio analysis works and how it can practically be implemented in the real
world. (Atkinson, 2012)
1.2 Scope
The following report include implantation of various ratios and there definition. The same has
been done in relation to the company- Coca Cola Amatil. References to various books based
on ratio analysis and the annual report of the company has been made for this. (Berry, 2009)
1.3 Limitations
Since the ratio analysis of the company has been done based on past data, it does not mean
that the same level of performance can be expected in the coming years. The ratio analysis
tool fails to incorporate qualitative data that are mentions in the notes and which may affect
the affect of the decision maker. Therefore, the results of the report are to be read keeping in
mind these limitations.
1
Paraphrase This Document
Need a fresh take? Get an instant paraphrase of this document with our AI Paraphraser
2.0 Company Overview
The company was originally established in 1904 as British Tobacco (Australia). Later the
company acquired Coca-Cola Bottlers (Perth) in 1964, and began to put it hands in the soft
drinks business. The company then applied for getting listed on the Australian stock
exchange in 1972. (Boyd, 2013)
Coca cola amatil is one of the largest suppliers of non alcoholic drinks in asia pacific region.
It operates in six countries which are- Australia, Fiji, New Zealand, Australia, Papua New
guinea and Samoa. (Datar M. S., 2015)The products that are supplied by the company
includes spring water, soft drinks, energy drinks, fruit juices, coffee, tea as well as flavoured
milk.
This company is listed on the Australian stock exchange and the coca cola company holds
about 29.37% of shareholding in the company. It is usually notices that the coca cola
company holds such huge stakes in the company’s that are involved in this sector. (Datar S. ,
2016)
2
3.0 RATIO ANALYSIS
3.1 Current ratio
Current ratio
Particulars 2016 2017
Current assets 3104.8 2799.6
Current liabilities 1843.1 1838.8
Current ratio
1.6
8
1.5
2
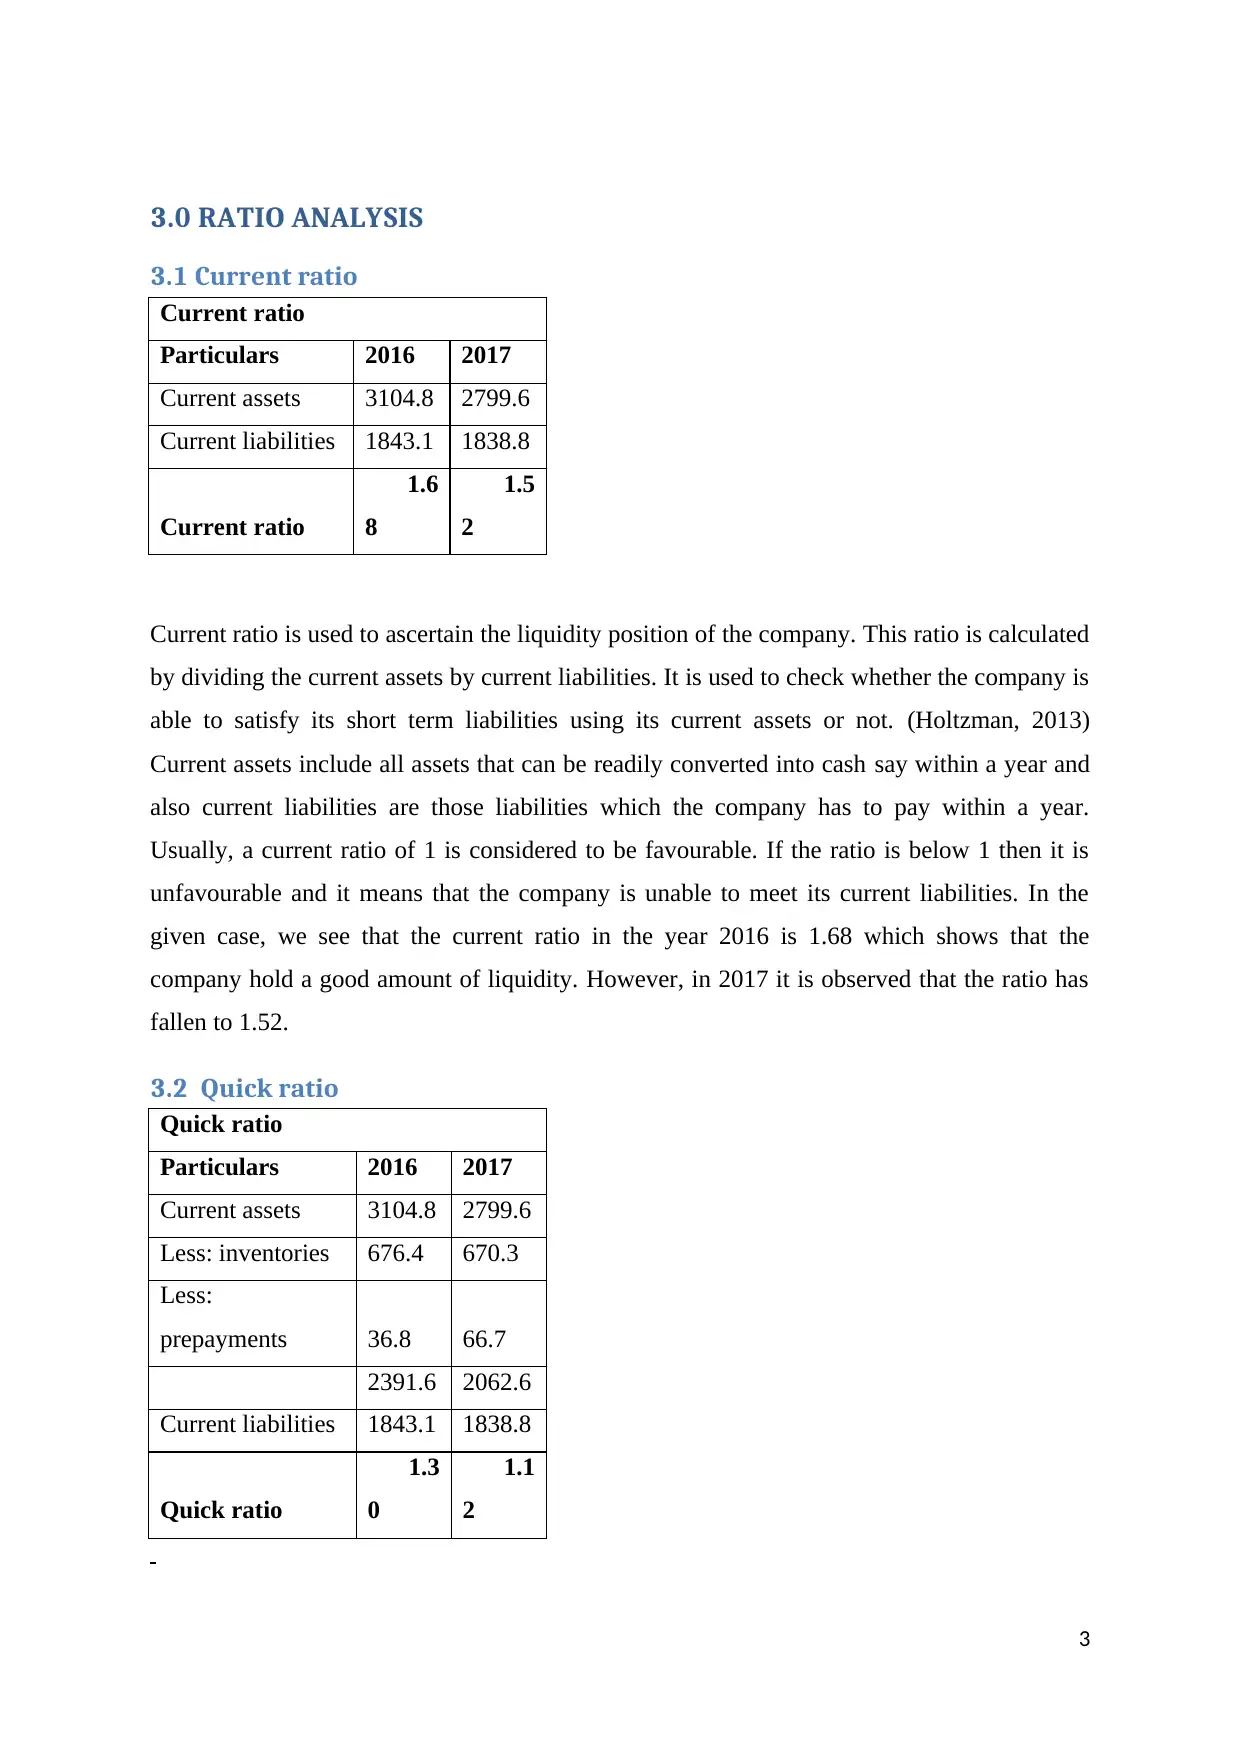
Current ratio is used to ascertain the liquidity position of the company. This ratio is calculated
by dividing the current assets by current liabilities. It is used to check whether the company is
able to satisfy its short term liabilities using its current assets or not. (Holtzman, 2013)
Current assets include all assets that can be readily converted into cash say within a year and
also current liabilities are those liabilities which the company has to pay within a year.
Usually, a current ratio of 1 is considered to be favourable. If the ratio is below 1 then it is
unfavourable and it means that the company is unable to meet its current liabilities. In the
given case, we see that the current ratio in the year 2016 is 1.68 which shows that the
company hold a good amount of liquidity. However, in 2017 it is observed that the ratio has
fallen to 1.52.
3.2 Quick ratio
Quick ratio
Particulars 2016 2017
Current assets 3104.8 2799.6
Less: inventories 676.4 670.3
Less:
prepayments 36.8 66.7
2391.6 2062.6
Current liabilities 1843.1 1838.8
Quick ratio
1.3
0
1.1
2
3
3.1 Current ratio
Current ratio
Particulars 2016 2017
Current assets 3104.8 2799.6
Current liabilities 1843.1 1838.8
Current ratio
1.6
8
1.5
2
Current ratio is used to ascertain the liquidity position of the company. This ratio is calculated
by dividing the current assets by current liabilities. It is used to check whether the company is
able to satisfy its short term liabilities using its current assets or not. (Holtzman, 2013)
Current assets include all assets that can be readily converted into cash say within a year and
also current liabilities are those liabilities which the company has to pay within a year.
Usually, a current ratio of 1 is considered to be favourable. If the ratio is below 1 then it is
unfavourable and it means that the company is unable to meet its current liabilities. In the
given case, we see that the current ratio in the year 2016 is 1.68 which shows that the
company hold a good amount of liquidity. However, in 2017 it is observed that the ratio has
fallen to 1.52.
3.2 Quick ratio
Quick ratio
Particulars 2016 2017
Current assets 3104.8 2799.6
Less: inventories 676.4 670.3
Less:
prepayments 36.8 66.7
2391.6 2062.6
Current liabilities 1843.1 1838.8
Quick ratio
1.3
0
1.1
2
3
⊘ This is a preview!⊘
Do you want full access?
Subscribe today to unlock all pages.
Trusted by 1+ million students worldwide
Quick ratio also helps to know about the liquidity position. However, it is more stringent
measure of liquidity. As we know, in current ratio we take into conisation all the current
assets that are held by the company but in case of quick ratio inventories and prepayments are
subtracted. (Horngren, 2012)The logic behind subtracting these from the current asset is that
the inventories are cannot be cannot be immediately converted into cash. It takes time to get
converted. Quick ratio is a more appropriate measure of liquidity and it actually gives a clear
picture of the liquidity position of the entity. The quick ratio for the year 2016 is 1.30
whereas the current ratio for the same year was 1.68. The difference between both of these
ratios has arisen because we have excluded inventories and prepayments. However, the quick
ratio has fallen from 1.30 to 1.12 in the year 2017 which shows that the company has
minimised keeping or maintain more liquidity than before.
3.3 Gross profit margin
Gross profit margin
Particulars 2016 2017
Gross profit
1911.
1
1865.
9
Sales
5077.
7
4933.
8
Gross profit margin 38% 38%
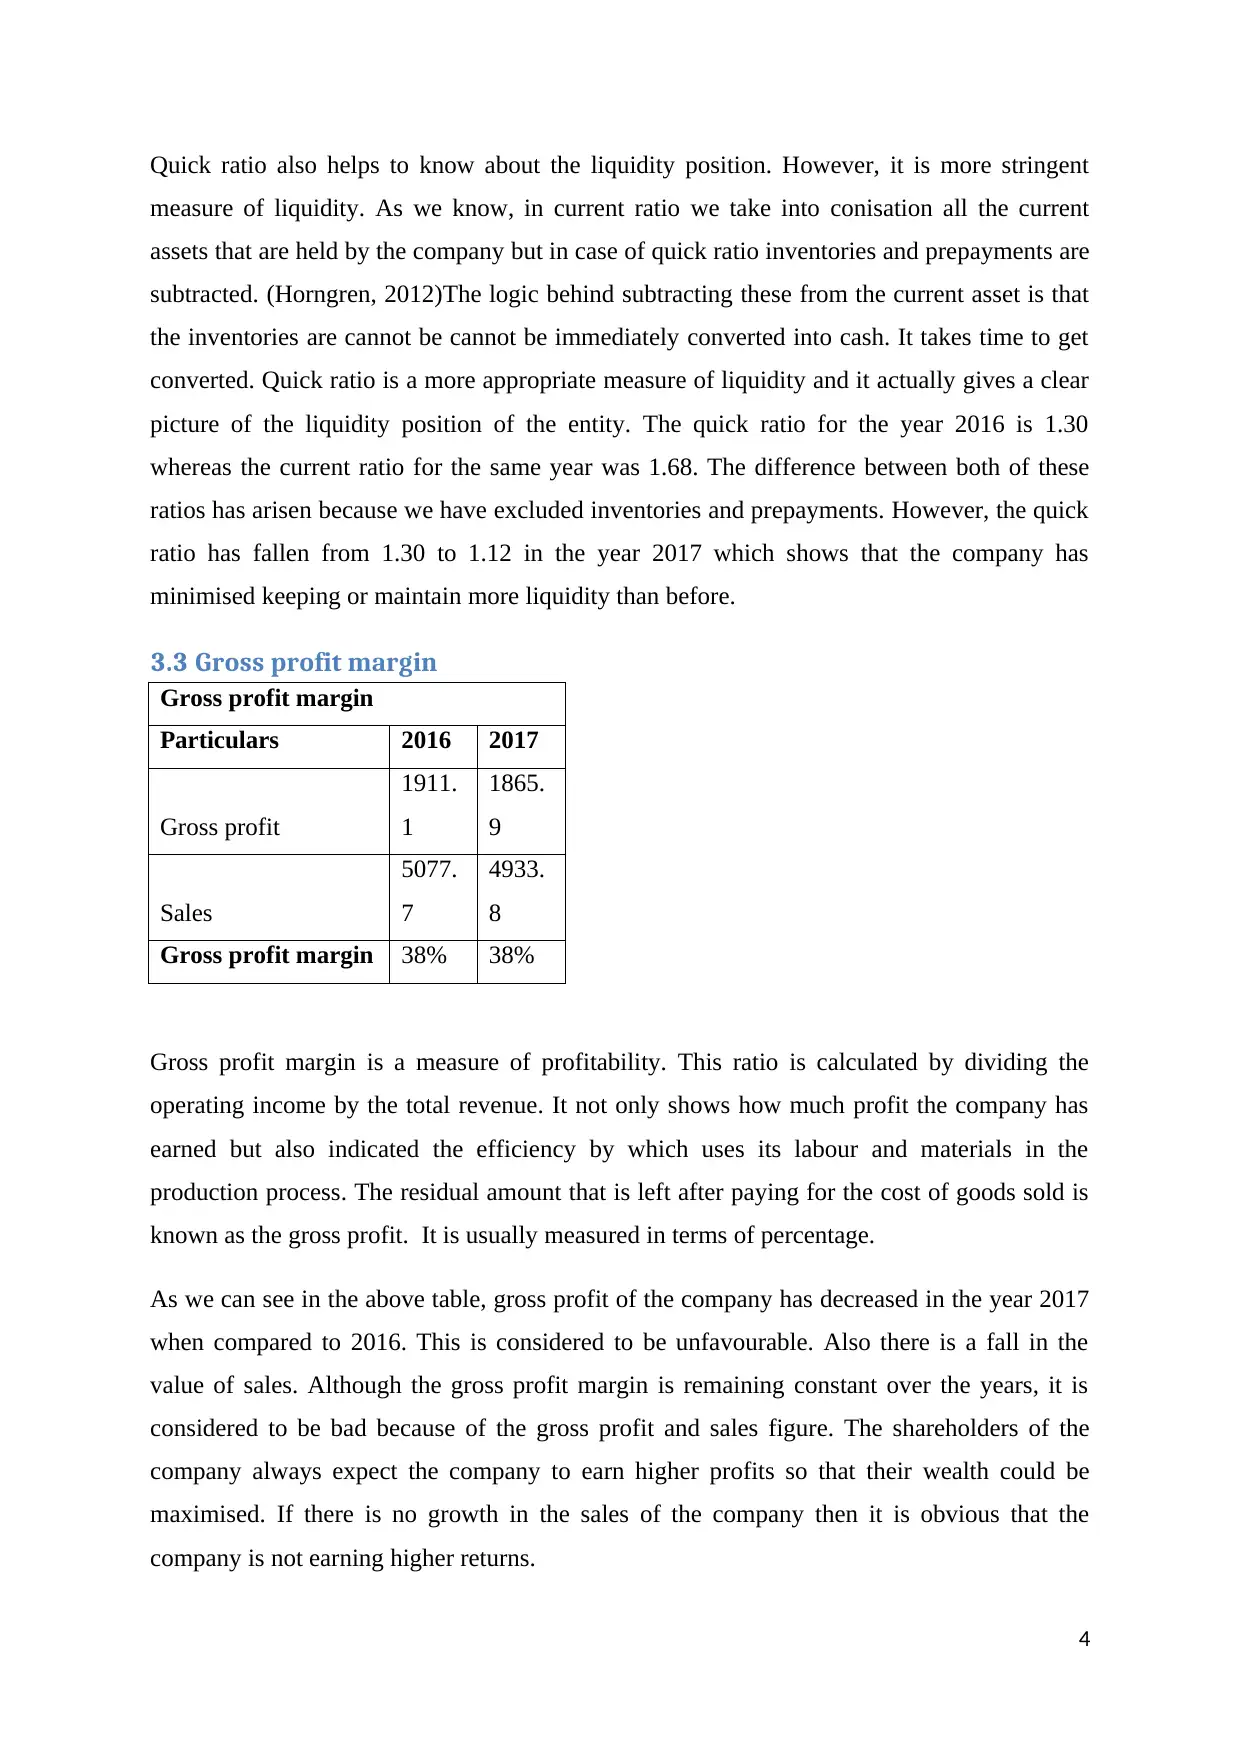
Gross profit margin is a measure of profitability. This ratio is calculated by dividing the
operating income by the total revenue. It not only shows how much profit the company has
earned but also indicated the efficiency by which uses its labour and materials in the
production process. The residual amount that is left after paying for the cost of goods sold is
known as the gross profit. It is usually measured in terms of percentage.
As we can see in the above table, gross profit of the company has decreased in the year 2017
when compared to 2016. This is considered to be unfavourable. Also there is a fall in the
value of sales. Although the gross profit margin is remaining constant over the years, it is
considered to be bad because of the gross profit and sales figure. The shareholders of the
company always expect the company to earn higher profits so that their wealth could be
maximised. If there is no growth in the sales of the company then it is obvious that the
company is not earning higher returns.
4
measure of liquidity. As we know, in current ratio we take into conisation all the current
assets that are held by the company but in case of quick ratio inventories and prepayments are
subtracted. (Horngren, 2012)The logic behind subtracting these from the current asset is that
the inventories are cannot be cannot be immediately converted into cash. It takes time to get
converted. Quick ratio is a more appropriate measure of liquidity and it actually gives a clear
picture of the liquidity position of the entity. The quick ratio for the year 2016 is 1.30
whereas the current ratio for the same year was 1.68. The difference between both of these
ratios has arisen because we have excluded inventories and prepayments. However, the quick
ratio has fallen from 1.30 to 1.12 in the year 2017 which shows that the company has
minimised keeping or maintain more liquidity than before.
3.3 Gross profit margin
Gross profit margin
Particulars 2016 2017
Gross profit
1911.
1
1865.
9
Sales
5077.
7
4933.
8
Gross profit margin 38% 38%
Gross profit margin is a measure of profitability. This ratio is calculated by dividing the
operating income by the total revenue. It not only shows how much profit the company has
earned but also indicated the efficiency by which uses its labour and materials in the
production process. The residual amount that is left after paying for the cost of goods sold is
known as the gross profit. It is usually measured in terms of percentage.
As we can see in the above table, gross profit of the company has decreased in the year 2017
when compared to 2016. This is considered to be unfavourable. Also there is a fall in the
value of sales. Although the gross profit margin is remaining constant over the years, it is
considered to be bad because of the gross profit and sales figure. The shareholders of the
company always expect the company to earn higher profits so that their wealth could be
maximised. If there is no growth in the sales of the company then it is obvious that the
company is not earning higher returns.
4
Paraphrase This Document
Need a fresh take? Get an instant paraphrase of this document with our AI Paraphraser
3.4 Return on equity
Return on equity
Particulars 2016 2017
Net income 257.3 461
Total equity
2274.
2
1880.
3
Return on equity 11% 25%
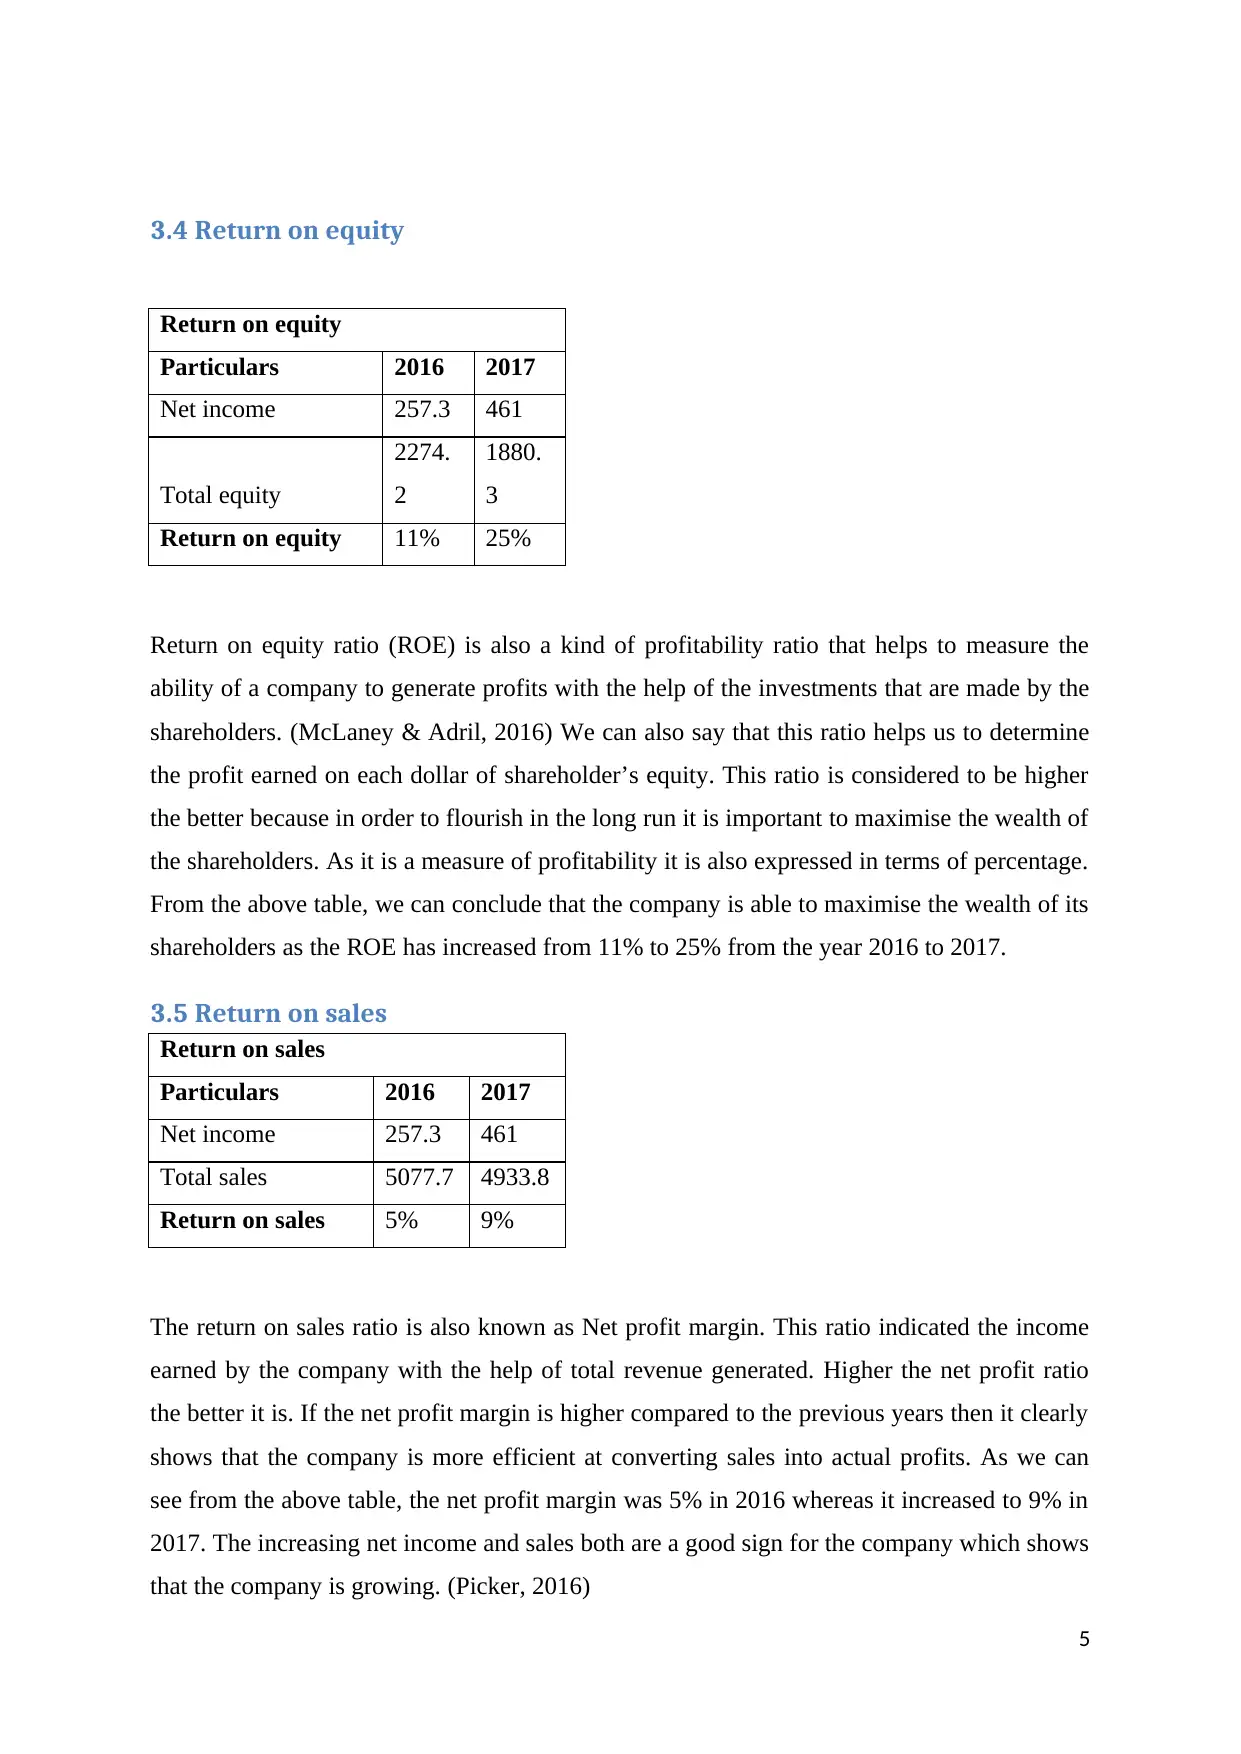
Return on equity ratio (ROE) is also a kind of profitability ratio that helps to measure the
ability of a company to generate profits with the help of the investments that are made by the
shareholders. (McLaney & Adril, 2016) We can also say that this ratio helps us to determine
the profit earned on each dollar of shareholder’s equity. This ratio is considered to be higher
the better because in order to flourish in the long run it is important to maximise the wealth of
the shareholders. As it is a measure of profitability it is also expressed in terms of percentage.
From the above table, we can conclude that the company is able to maximise the wealth of its
shareholders as the ROE has increased from 11% to 25% from the year 2016 to 2017.
3.5 Return on sales
Return on sales
Particulars 2016 2017
Net income 257.3 461
Total sales 5077.7 4933.8
Return on sales 5% 9%
The return on sales ratio is also known as Net profit margin. This ratio indicated the income
earned by the company with the help of total revenue generated. Higher the net profit ratio
the better it is. If the net profit margin is higher compared to the previous years then it clearly
shows that the company is more efficient at converting sales into actual profits. As we can
see from the above table, the net profit margin was 5% in 2016 whereas it increased to 9% in
2017. The increasing net income and sales both are a good sign for the company which shows
that the company is growing. (Picker, 2016)
5
Return on equity
Particulars 2016 2017
Net income 257.3 461
Total equity
2274.
2
1880.
3
Return on equity 11% 25%
Return on equity ratio (ROE) is also a kind of profitability ratio that helps to measure the
ability of a company to generate profits with the help of the investments that are made by the
shareholders. (McLaney & Adril, 2016) We can also say that this ratio helps us to determine
the profit earned on each dollar of shareholder’s equity. This ratio is considered to be higher
the better because in order to flourish in the long run it is important to maximise the wealth of
the shareholders. As it is a measure of profitability it is also expressed in terms of percentage.
From the above table, we can conclude that the company is able to maximise the wealth of its
shareholders as the ROE has increased from 11% to 25% from the year 2016 to 2017.
3.5 Return on sales
Return on sales
Particulars 2016 2017
Net income 257.3 461
Total sales 5077.7 4933.8
Return on sales 5% 9%
The return on sales ratio is also known as Net profit margin. This ratio indicated the income
earned by the company with the help of total revenue generated. Higher the net profit ratio
the better it is. If the net profit margin is higher compared to the previous years then it clearly
shows that the company is more efficient at converting sales into actual profits. As we can
see from the above table, the net profit margin was 5% in 2016 whereas it increased to 9% in
2017. The increasing net income and sales both are a good sign for the company which shows
that the company is growing. (Picker, 2016)
5
4.0 Analysis and Comparison using the Inventory Ratio
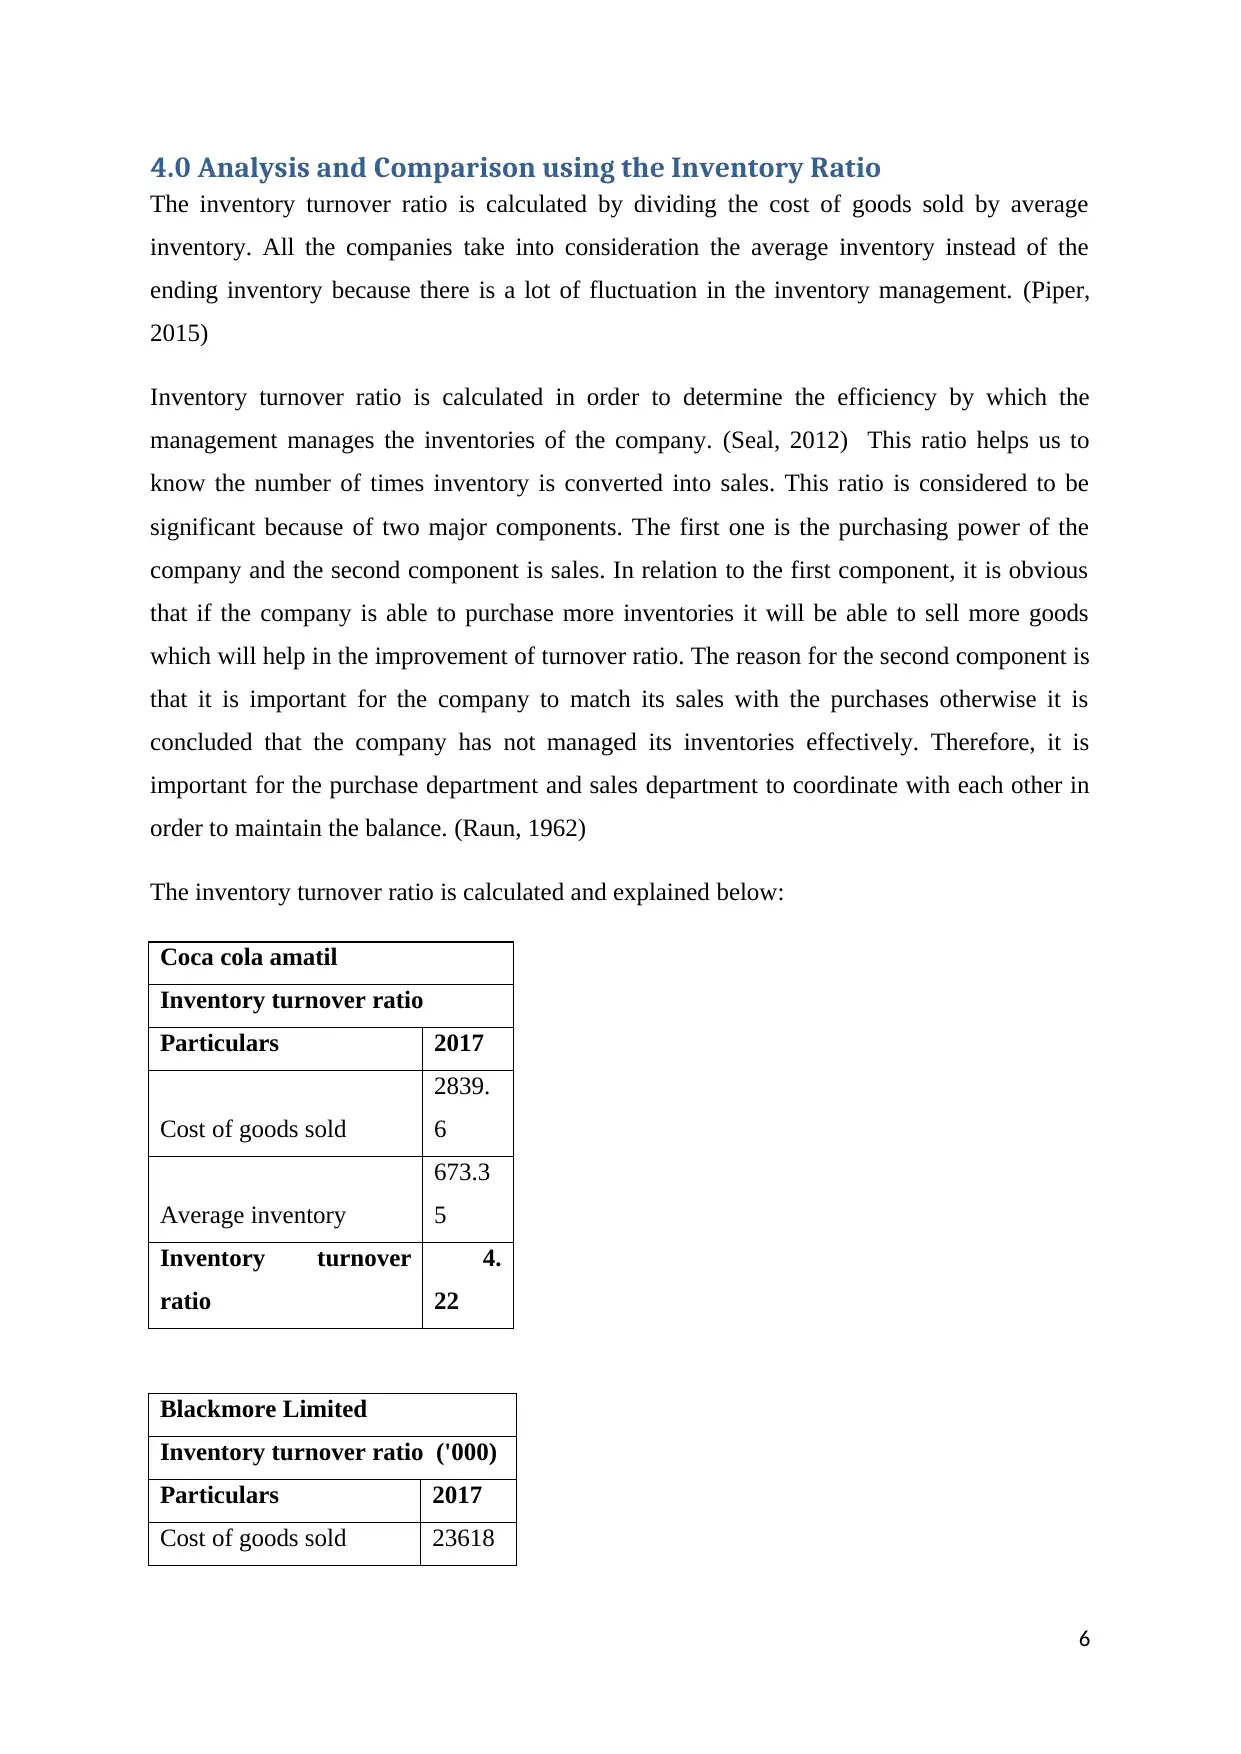
The inventory turnover ratio is calculated by dividing the cost of goods sold by average
inventory. All the companies take into consideration the average inventory instead of the
ending inventory because there is a lot of fluctuation in the inventory management. (Piper,
2015)
Inventory turnover ratio is calculated in order to determine the efficiency by which the
management manages the inventories of the company. (Seal, 2012) This ratio helps us to
know the number of times inventory is converted into sales. This ratio is considered to be
significant because of two major components. The first one is the purchasing power of the
company and the second component is sales. In relation to the first component, it is obvious
that if the company is able to purchase more inventories it will be able to sell more goods
which will help in the improvement of turnover ratio. The reason for the second component is
that it is important for the company to match its sales with the purchases otherwise it is
concluded that the company has not managed its inventories effectively. Therefore, it is
important for the purchase department and sales department to coordinate with each other in
order to maintain the balance. (Raun, 1962)
The inventory turnover ratio is calculated and explained below:
Coca cola amatil
Inventory turnover ratio
Particulars 2017
Cost of goods sold
2839.
6
Average inventory
673.3
5
Inventory turnover
ratio
4.
22
Blackmore Limited
Inventory turnover ratio ('000)
Particulars 2017
Cost of goods sold 23618
6
⊘ This is a preview!⊘
Do you want full access?
Subscribe today to unlock all pages.
Trusted by 1+ million students worldwide
4
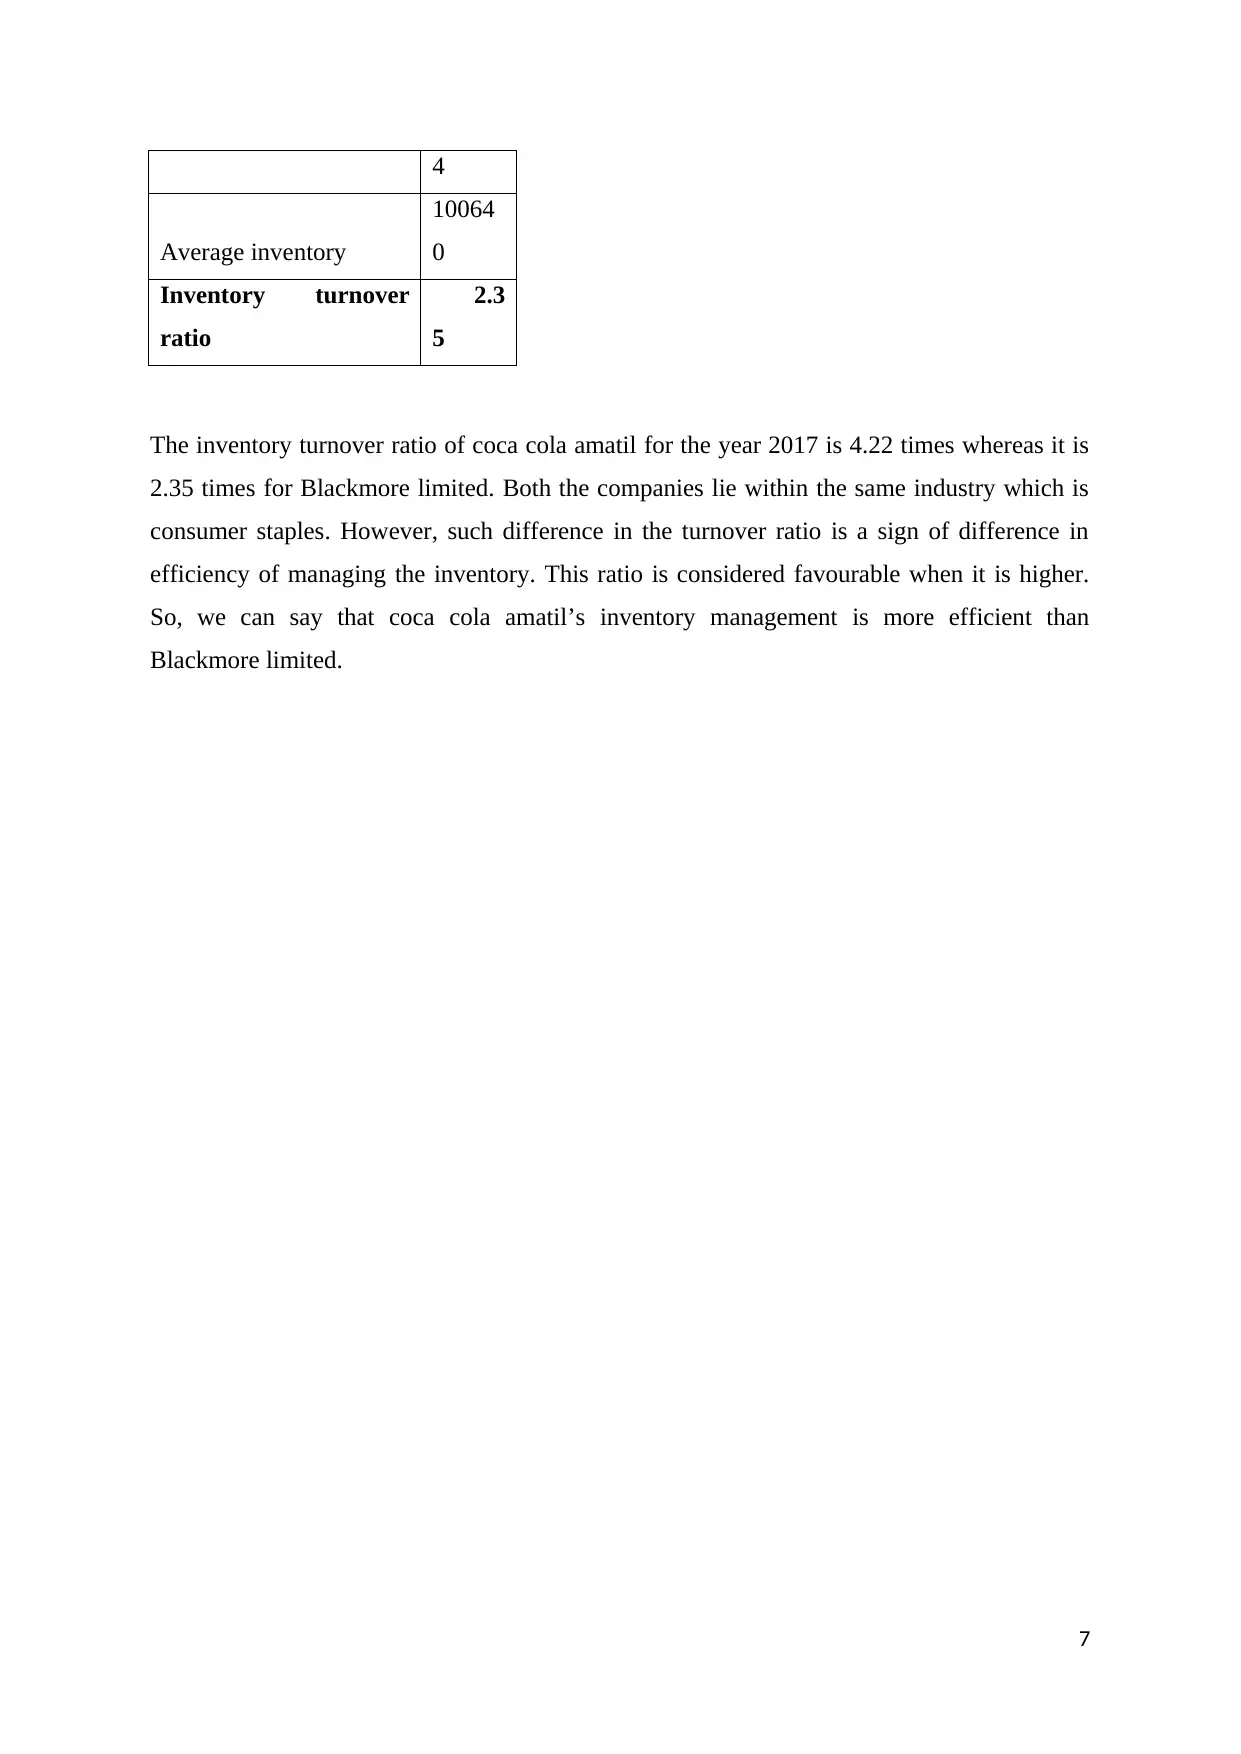
Average inventory
10064
0
Inventory turnover
ratio
2.3
5
The inventory turnover ratio of coca cola amatil for the year 2017 is 4.22 times whereas it is
2.35 times for Blackmore limited. Both the companies lie within the same industry which is
consumer staples. However, such difference in the turnover ratio is a sign of difference in
efficiency of managing the inventory. This ratio is considered favourable when it is higher.
So, we can say that coca cola amatil’s inventory management is more efficient than
Blackmore limited.
7
Paraphrase This Document
Need a fresh take? Get an instant paraphrase of this document with our AI Paraphraser
Bibliography
Atkinson, A. A. (2012). Management accounting. Upper Saddle River, N.J.: Paerson.
Berry, L. E. (2009). Management accounting demystified. New York: McGraw-Hill.
Boyd, W. K. (2013). Cost Accounting For Dummies. Hoboken: Wiley.
Datar, M. S. (2015). Cost accounting. Boston: Pearson.
Datar, S. (2016). Horngren's Cost Accounting: A Managerial Emphasis. Hoboken: Wiley.
Holtzman, M. (2013). Managerial Accounting For Dummies. Hoboken, NJ: Wiley.
Horngren, C. (2012). Cost accounting. Upper Saddle River, N.J.: Pearson/Prentice Hall.
McLaney, E., & Adril, D. P. (2016). Accounting and Finance: An Introduction. United
Kingdom: Pearson.
Picker, R. (2016). Australian accounting standards. Milton, Qld.: John Wiley & Sons.
Piper, M. (2015). Accounting made simple. United States: CreateSpace Pub.
Raun, D. L. (1962). What is Accounting? The Accounting Review , 769-773.
Seal, W. (2012). Management accounting. Maidenhead: McGraw-Hill Higher Education.
8
1 out of 11
Related Documents


Your All-in-One AI-Powered Toolkit for Academic Success.
+13062052269
info@desklib.com
Available 24*7 on WhatsApp / Email
![[object Object]](/_next/static/media/star-bottom.7253800d.svg)
Unlock your academic potential
Copyright © 2020–2026 A2Z Services. All Rights Reserved. Developed and managed by ZUCOL.