Fundamentals of Microeconomics: Coca-Cola Supply and Demand Analysis
VerifiedAdded on 2021/07/09
|9
|2295
|227
Report
AI Summary
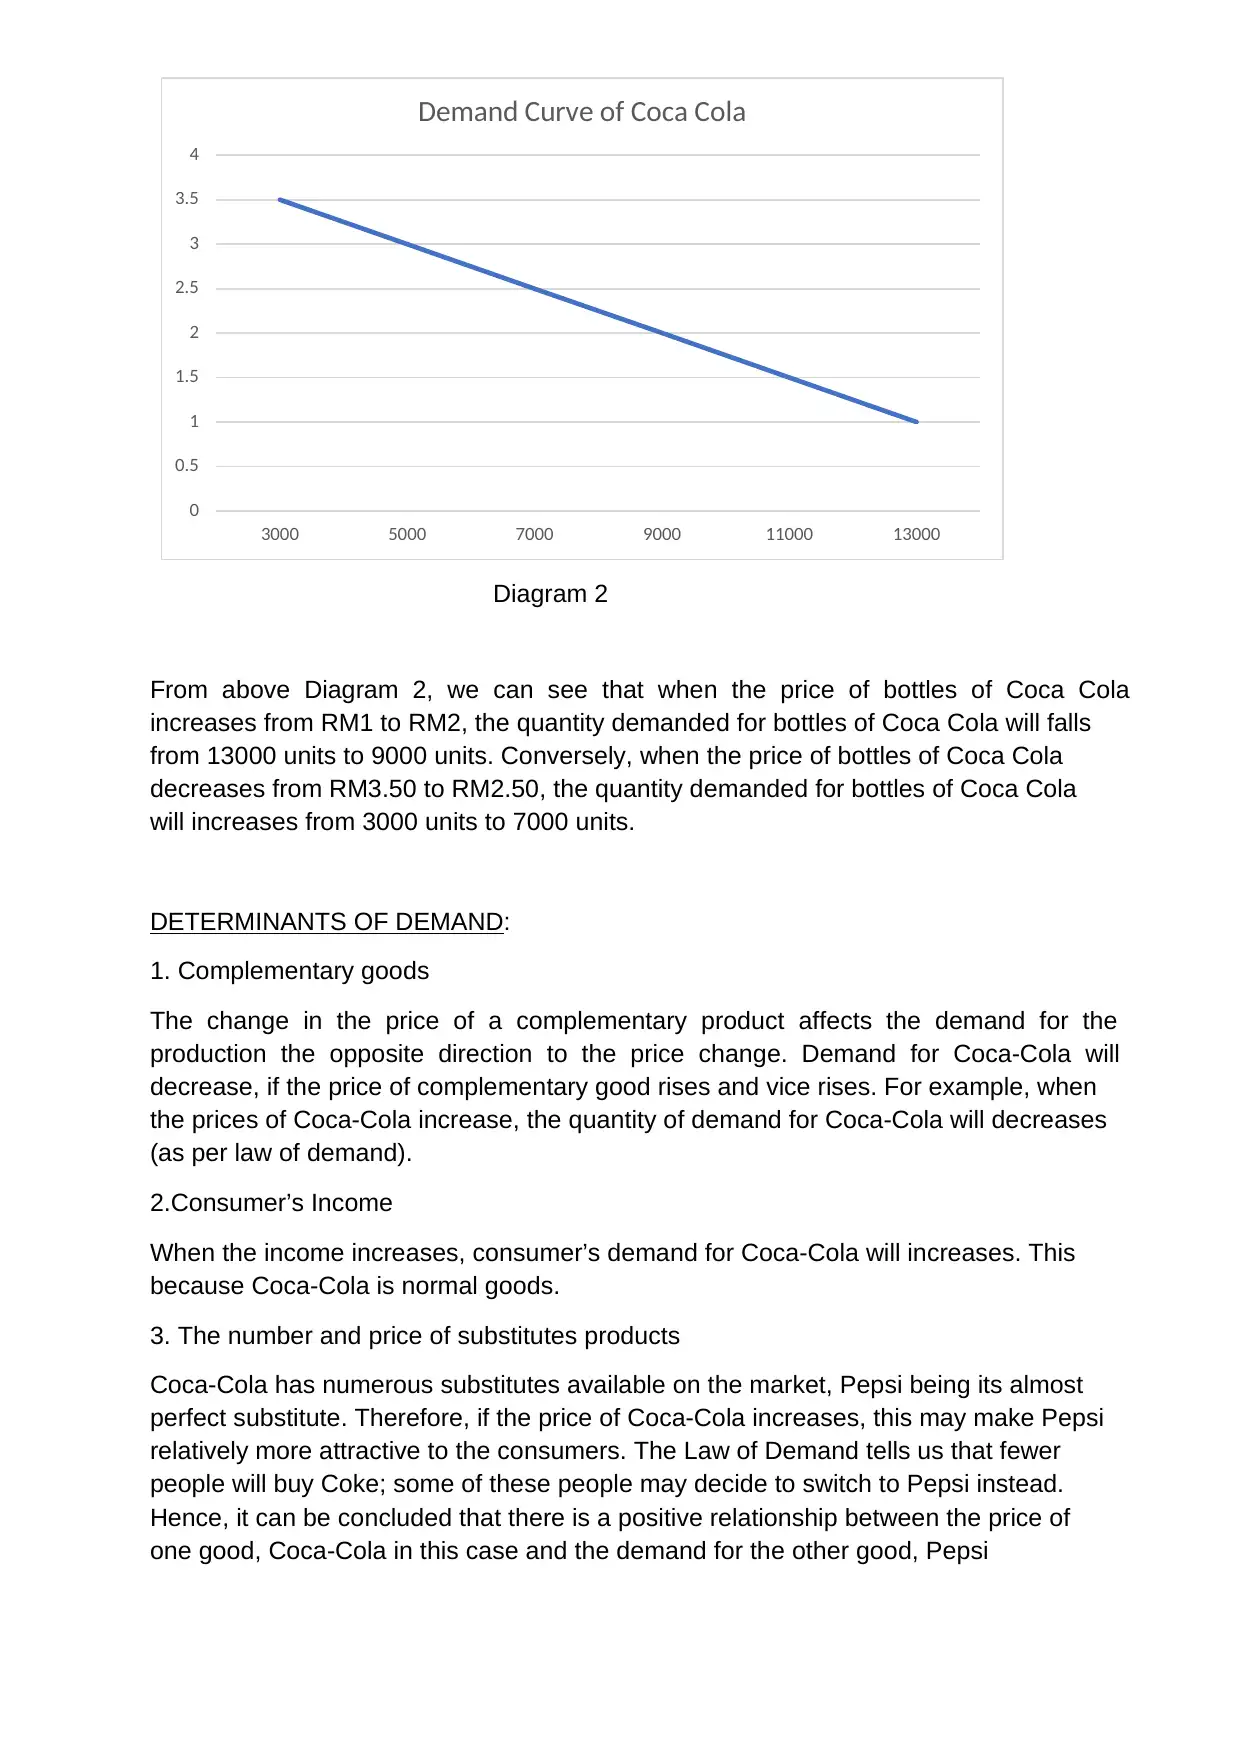
This report provides a comprehensive analysis of Coca-Cola's supply and demand dynamics within a microeconomic framework. It begins by defining supply and demand, outlining the laws governing each, and illustrating them with hypothetical supply and demand curves specific to Coca-Cola. The re...
Read More
Contribute Materials
Your contribution can guide someone’s learning journey. Share your
documents today.

k
ECO162
Fundamentals of Microeconomic
Title:
Coca-Cola Supply and Demand Analysis
ECO162
Fundamentals of Microeconomic
Title:
Coca-Cola Supply and Demand Analysis
Secure Best Marks with AI Grader
Need help grading? Try our AI Grader for instant feedback on your assignments.

INTRODUCTION
This assignment is about the supply and demand of Coca-Cola according to the
market. In this assignment we are be able to know about the supply and demand of
Coca-Cola according to the change in consumers behaviourism depending on the
price of Coca-Cola in the market. Coca-Cola is carbonated soft drinks which also
known as Coke. Coca-Cola was introduced to public on 8th May 1886. Coca-Cola was
the first company in the world that is produced non-alcoholic beverage and became
most successful company in the United States. The company is one of the famous
brands in the world. According to the data the company has more than 80% operating
profit from other countries which is 95% of the world known about the Coca-Cola.
Overall, in this assignment we are going to dive in the supply and demand analysis of
Coca Cola as well as the elasticity and the nature of monopolistic competition of Coca
Cola.
SUPPLY
Definition of Supply
Supply is defined as the ability and willingness of the producers to supply goods and
services at different quantities based on different prices and time.
Law of Supply
The supply of Coca-Cola is normal goods. This is stated on the law of supply where,
when the price of Coca-Cola increases, the quantity supplied for Coca-Cola also
increase and when the price of Coca-Cola decreases, it will also make the quantity
supplied for Coca-Cola decrease. Coca Cola has a positive relationship between the
price and quantity supplied. The graph shows upward slopping supply curve where it
indicates a positive relationship between the price and the quantity of Coca-Cola.
The following is the hypothetical supply curve for Coca-Cola:
Quantity Coca-Cola Supplied (bottle) Price (RM)
3000 1.00
5000 1.50
7000 2.00
9000 2.50
11000 3.00
13000 3.50

Diagram 1
From above Diagram 1, we can see that when the price of bottles of Coca Cola
increases from RM1 to RM2, the quantity supplied for bottles of Coca Cola also
increases from 3000 units to 7000 units. Similarly, when the price of bottles of Coca
Cola decreases from RM3.50 to RM2.50, the quantity supplied also decreases from
13000 units to 9000 units.
DETERMINANTS OF SUPPLY:
1. Cost and availability of the factors of production
In one bottle of coca cola, it needs a lot of ingredients such as sugar, natural
flavourings and caffeine. For example, if the price of the sugar increases which is
increases in cost of production, most likely the supplier will decrease the production of
the Coca-Cola. This will show in the supply curve where it will lead to left ward shift.
2. Level of technology
The level of technology that have been used to make Coca-Cola is getting advance
year by year. This eventually will help to decrease the cost of production. This also will
make the supplier willingly to supply more amount of Coca-Cola at the same price.
The graph will show that there will be a right shift in supply curve.
3. Number of suppliers
In Coca-Cola case, if the number of Coca-Cola supplier in one market increase, this
will also make the supply of the goods which is Coca-Cola also increase. This will also
show the right shift in supply curve on the graph.
0
0.5
1
1.5
2
2.5
3
3.5
4
3000 5000 7000 9000 11000 13000
Supply Curve

DEMAND
Definition of Demand
Demand is defined as the ability and willingness to buy specific quantities of goods in
a given period of time at a particular price, ceteris paribus. Ceteris paribus is a Latin
phrase that means holding other factors constant while some other factor changed.
Demand is different form desire, want, wish and the like. A mere desire or want for a
product will not cause producers to produce that product and place it in market. The
person who desires or wants to have a product must have ability to buy and be willing
to pay for that product only then is that desire called a demand.
Law of Demand
As stated before Coca Cola is a normal good. In the law of demand where when the
price of Coca Cola decreases, the quantity demanded will increases. Contradicting
with that, when the price of Coca Cola increases, quantity demanded for Coca Cola
will decrease. Coca Cola shows an inverse relationship between the price and quantity
demanded. Therefore, Diagram 2 shows a downward slopping demand curve where
it indicates a negative relationship between the price and quantity demanded for Coca
Cola.
The following is the hypothetical demand curve for Coca Cola:
Price of Coca-Cola (RM) Quantity of Coca Cola bottles demanded
1.00 13000
1.50 11000
2.00 9000
2.50 7000
3.00 5000
3.50 3000
Secure Best Marks with AI Grader
Need help grading? Try our AI Grader for instant feedback on your assignments.

Diagram 2
From above Diagram 2, we can see that when the price of bottles of Coca Cola
increases from RM1 to RM2, the quantity demanded for bottles of Coca Cola will falls
from 13000 units to 9000 units. Conversely, when the price of bottles of Coca Cola
decreases from RM3.50 to RM2.50, the quantity demanded for bottles of Coca Cola
will increases from 3000 units to 7000 units.
DETERMINANTS OF DEMAND:
1. Complementary goods
The change in the price of a complementary product affects the demand for the
production the opposite direction to the price change. Demand for Coca-Cola will
decrease, if the price of complementary good rises and vice rises. For example, when
the prices of Coca-Cola increase, the quantity of demand for Coca-Cola will decreases
(as per law of demand).
2.Consumer’s Income
When the income increases, consumer’s demand for Coca-Cola will increases. This
because Coca-Cola is normal goods.
3. The number and price of substitutes products
Coca-Cola has numerous substitutes available on the market, Pepsi being its almost
perfect substitute. Therefore, if the price of Coca-Cola increases, this may make Pepsi
relatively more attractive to the consumers. The Law of Demand tells us that fewer
people will buy Coke; some of these people may decide to switch to Pepsi instead.
Hence, it can be concluded that there is a positive relationship between the price of
one good, Coca-Cola in this case and the demand for the other good, Pepsi
0
0.5
1
1.5
2
2.5
3
3.5
4
3000 5000 7000 9000 11000 13000
Demand Curve of Coca Cola

ELASTICITY
Elasticity refers to the relative responsiveness of a demand or supply curve in relation
to any of its determinants. In other words, elasticity measures the responsiveness of
one variable to a change in another variable. Elasticity can be compared roughly by
the slope of a demand curve, using the steepness or flatness of the demand or supply
curve. A product can be considered elastic of the quantity demand of the products
changes drastically when its price increases or decreases. Conversely, a product is
considered to be inelastic if the quantity demand of the products changes very little
when its price fluctuates.
Price of Elasticity Demand
Price of elasticity demand measures the degree of responsiveness of the quantity
demanded for a particular good, with the respect to the changes in price.
• Factors influencing price of elasticity of demand:
1. Consumer’s habit
For consumers who are habituated or accustomed to consuming a particular goods,
in this case, Coca-Cola, the demand for this soft drink will be inelastic because it has
become an essential item to them.
2. Availability of substitutes
A good with more substitutes will have a higher elasticity. Consumer can respond to a
rise in price by switching to a substitute. In the case of Coca-Cola, the market is full
with substitutes that are available such as Pepsi, Fanta, Mountain Dew and Mirinda.
Therefore, when the price for Coca-Cola increases the consumers will shift their
consumption from this drink to any other related substitutes.
3. Level of income
Those with higher incomes generally have an inelastic demand because, having more
money, means they are less sensitive to any sorts of insignificant price changes. On
the other hand, those whom came from middle income group have an elastic demand,
whereby they are sensitive to any sorts of price changes as it will affect their budget
considerably.

Price of Elasticity Supply
Price elasticity of supply measures the degree of responsiveness of the quantity
supplied for a particular good, with respect to a change in price.
• Factor influencing price of elasticity supply:
1. Ease of entry into the market
Coca-Cola are included in monopolistic market meaning that it is easier to enter into
market as compared to pure monopoly.
2. Level of technology
As the market is dynamic and changes quickly, it is evident that Coca-Cola always
have the latest technology involved in their productions. As a result, this will cause the
process of production faster. The higher the technology level, the more price elastic
the quantity supplied will be.
3. Perishables vs. non-perishables
Perishable goods such as fruits and vegetables have a limited shelf life, so any
changes in price will not change supply by a lot. Hence, the price is inelastic. On the
other hand, Coca-Cola are a non-perishable goods that are safe past the date
stamped on the container. Consequently, any changes in price will change the supply
and the supply price is elastic.
MONOPOLISTIC COMPETITION
Characteristics
• Differentiated products
Coca Cola Co. has been a leader in the carbonated drink industry for years on the
monopoly competition market. The carbonated beverage industry contains relatively
large number of producers, making it part of the monopolistic competitive market. Firm
in monopolistic market produce differentiated products with close substitute available
in the market. For examples they’ll sell the carbonated drinks in a lot of forms and
ways such as in a bottle ranging from 500ml to 1l and in a can. These products are
also can be bought individually in a carton whether it is in a bottle from or a can form.
Paraphrase This Document
Need a fresh take? Get an instant paraphrase of this document with our AI Paraphraser

• Advertising is needed
The monopolistic competitors need to advertise their products to create awareness
among the consumers about the existence of their products. This is to create an
increase of the demand of said products. For Coca-Cola they have to compete against
a big brand such as Pepsi that have their own unique way of advertising their products.
Pepsi always hire well-known celebrities such as Beyonce, Brtiney Spears, Kylie
Jenner and just recently they signed on K-pop group Blackpink as their new
ambassador. In the other side, Coca-Cola always use a creative and memorable
advertisement. For instance, they held a campaign with placing most popular
Australian names on their bottle and proved success as its spread to the rest of the
world.
• Less control over price
Due to the huge amounts of potential substitutes for carbonated drinks, Coca-Cola
tends to set its price at a level where no one can offer to its consumers. This is the
reason why Coca-Cola will charge the same price as are being charged by their
competitors. Otherwise consumers may find substitutes in case the price of Coca-Cola
increase.
Conclusion
In conclusion, supply and demand are very important determinant in the markets. This
is because, the price of goods is based on these two determinants. So, this will make
the market work in the best condition when supply and demand determine the price of
Coca Cola. If the supply of Coca Cola complements the demand of Coca Cola, the
price of Coca Cola will be equilibrium. If the price of Coca Cola increase, this will make
the supplier want to supply more and exceed the demand of Coca Cola. This will cause
extra supply of Coca Cola. If the price of Coca Cola decrease, the demand of Coca
Cola will exceed the supply of Coca Cola. This will cause shortage of Coca Cola.

Reference
1. “AmosWEB Is Economics: Encyclonomic WEB*pedia.” Amosweb.com, 2021,
www.amosweb.com/cgi-
bin/awb_nav.pl?s=wpd&c=dsp&k=number+of+sellers,+supply+determinant#:~
:text=NUMBER%20OF%20SELLERS%2C%20SUPPLY%20DETERMINANT,
supply%20curve%20when%20they%20change
2. “Law of Supply and Demand Definition.” Investopedia, 2021,
www.investopedia.com/terms/l/law-of-supply-demand.asp
3. “Reading: What Is Supply? | Microeconomics.” Lumenlearning.com, 2021,
https://courses.lumenlearning.com/suny-microeconomics/chapter/reading-
what-is-supply/
4. Mulcahy, Emma. 2019. “Coca-Cola Ads: 8 of Its Most Memorable
Campaigns.” The Drum. The Drum. May 23, 2019.
https://www.thedrum.com/news/2019/05/23/coca-cola-ads-8-its-most-
memorable-campaigns.
5. Ritesh Pathak. 2020. “How Coca-Cola Uses Technology to Stay at the Top? |
Analytics Steps.” AnalyticsSteps. 2020.
https://www.analyticssteps.com/blogs/how-coca-cola-uses-technology-stay-
top.
1 out of 9
Related Documents

Your All-in-One AI-Powered Toolkit for Academic Success.
+13062052269
info@desklib.com
Available 24*7 on WhatsApp / Email
Unlock your academic potential
© 2024 | Zucol Services PVT LTD | All rights reserved.