ECON 301: Regression Analysis of Cocaine Price, Quantity, and Quality
VerifiedAdded on 2021/04/16
|5
|1103
|160
Homework Assignment
AI Summary
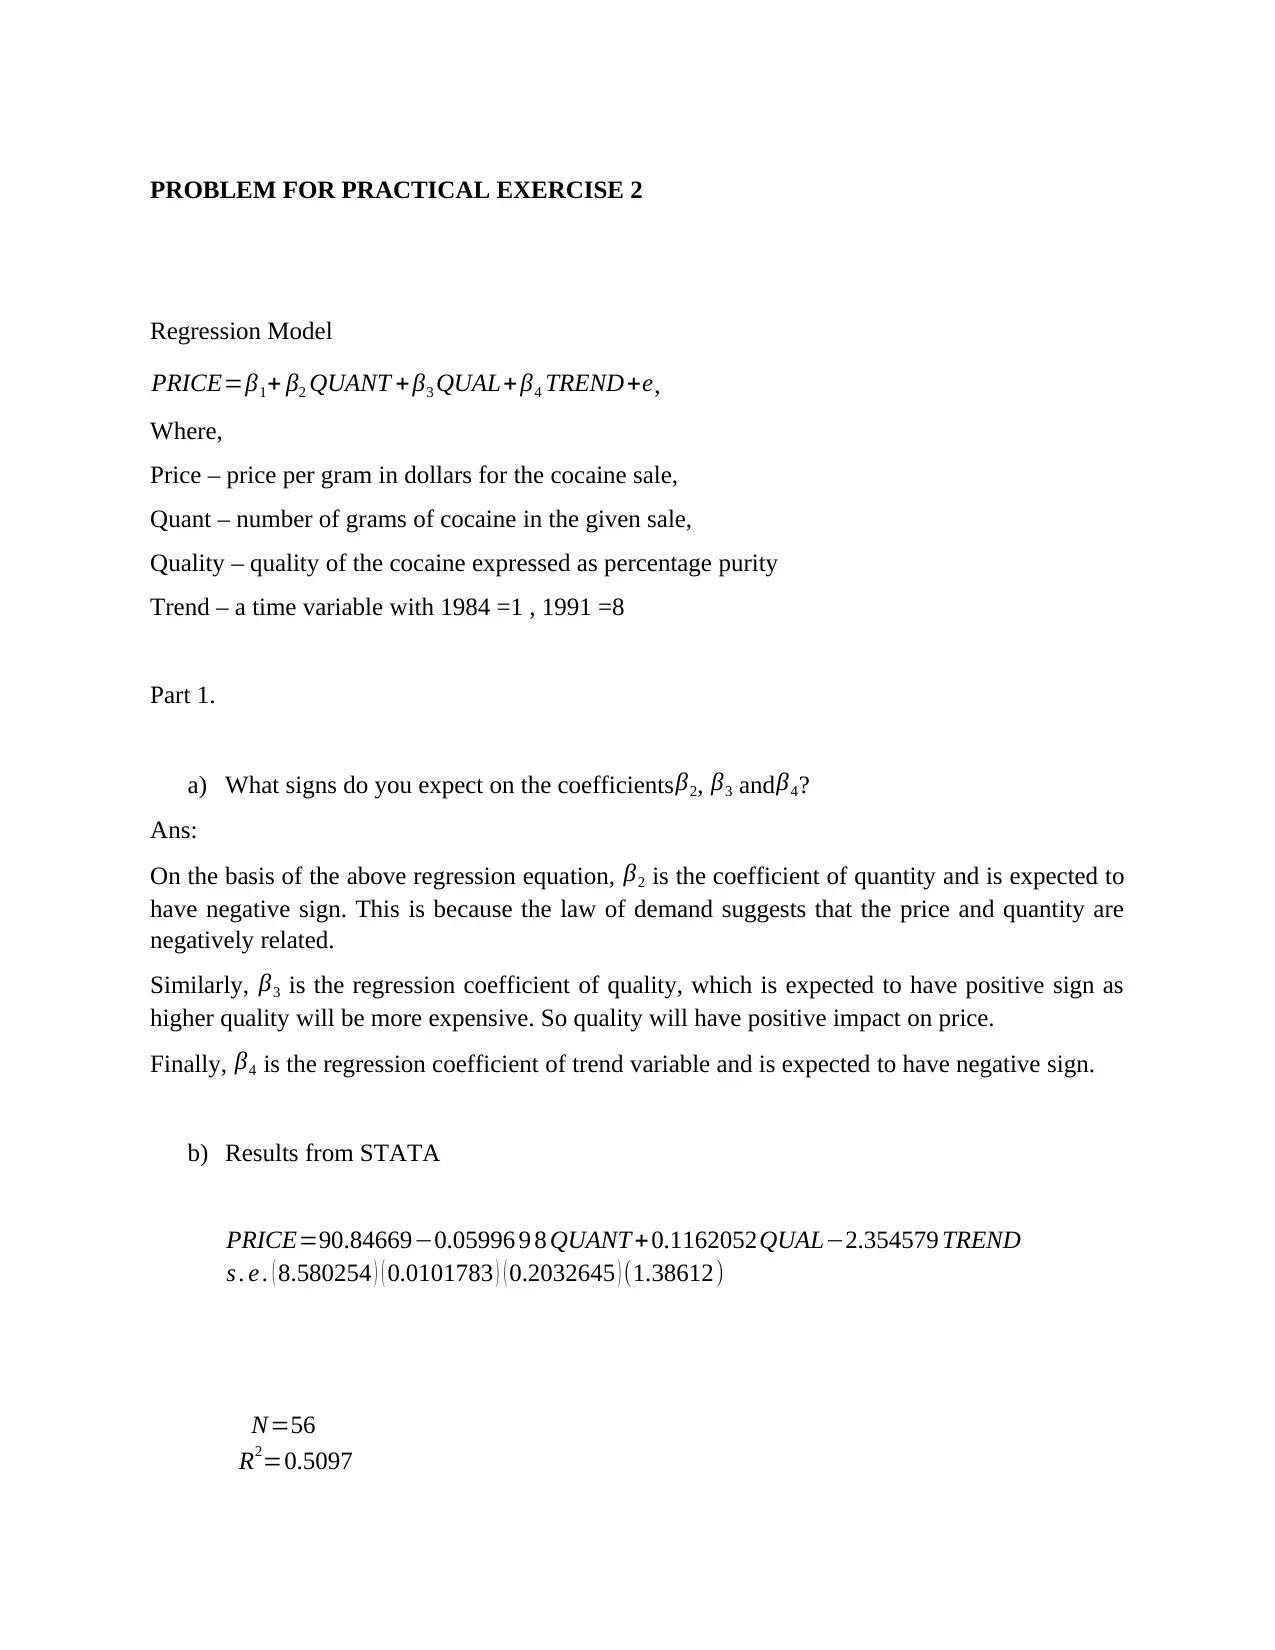
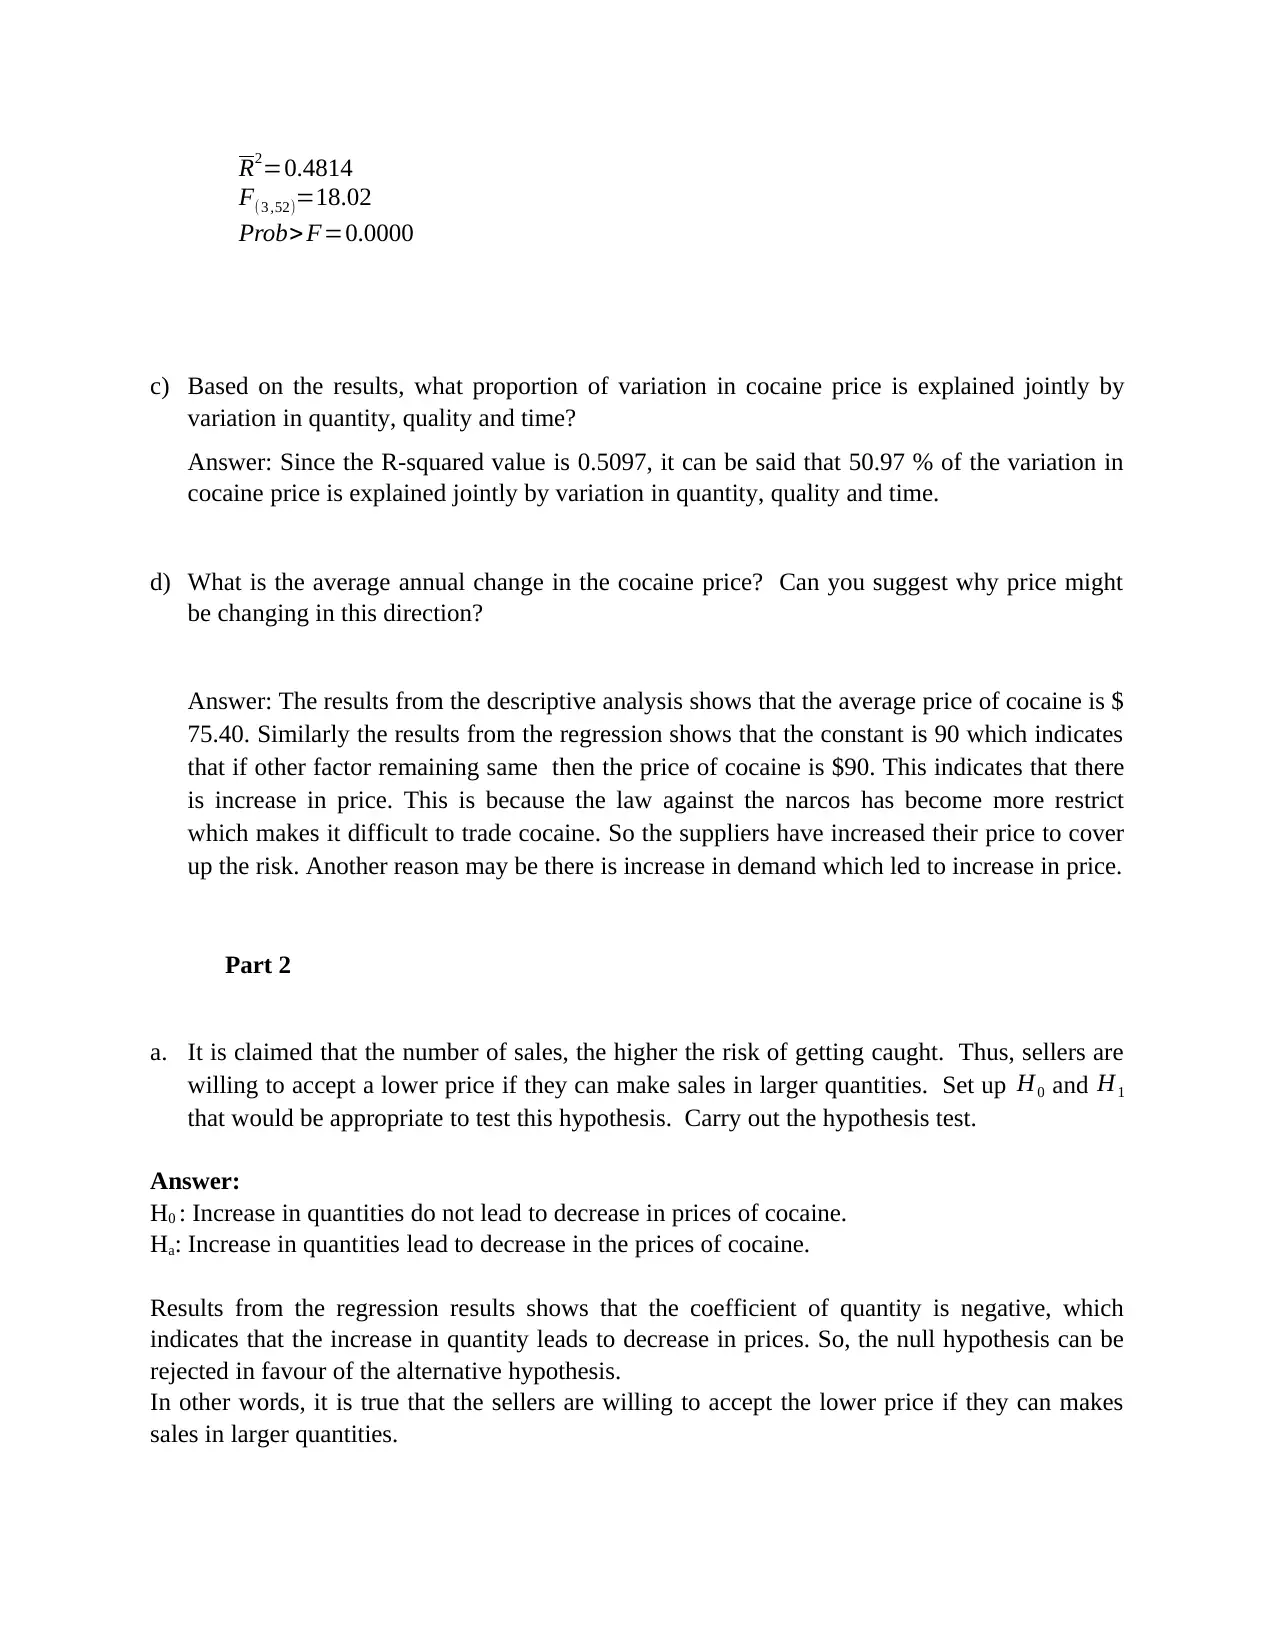
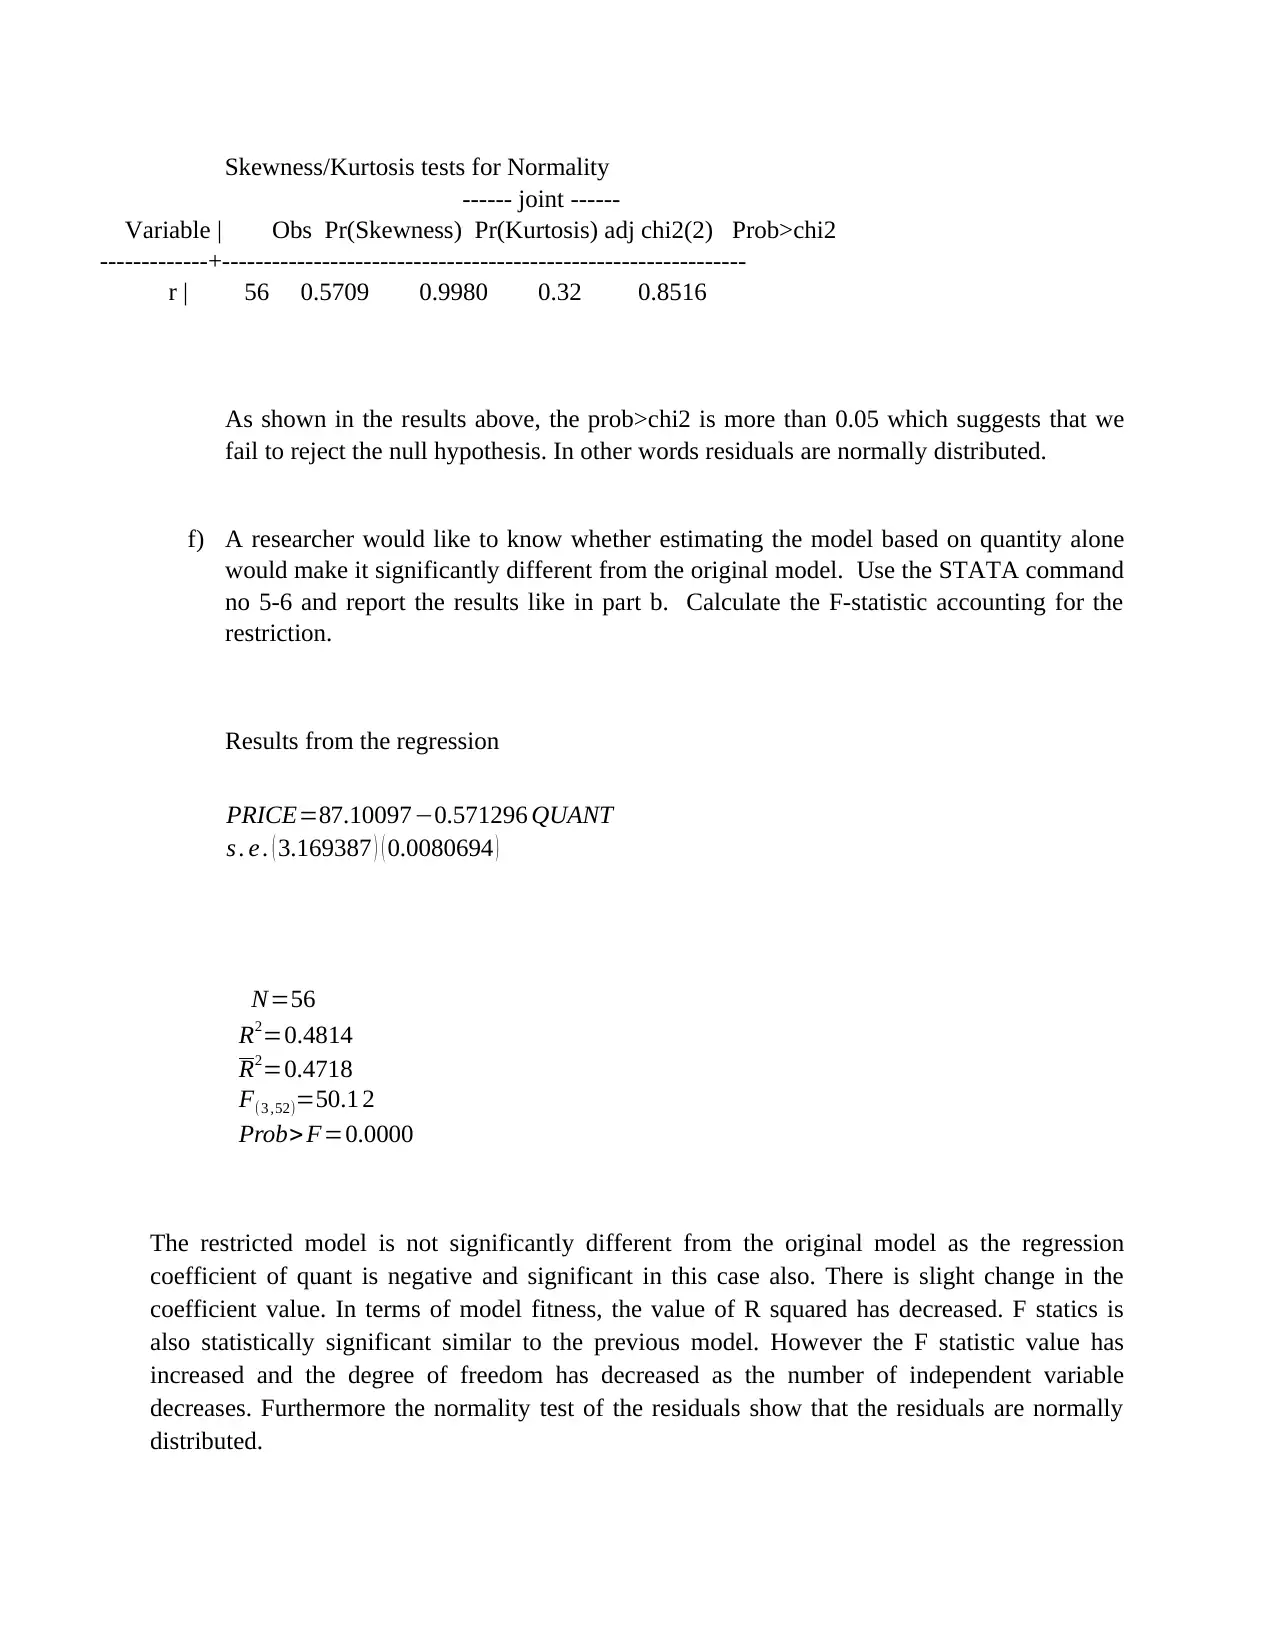
This assignment presents a regression model analyzing the factors influencing cocaine prices. The model incorporates variables such as quantity, quality, and a time trend to explain price variations. The analysis includes hypothesis testing to determine the signs of the coefficients, assess the proportion of variance explained, and evaluate the significance of different variables. The student examines the impact of quantity on price, tests whether quality has a significant effect, and uses F-tests to assess the joint significance of independent variables. The assignment also involves testing for the normality of residuals and comparing a restricted model with the original. The student uses STATA output to perform the analysis and draw conclusions about the relationships between the variables, offering insights into the economics of the cocaine market. The assignment is contributed by a student and is available on Desklib, a platform offering AI-based study tools for students.

PROBLEM FOR PRACTICAL EXERCISE 2
Regression Model
PRICE=β1+ β2 QUANT +β3 QUAL+ β4 TREND+e,
Where,
Price – price per gram in dollars for the cocaine sale,
Quant – number of grams of cocaine in the given sale,
Quality – quality of the cocaine expressed as percentage purity
Trend – a time variable with 1984 =1 , 1991 =8
Part 1.
a) What signs do you expect on the coefficientsβ2, β3 andβ4?
Ans:
On the basis of the above regression equation, β2 is the coefficient of quantity and is expected to
have negative sign. This is because the law of demand suggests that the price and quantity are
negatively related.
Similarly, β3 is the regression coefficient of quality, which is expected to have positive sign as
higher quality will be more expensive. So quality will have positive impact on price.
Finally, β4 is the regression coefficient of trend variable and is expected to have negative sign.
b) Results from STATA
PRICE=90.84669−0.05996 9 8 QUANT +0.1162052QUAL−2.354579 TREND
s . e . ( 8.580254 ) ( 0.0101783 ) ( 0.2032645 ) (1.38612)
N=56
R2=0.5097
Paraphrase This Document
Need a fresh take? Get an instant paraphrase of this document with our AI Paraphraser

R2=0.4814
F(3 ,52)=18.02
Prob>F=0.0000
c) Based on the results, what proportion of variation in cocaine price is explained jointly by
variation in quantity, quality and time?
Answer: Since the R-squared value is 0.5097, it can be said that 50.97 % of the variation in
cocaine price is explained jointly by variation in quantity, quality and time.
d) What is the average annual change in the cocaine price? Can you suggest why price might
be changing in this direction?
Answer: The results from the descriptive analysis shows that the average price of cocaine is $
75.40. Similarly the results from the regression shows that the constant is 90 which indicates
that if other factor remaining same then the price of cocaine is $90. This indicates that there
is increase in price. This is because the law against the narcos has become more restrict
which makes it difficult to trade cocaine. So the suppliers have increased their price to cover
up the risk. Another reason may be there is increase in demand which led to increase in price.
Part 2
a. It is claimed that the number of sales, the higher the risk of getting caught. Thus, sellers are
willing to accept a lower price if they can make sales in larger quantities. Set up H0 and H1
that would be appropriate to test this hypothesis. Carry out the hypothesis test.
Answer:
H0 : Increase in quantities do not lead to decrease in prices of cocaine.
Ha: Increase in quantities lead to decrease in the prices of cocaine.
Results from the regression results shows that the coefficient of quantity is negative, which
indicates that the increase in quantity leads to decrease in prices. So, the null hypothesis can be
rejected in favour of the alternative hypothesis.
In other words, it is true that the sellers are willing to accept the lower price if they can makes
sales in larger quantities.

b) Some researchers argue that quantity is the main driver of price not quality. Law
enforcement would like to know whether quality does have a significant effect on the price.
Carry out the hypothesis test.
H0: Quality of cocaine does not have significant effect on its price.
Ha: Quality of cocaine has significant effect on its price.
Results from the regression analysis show that the coefficient of quality is not statistically
significant as the p value is higher than 0.05. So, the null hypothesis cannot be rejected. In
other words, the quality does not have significant effect on the price.
c) What are the variables that have a significant effect on price? Use 5% as the level of
significance.
Answer: As per the regression results only quantity has significant effect on price. The p
value of other two variables are higher than 0.05.
d) Set up the using the F-test to test whether quantity, quality and time are jointly significant
in explaining price. Write theH0, H1. Use probability of the F-statistic from the STATA
output. Do you reject or not reject the null hypothesis?
Ho: Independent variables are not jointly significant in explaining the price of cocaine.
Ha: Independent variables are jointly significant in explaining the price of cocaine.
Results from the F statistic shows that the F statistics of 18.02 is statistically significant
as the prob > F is less than 0.05. So the null hypothesis can be rejected and the alternative
hypothesis can be accepted.
e) Testing that the residuals are normally distributed. Specify the Null and the Alternative
Hypothesis. What test will you use? Specify the test and the decision Rule. Conclusion.
In this case the sktest has been used to test the normality of the residuals.
Null hypothesis: Residuals are normally distributed.
Alternative hypothesis: Residuals are not normally distributed.
⊘ This is a preview!⊘
Do you want full access?
Subscribe today to unlock all pages.

Trusted by 1+ million students worldwide

Skewness/Kurtosis tests for Normality
------ joint ------
Variable | Obs Pr(Skewness) Pr(Kurtosis) adj chi2(2) Prob>chi2
-------------+---------------------------------------------------------------
r | 56 0.5709 0.9980 0.32 0.8516
As shown in the results above, the prob>chi2 is more than 0.05 which suggests that we
fail to reject the null hypothesis. In other words residuals are normally distributed.
f) A researcher would like to know whether estimating the model based on quantity alone
would make it significantly different from the original model. Use the STATA command
no 5-6 and report the results like in part b. Calculate the F-statistic accounting for the
restriction.
Results from the regression
PRICE=87.10097−0.571296 QUANT
s . e . ( 3.169387 ) ( 0.0080694 )
N=56
R2=0.4814
R2=0.4718
F(3 ,52)=50.1 2
Prob>F=0.0000
The restricted model is not significantly different from the original model as the regression
coefficient of quant is negative and significant in this case also. There is slight change in the
coefficient value. In terms of model fitness, the value of R squared has decreased. F statics is
also statistically significant similar to the previous model. However the F statistic value has
increased and the degree of freedom has decreased as the number of independent variable
decreases. Furthermore the normality test of the residuals show that the residuals are normally
distributed.
Paraphrase This Document
Need a fresh take? Get an instant paraphrase of this document with our AI Paraphraser

1 out of 5
Related Documents
Your All-in-One AI-Powered Toolkit for Academic Success.
+13062052269
info@desklib.com
Available 24*7 on WhatsApp / Email
Unlock your academic potential
Copyright © 2020–2025 A2Z Services. All Rights Reserved. Developed and managed by ZUCOL.


