Food Characterisation: Statistical Analysis of Cocoa Samples Report

Verified

Added on  2020/03/16

|16
|1782
|121
Report
AI Summary
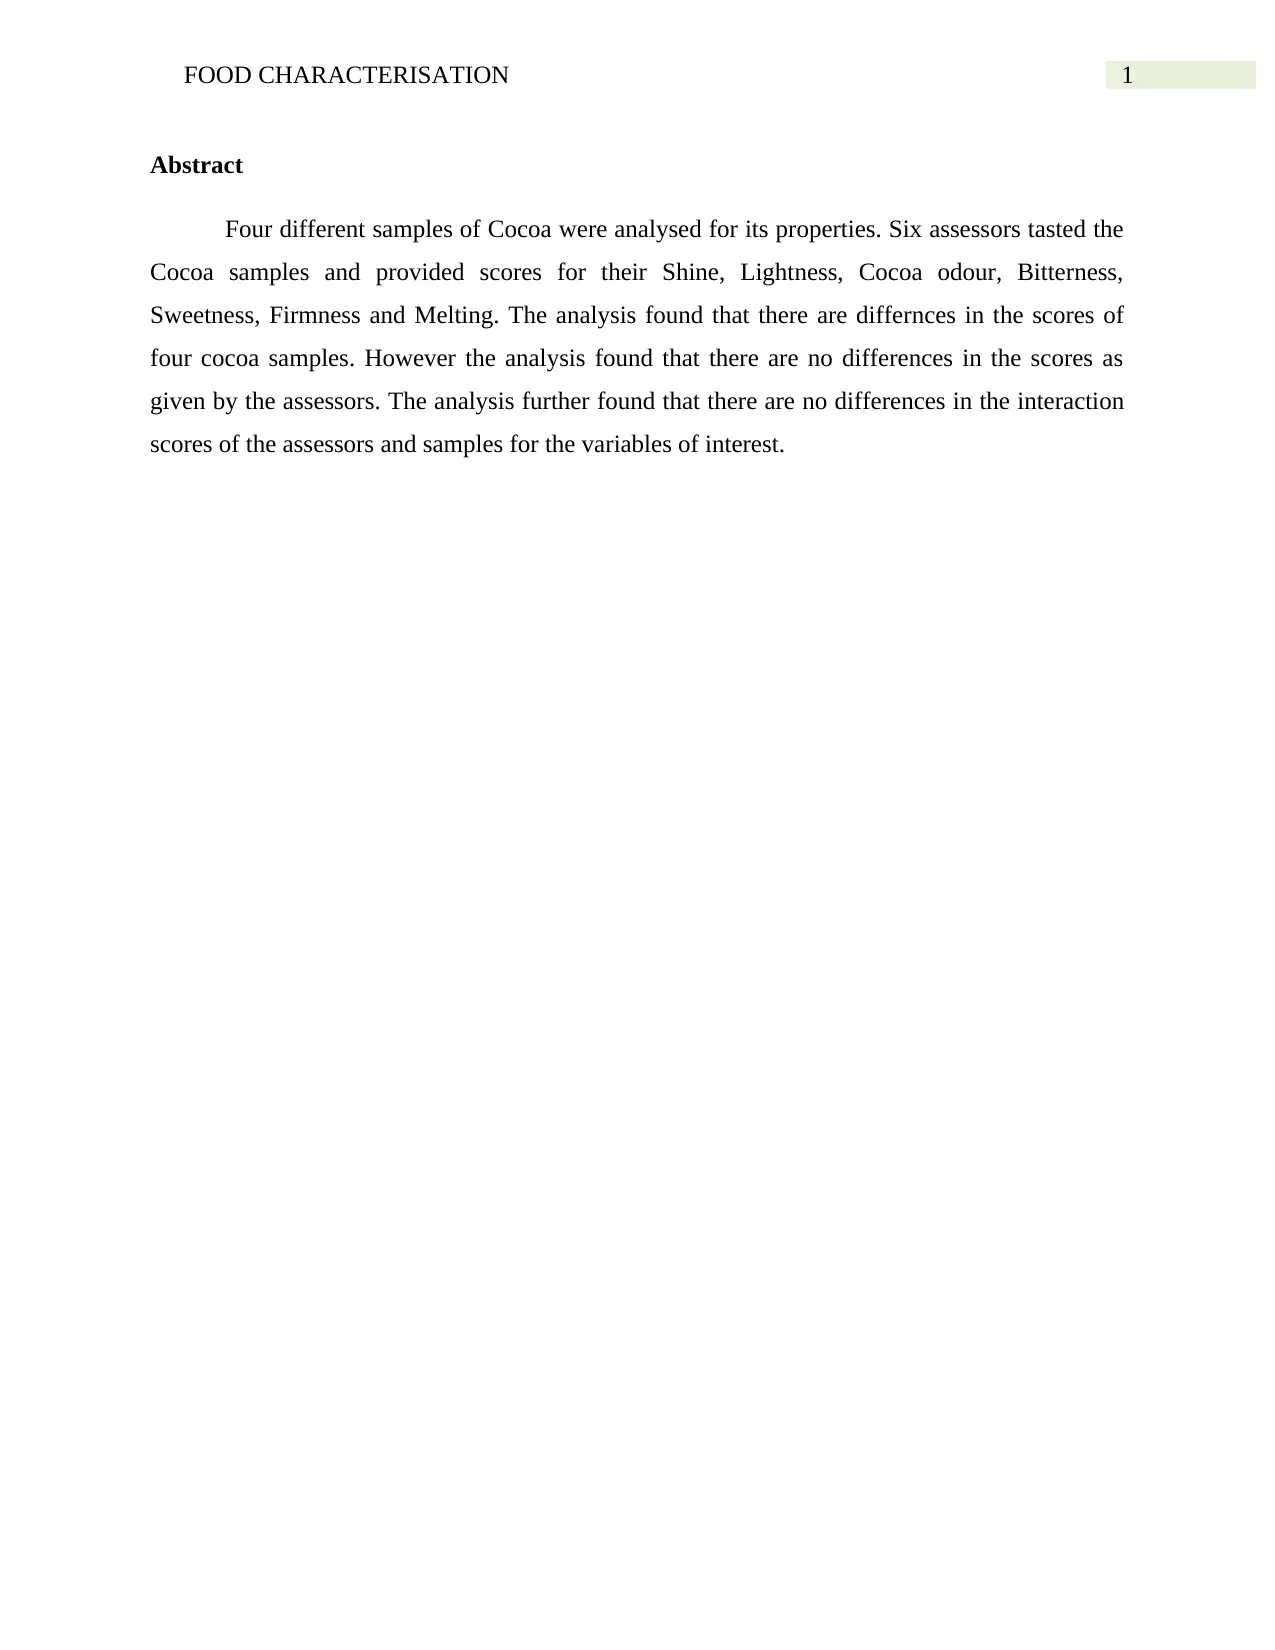
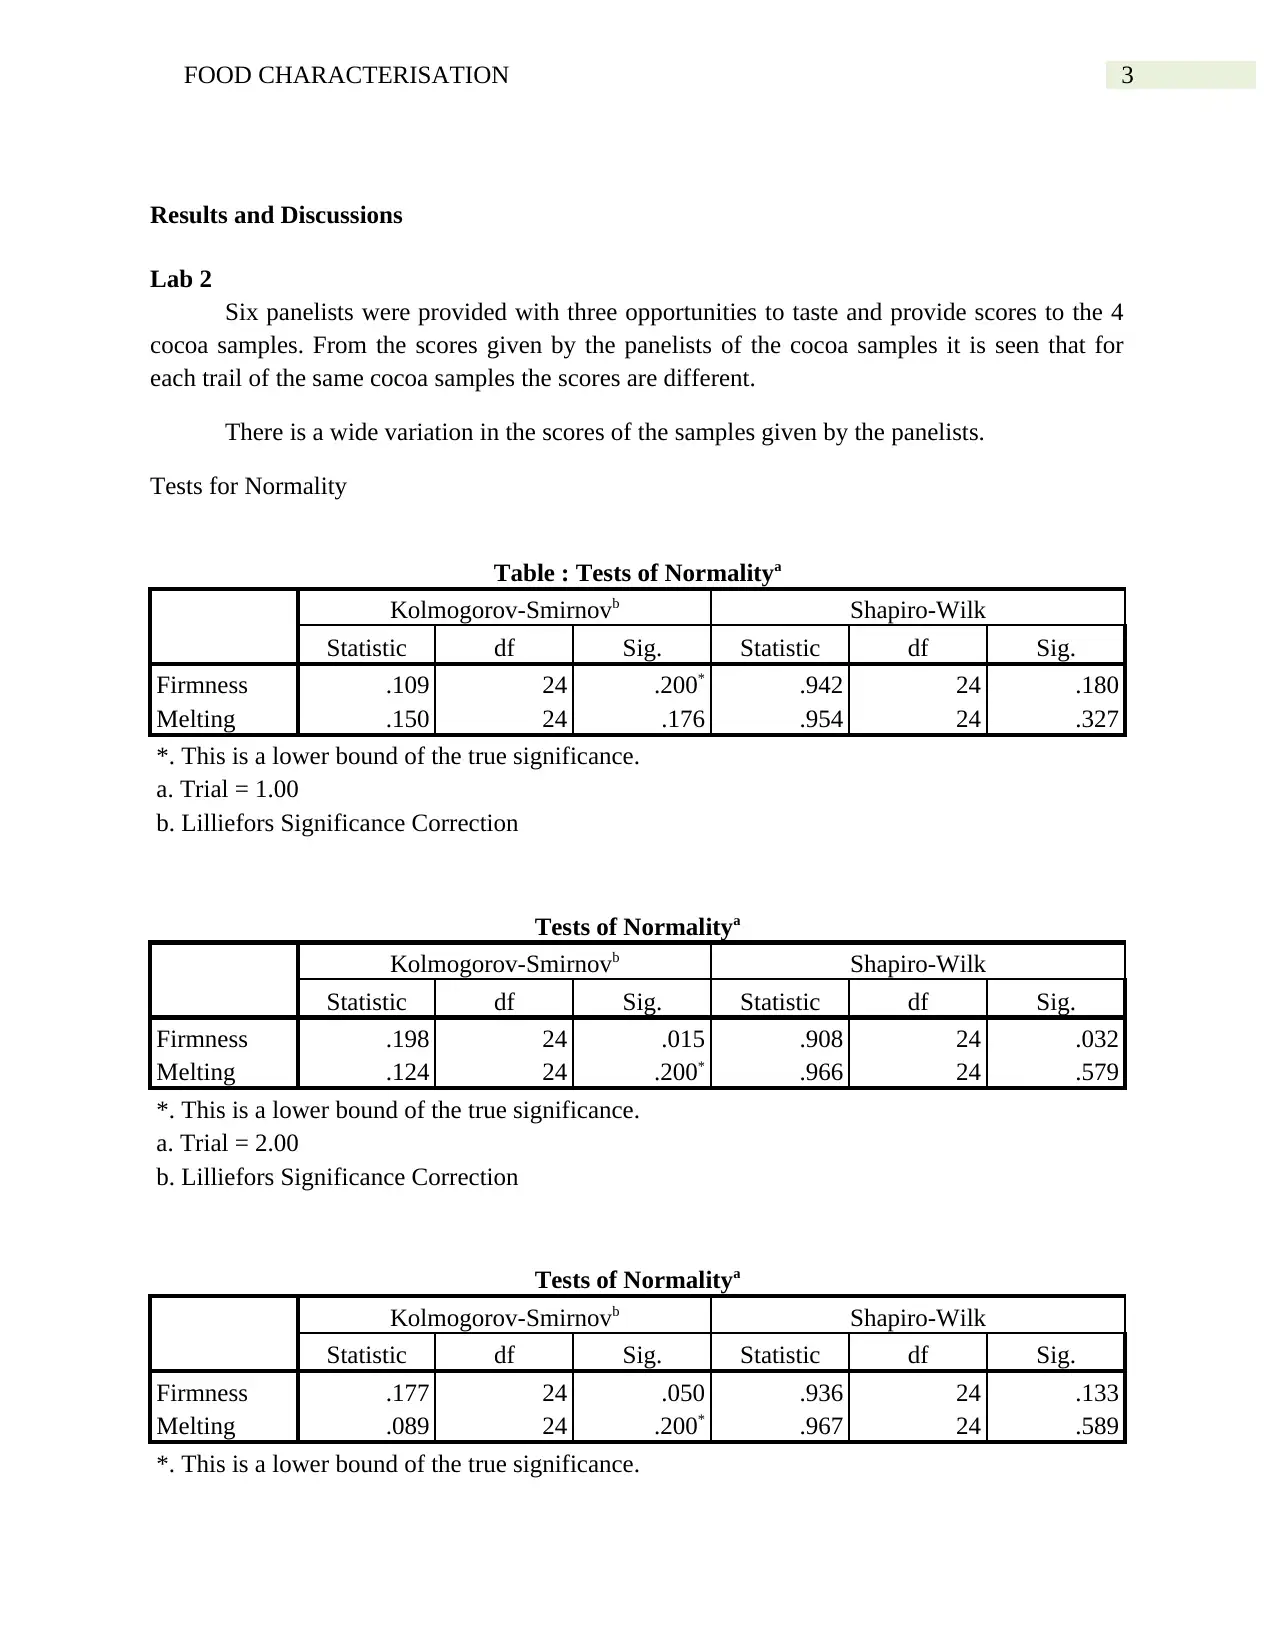
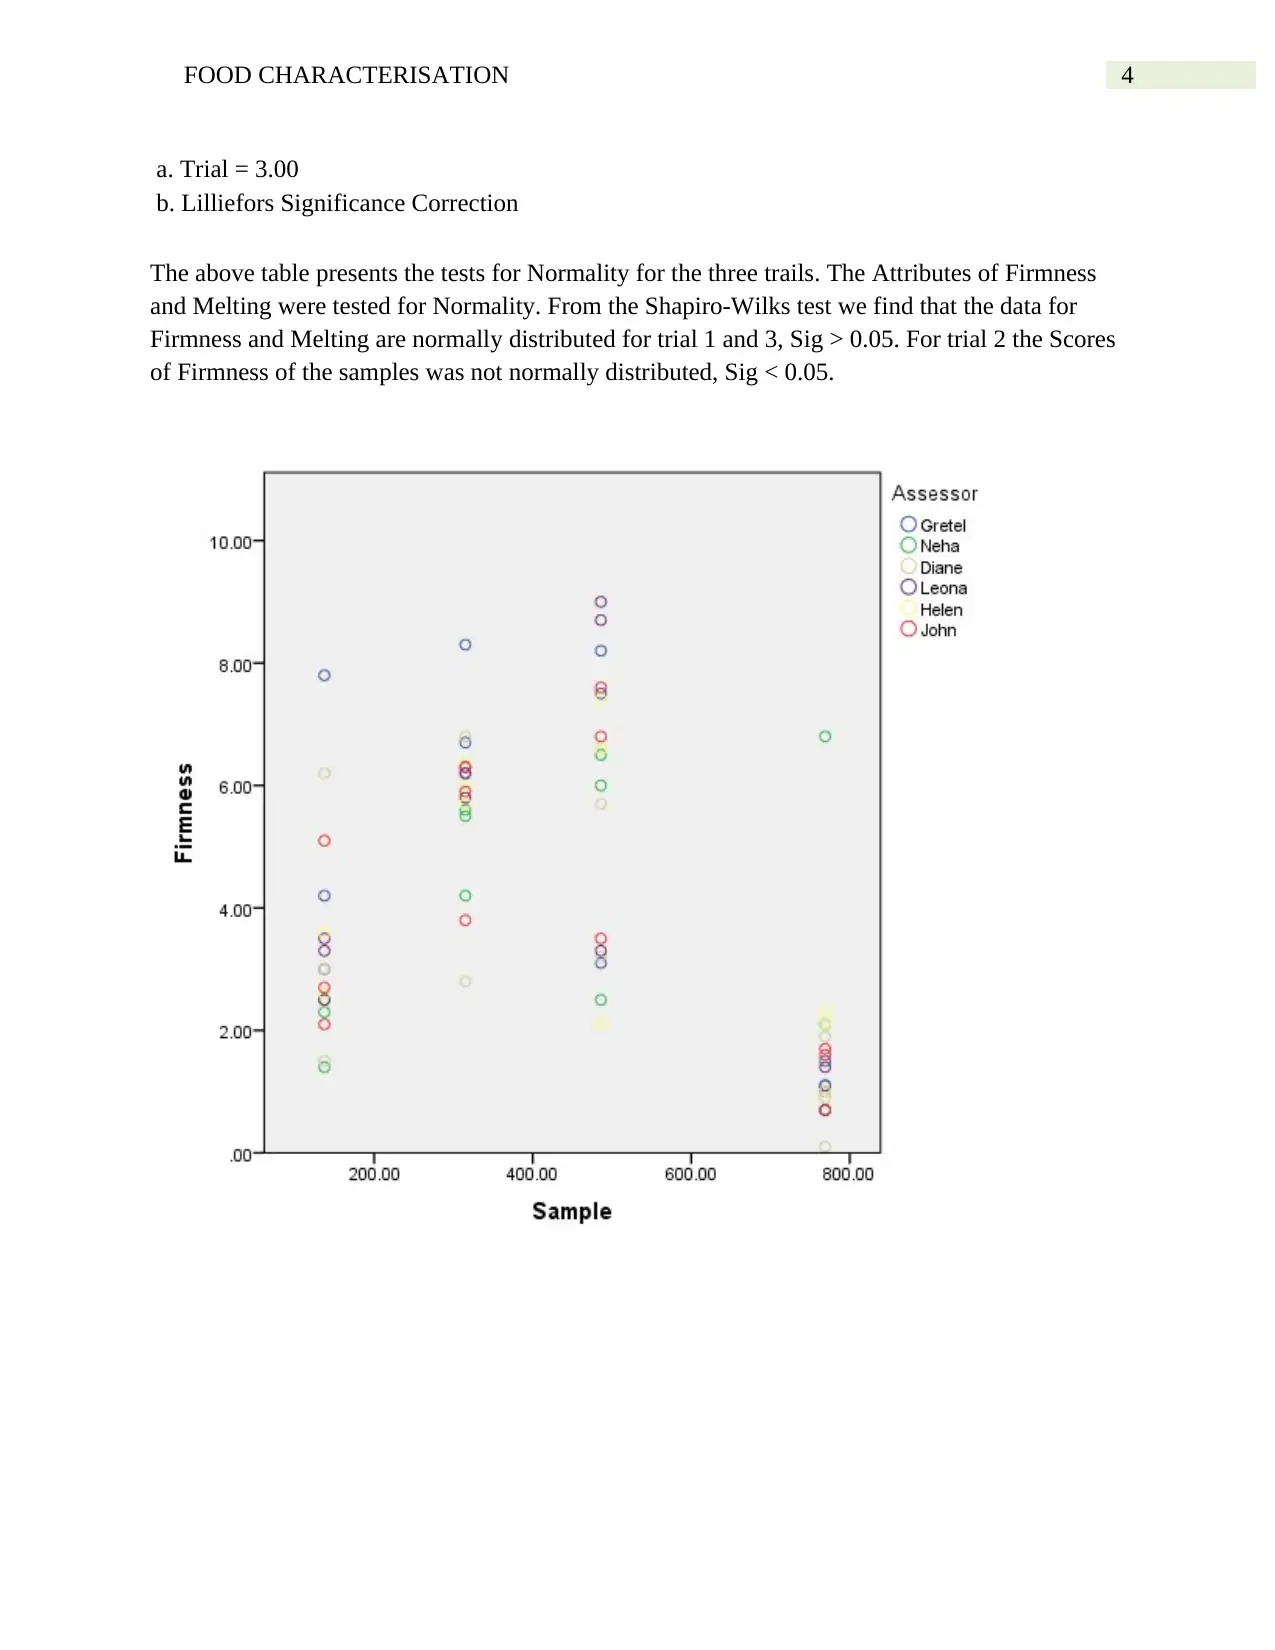
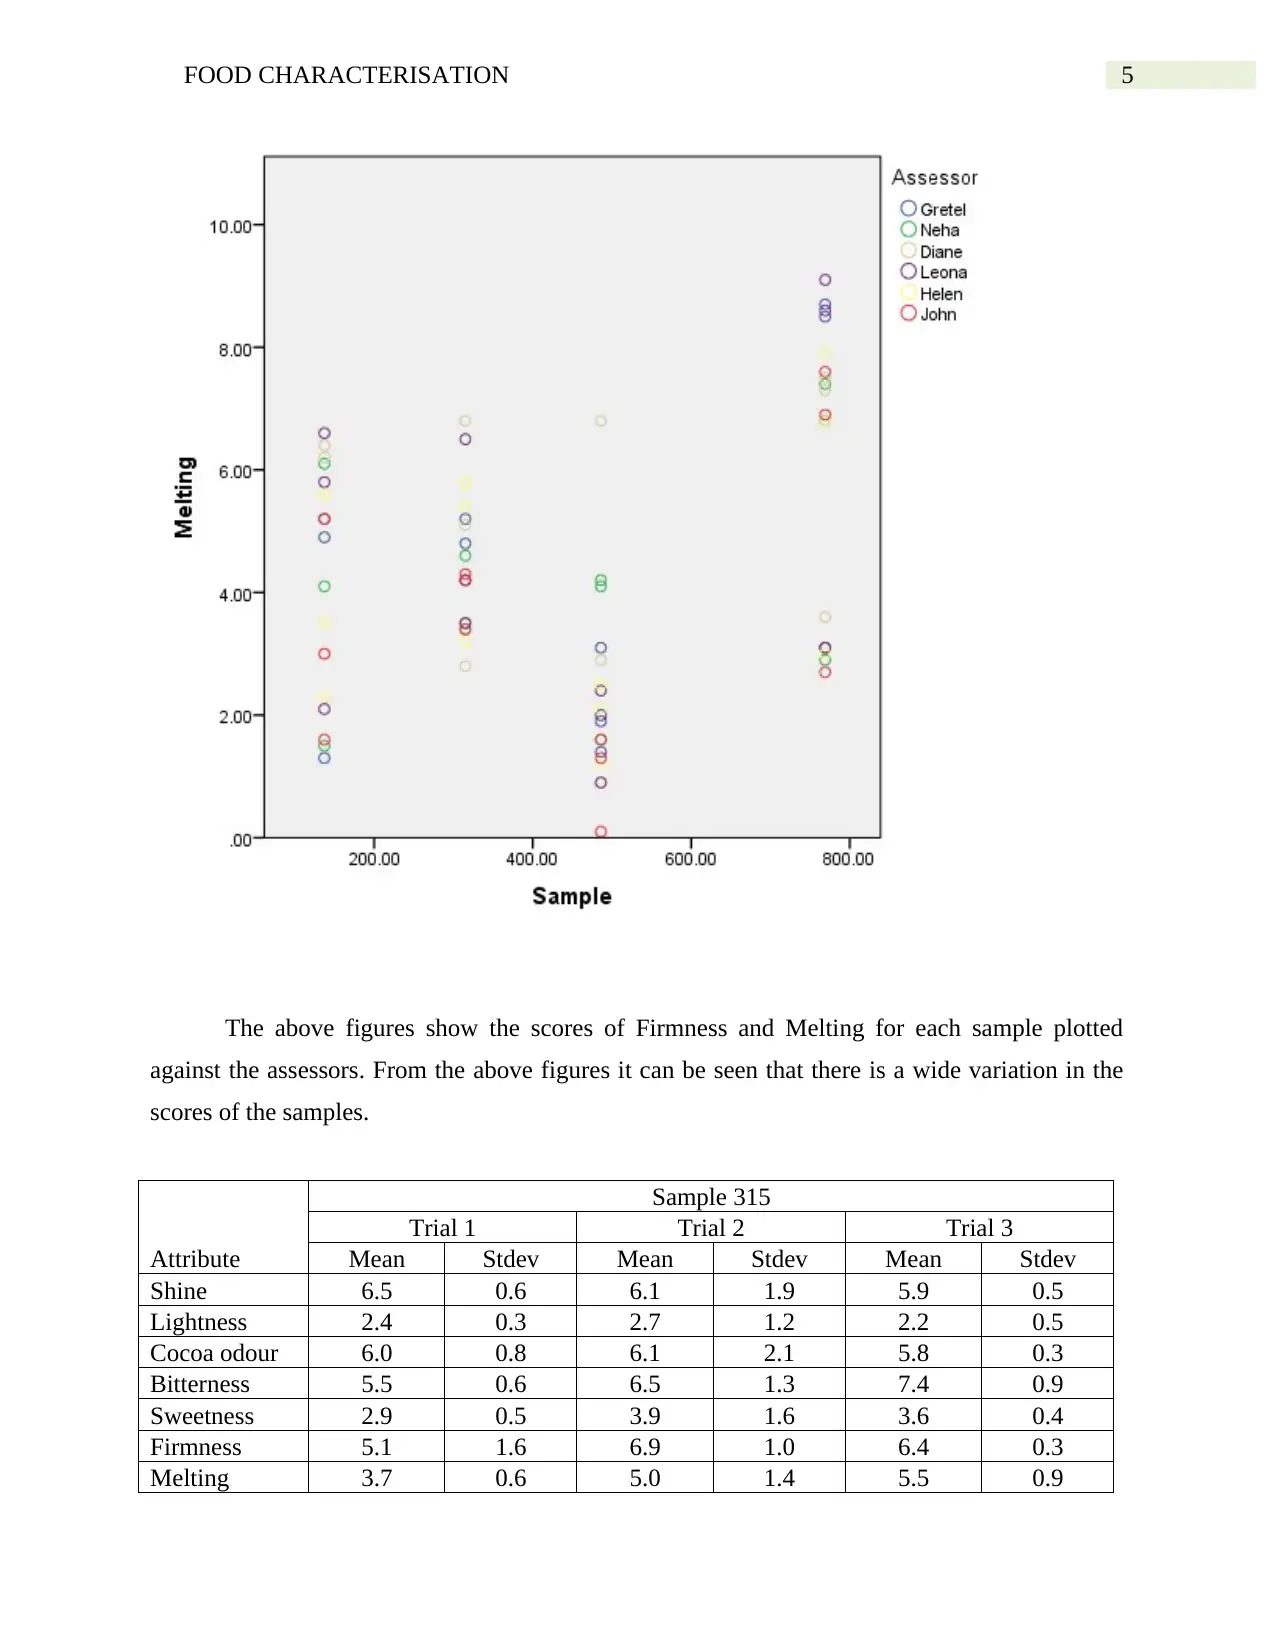
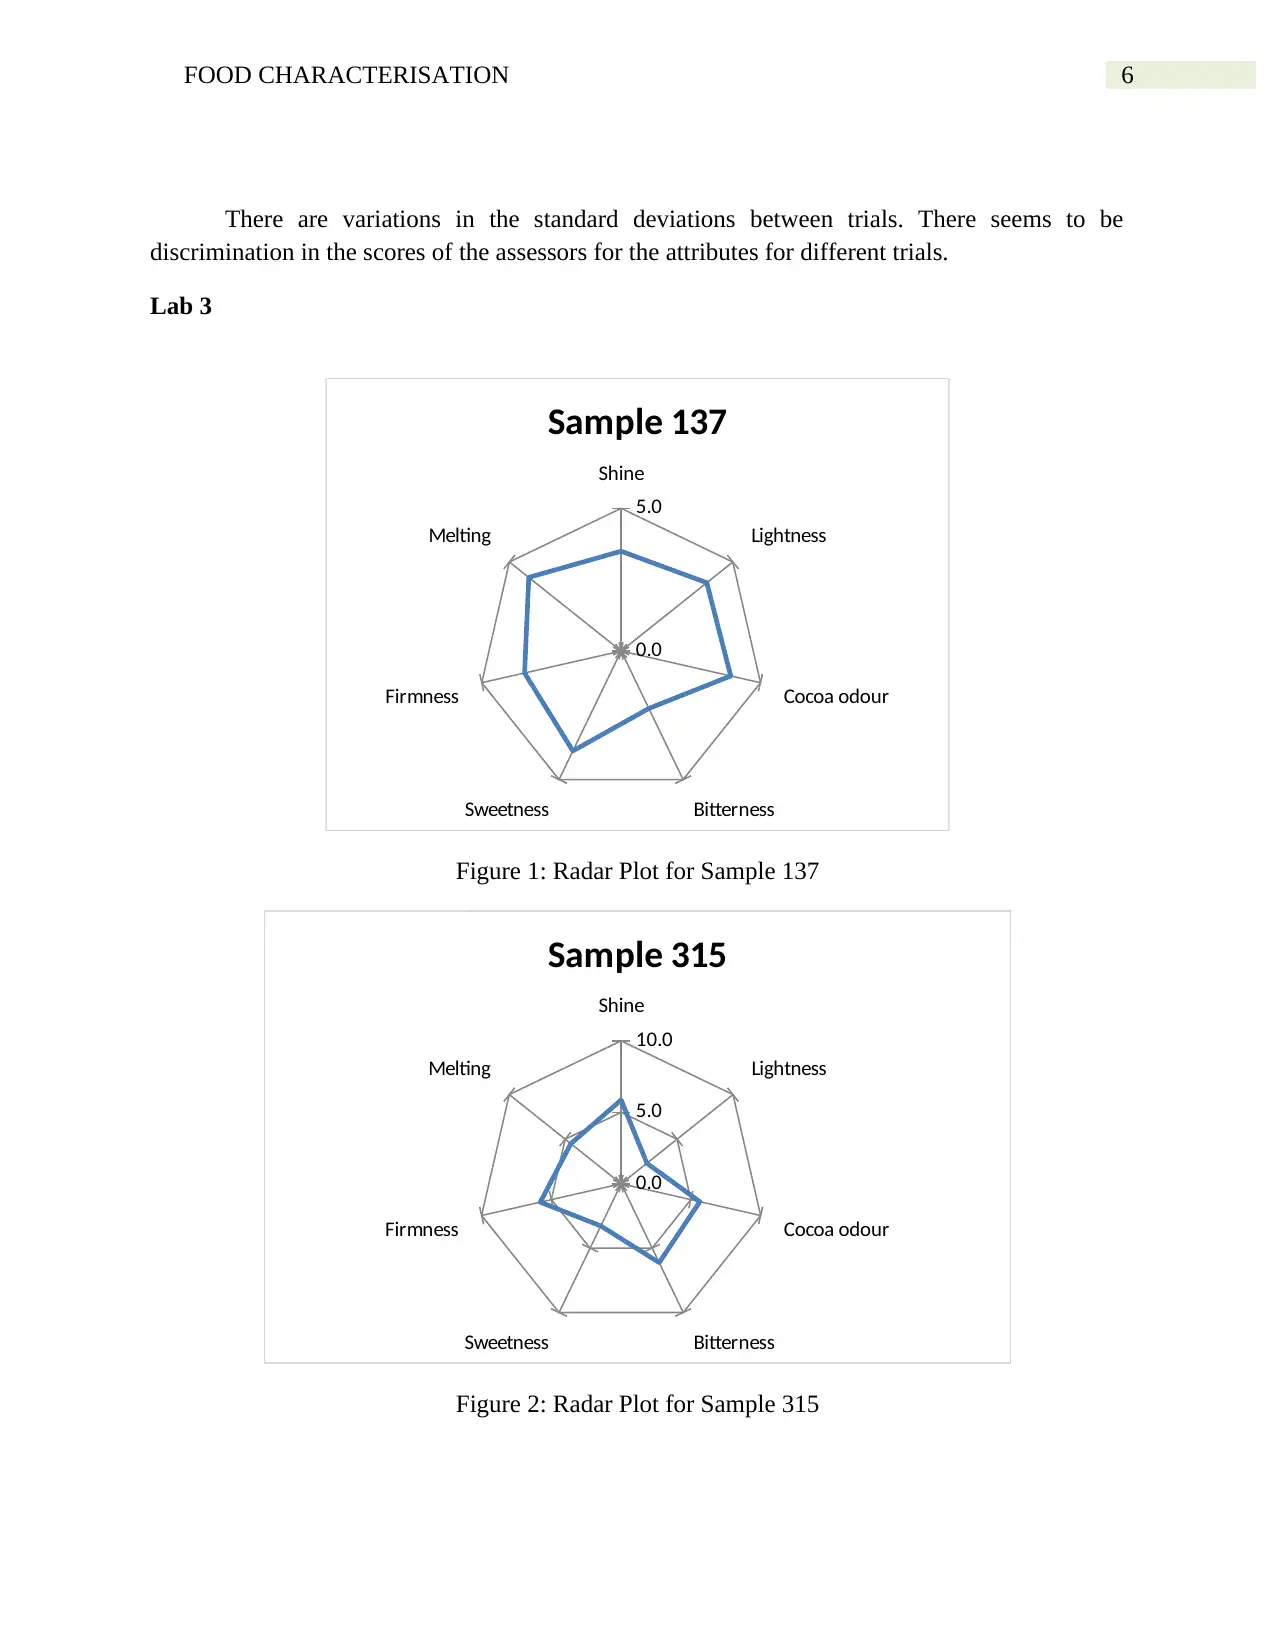
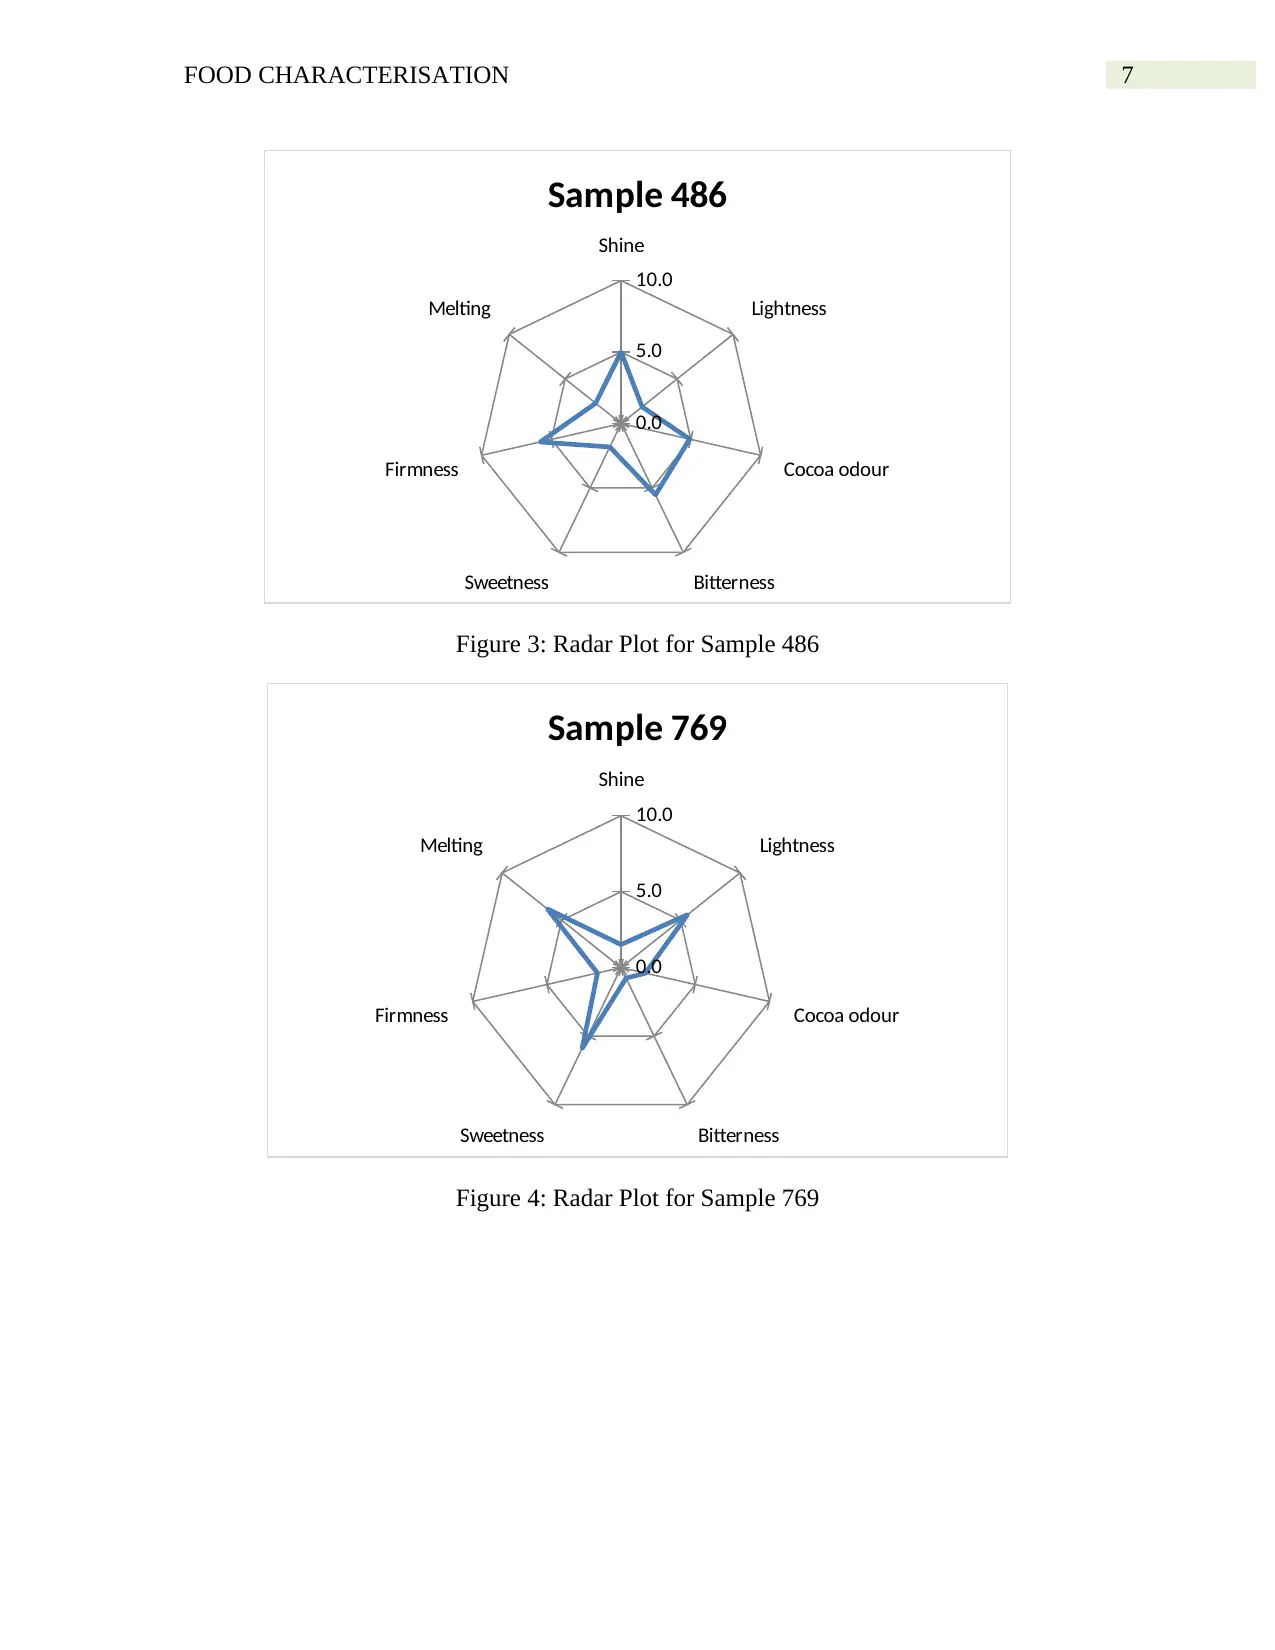
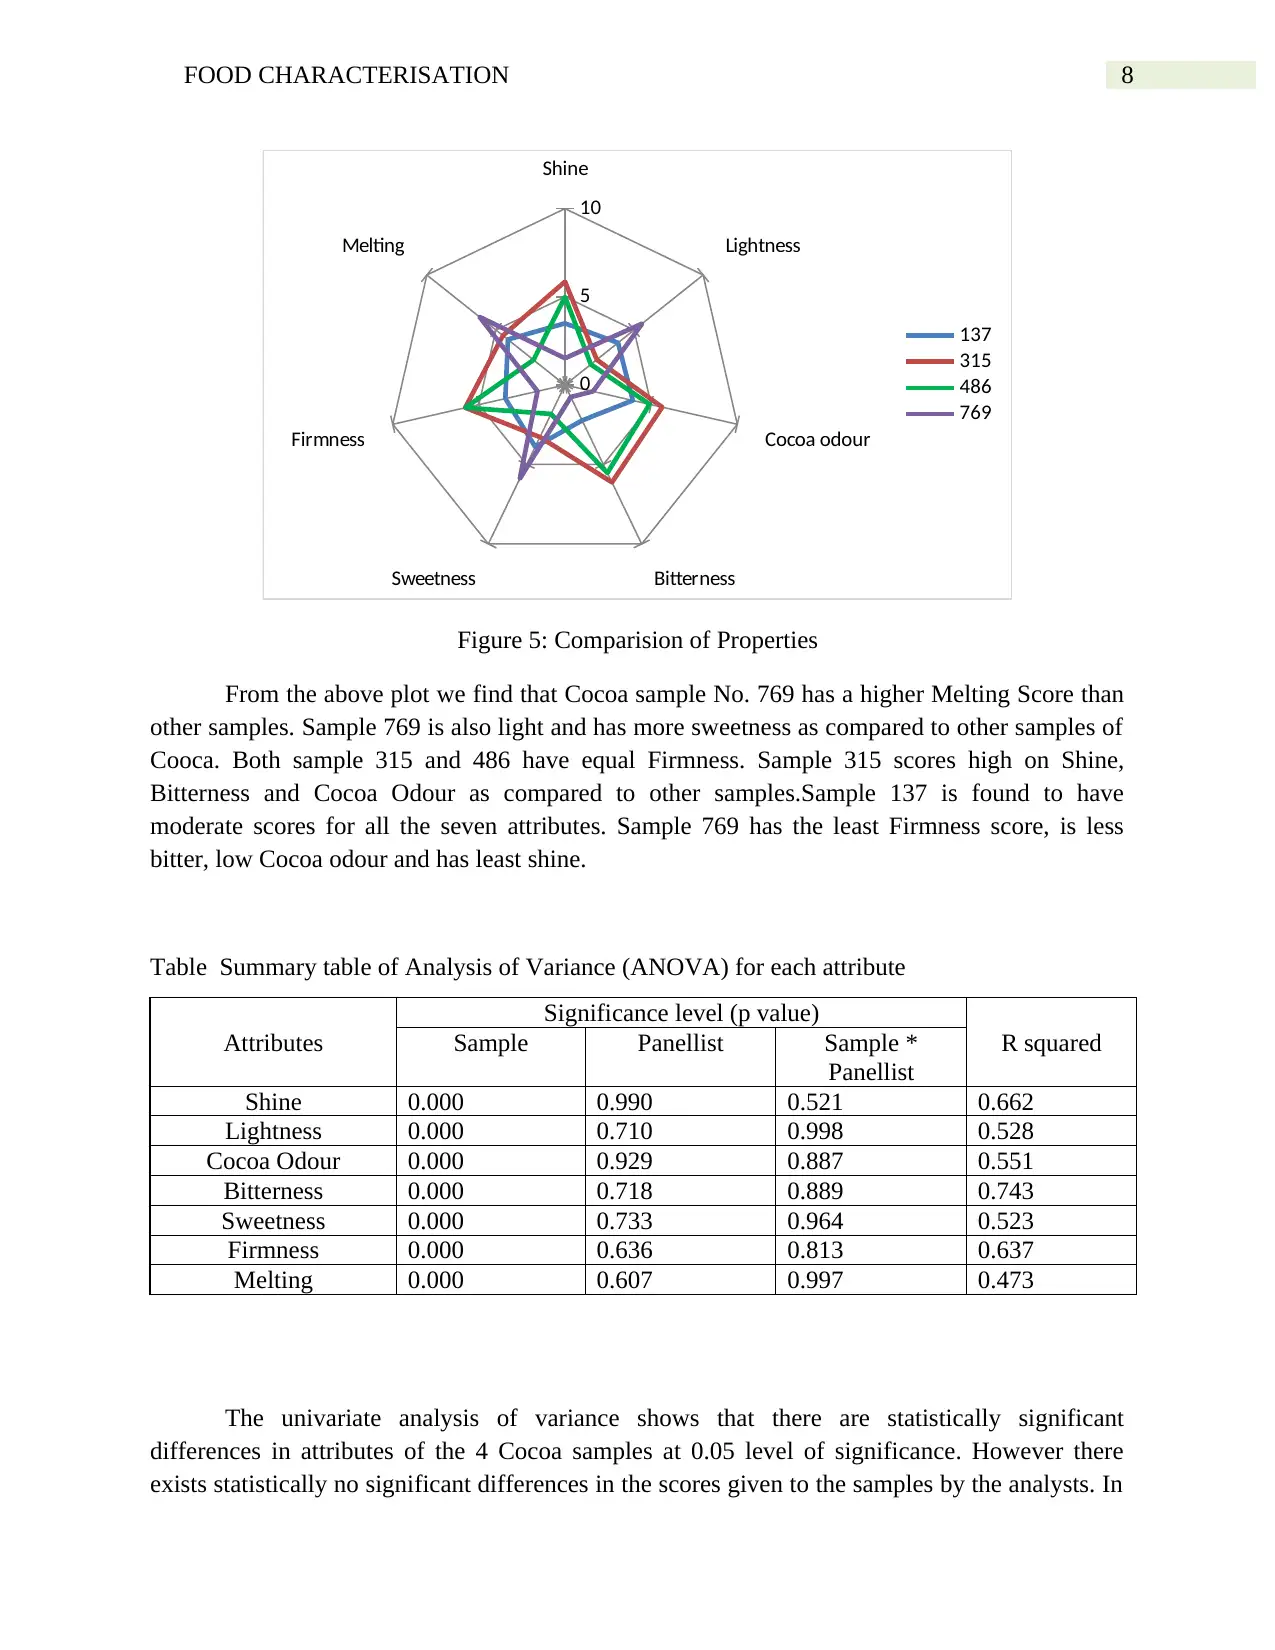
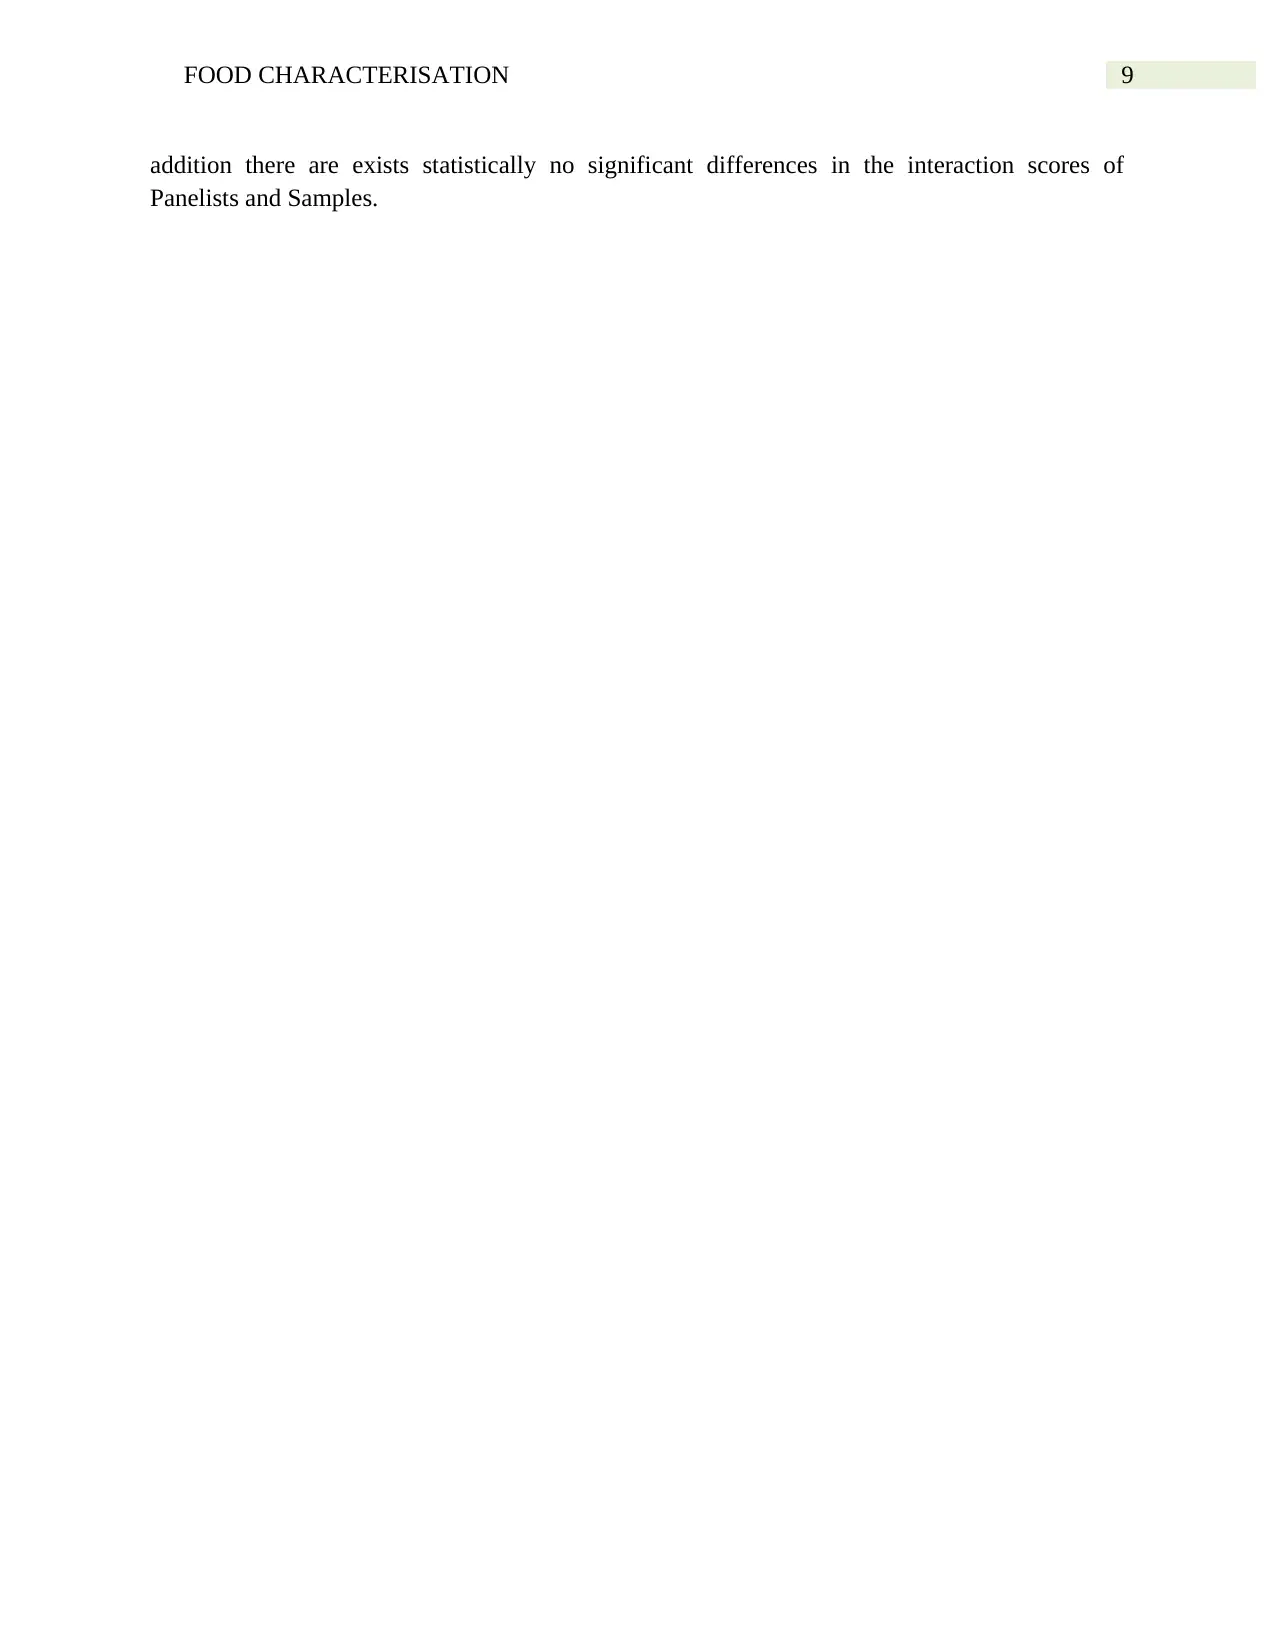
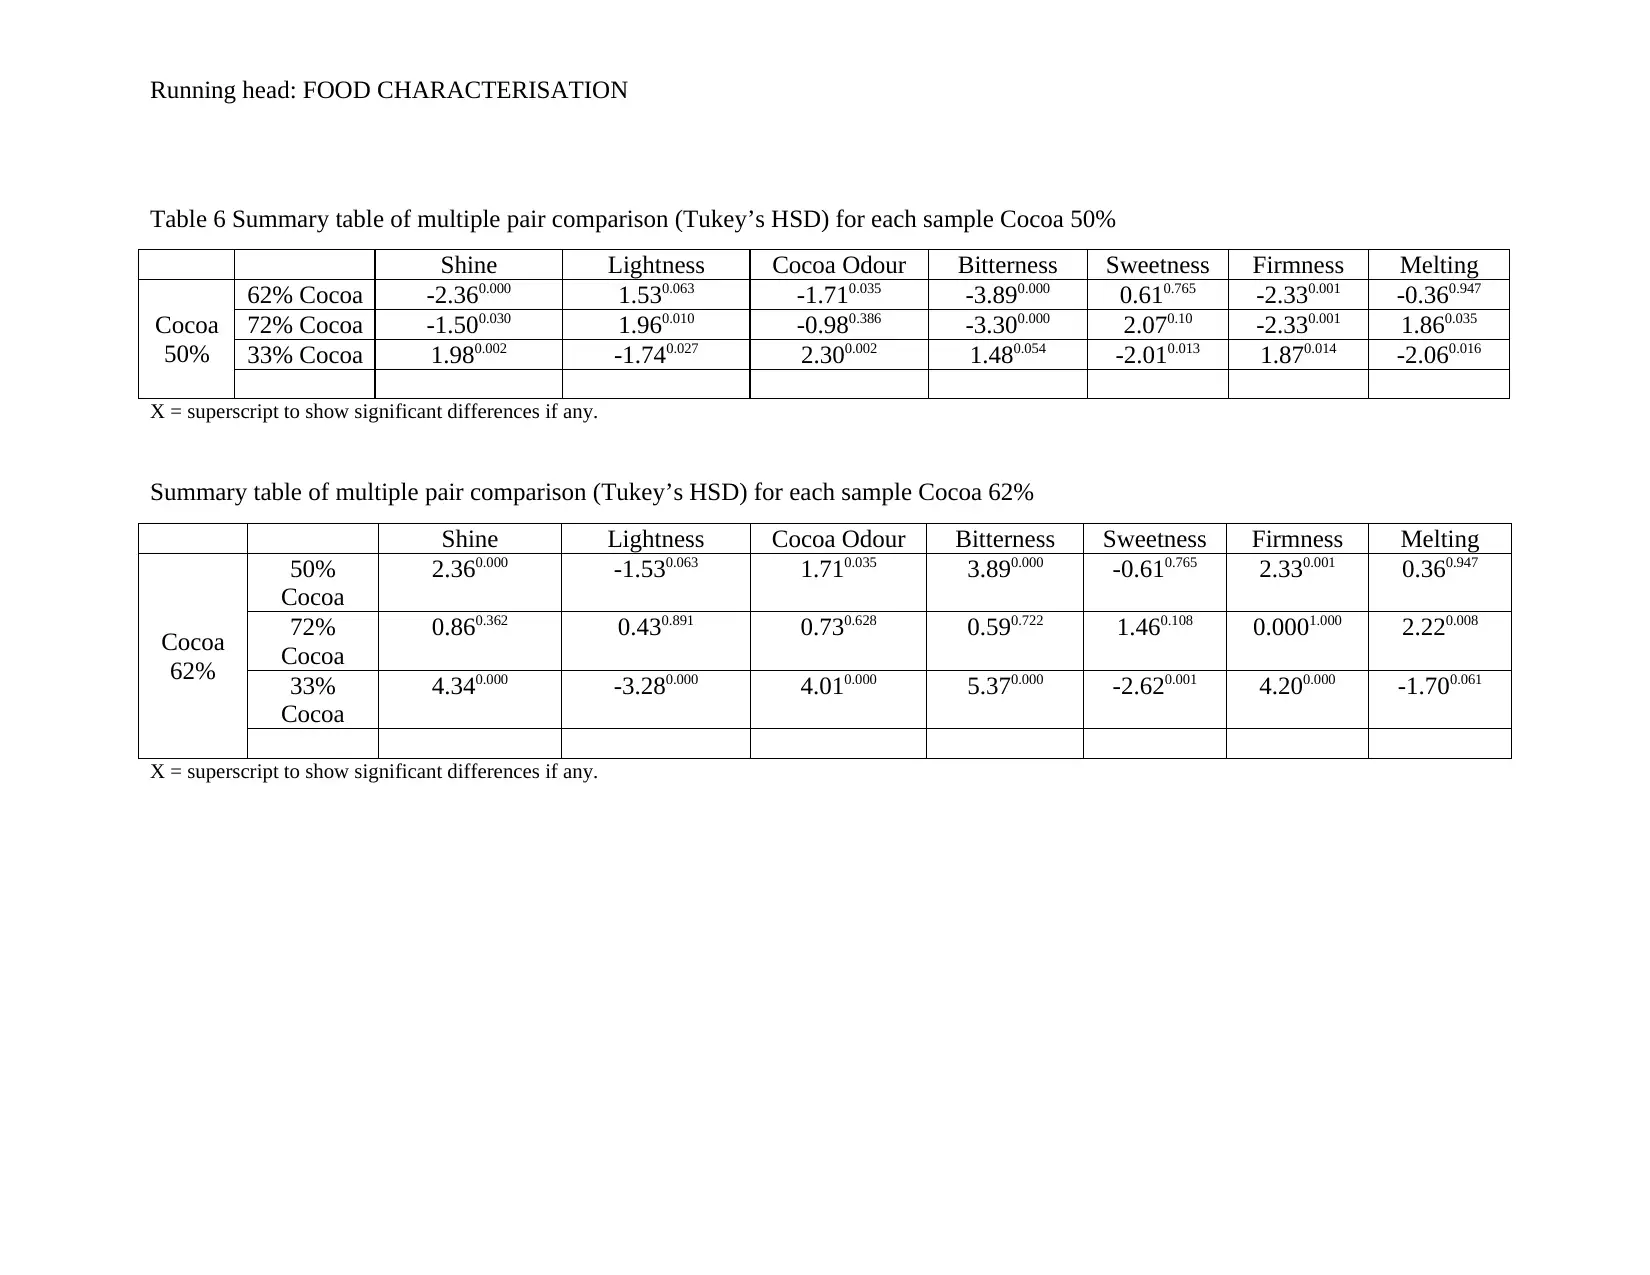
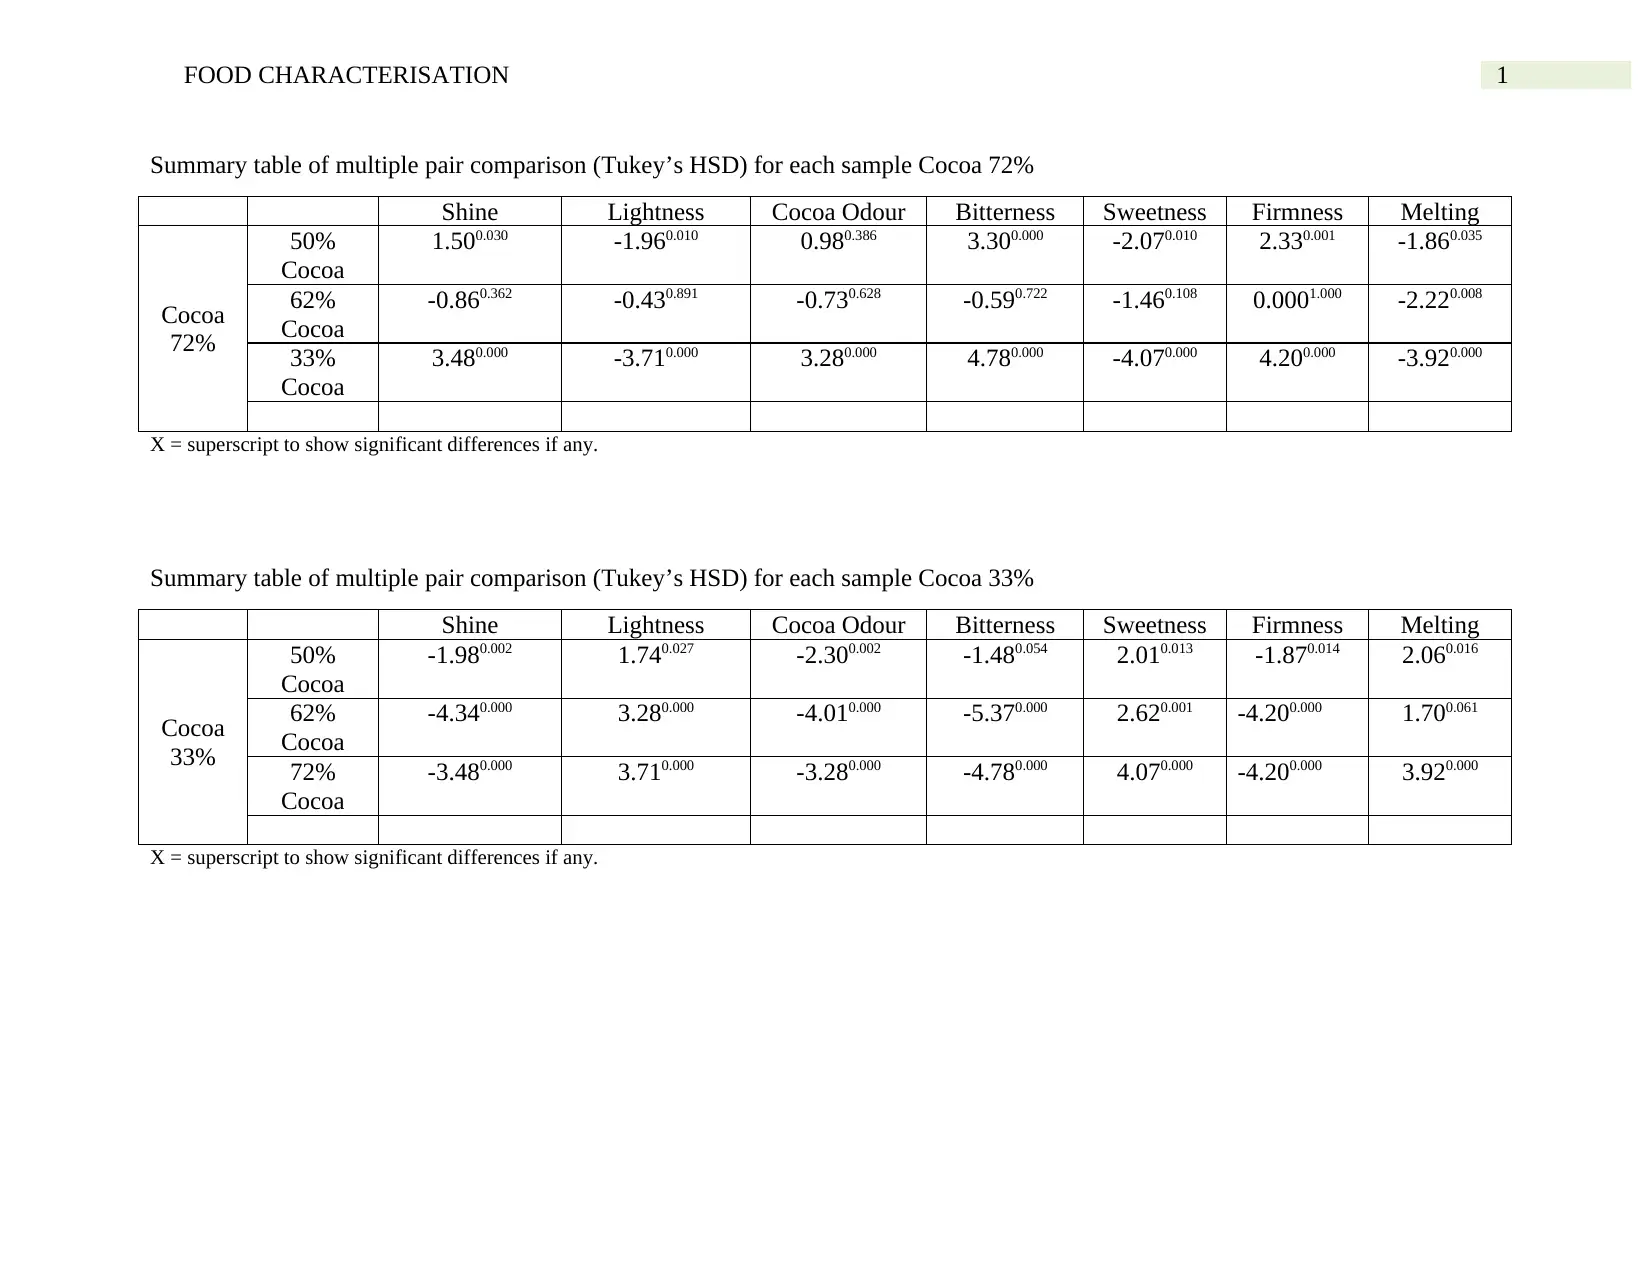
This report presents an analysis of four different cocoa samples, focusing on their characterization through sensory evaluation and statistical analysis. Six assessors evaluated the cocoa samples based on attributes such as shine, lightness, cocoa odor, bitterness, sweetness, firmness, and melting. The analysis involved statistical tests, including tests for normality and ANOVA, to identify significant differences between the samples and assessors. The results revealed statistically significant differences in the attributes of the cocoa samples, but no significant differences were found in the scores given by the assessors or in the interaction between samples and assessors. The report includes detailed tables of results, radar plots for sample comparison, and a discussion of the findings, highlighting variations in the scores and average attributes of the samples. The conclusion summarizes the significant differences observed in the cocoa samples based on the sensory attributes.
Document Page
Running head: FOOD CHARACTERISATION
Food Characterization
Name of the student
Name of the university
Author’s note
tabler-icon-diamond-filled.svg

Paraphrase This Document

Need a fresh take? Get an instant paraphrase of this document with our AI Paraphraser
Document Page
1FOOD CHARACTERISATION
Abstract
Four different samples of Cocoa were analysed for its properties. Six assessors tasted the
Cocoa samples and provided scores for their Shine, Lightness, Cocoa odour, Bitterness,
Sweetness, Firmness and Melting. The analysis found that there are differnces in the scores of
four cocoa samples. However the analysis found that there are no differences in the scores as
given by the assessors. The analysis further found that there are no differences in the interaction
scores of the assessors and samples for the variables of interest.
Document Page
2FOOD CHARACTERISATION
Table of Contents
Results and Discussions...................................................................................................................3
Lab 2............................................................................................................................................3
Lab 3............................................................................................................................................6
Conclusion.......................................................................................................................................0
Document Page
3FOOD CHARACTERISATION
Results and Discussions
Lab 2
Six panelists were provided with three opportunities to taste and provide scores to the 4
cocoa samples. From the scores given by the panelists of the cocoa samples it is seen that for
each trail of the same cocoa samples the scores are different.
There is a wide variation in the scores of the samples given by the panelists.
Tests for Normality
Table : Tests of Normalitya
Kolmogorov-Smirnovb Shapiro-Wilk
Statistic df Sig. Statistic df Sig.
Firmness .109 24 .200* .942 24 .180
Melting .150 24 .176 .954 24 .327
*. This is a lower bound of the true significance.
a. Trial = 1.00
b. Lilliefors Significance Correction
Tests of Normalitya
Kolmogorov-Smirnovb Shapiro-Wilk
Statistic df Sig. Statistic df Sig.
Firmness .198 24 .015 .908 24 .032
Melting .124 24 .200* .966 24 .579
*. This is a lower bound of the true significance.
a. Trial = 2.00
b. Lilliefors Significance Correction
Tests of Normalitya
Kolmogorov-Smirnovb Shapiro-Wilk
Statistic df Sig. Statistic df Sig.
Firmness .177 24 .050 .936 24 .133
Melting .089 24 .200* .967 24 .589
*. This is a lower bound of the true significance.
tabler-icon-diamond-filled.svg

Paraphrase This Document

Need a fresh take? Get an instant paraphrase of this document with our AI Paraphraser
Document Page
4FOOD CHARACTERISATION
a. Trial = 3.00
b. Lilliefors Significance Correction
The above table presents the tests for Normality for the three trails. The Attributes of Firmness
and Melting were tested for Normality. From the Shapiro-Wilks test we find that the data for
Firmness and Melting are normally distributed for trial 1 and 3, Sig > 0.05. For trial 2 the Scores
of Firmness of the samples was not normally distributed, Sig < 0.05.
Document Page
5FOOD CHARACTERISATION
The above figures show the scores of Firmness and Melting for each sample plotted
against the assessors. From the above figures it can be seen that there is a wide variation in the
scores of the samples.
Attribute
Sample 315
Trial 1 Trial 2 Trial 3
Mean Stdev Mean Stdev Mean Stdev
Shine 6.5 0.6 6.1 1.9 5.9 0.5
Lightness 2.4 0.3 2.7 1.2 2.2 0.5
Cocoa odour 6.0 0.8 6.1 2.1 5.8 0.3
Bitterness 5.5 0.6 6.5 1.3 7.4 0.9
Sweetness 2.9 0.5 3.9 1.6 3.6 0.4
Firmness 5.1 1.6 6.9 1.0 6.4 0.3
Melting 3.7 0.6 5.0 1.4 5.5 0.9
Document Page
6FOOD CHARACTERISATION
There are variations in the standard deviations between trials. There seems to be
discrimination in the scores of the assessors for the attributes for different trials.
Lab 3
Shine
Lightness
Cocoa odour
BitternessSweetness
Firmness
Melting
0.0
5.0
Sample 137
Figure 1: Radar Plot for Sample 137
Shine
Lightness
Cocoa odour
BitternessSweetness
Firmness
Melting
0.0
5.0
10.0
Sample 315
Figure 2: Radar Plot for Sample 315
tabler-icon-diamond-filled.svg

Paraphrase This Document

Need a fresh take? Get an instant paraphrase of this document with our AI Paraphraser
Document Page
7FOOD CHARACTERISATION
Shine
Lightness
Cocoa odour
BitternessSweetness
Firmness
Melting
0.0
5.0
10.0
Sample 486
Figure 3: Radar Plot for Sample 486
Shine
Lightness
Cocoa odour
BitternessSweetness
Firmness
Melting
0.0
5.0
10.0
Sample 769
Figure 4: Radar Plot for Sample 769
Document Page
8FOOD CHARACTERISATION
Shine
Lightness
Cocoa odour
BitternessSweetness
Firmness
Melting
0
5
10
137
315
486
769
Figure 5: Comparision of Properties
From the above plot we find that Cocoa sample No. 769 has a higher Melting Score than
other samples. Sample 769 is also light and has more sweetness as compared to other samples of
Cooca. Both sample 315 and 486 have equal Firmness. Sample 315 scores high on Shine,
Bitterness and Cocoa Odour as compared to other samples.Sample 137 is found to have
moderate scores for all the seven attributes. Sample 769 has the least Firmness score, is less
bitter, low Cocoa odour and has least shine.
Table Summary table of Analysis of Variance (ANOVA) for each attribute
Attributes
Significance level (p value)
R squaredSample Panellist Sample *
Panellist
Shine 0.000 0.990 0.521 0.662
Lightness 0.000 0.710 0.998 0.528
Cocoa Odour 0.000 0.929 0.887 0.551
Bitterness 0.000 0.718 0.889 0.743
Sweetness 0.000 0.733 0.964 0.523
Firmness 0.000 0.636 0.813 0.637
Melting 0.000 0.607 0.997 0.473
The univariate analysis of variance shows that there are statistically significant
differences in attributes of the 4 Cocoa samples at 0.05 level of significance. However there
exists statistically no significant differences in the scores given to the samples by the analysts. In
Document Page
9FOOD CHARACTERISATION
addition there are exists statistically no significant differences in the interaction scores of
Panelists and Samples.
tabler-icon-diamond-filled.svg

Paraphrase This Document

Need a fresh take? Get an instant paraphrase of this document with our AI Paraphraser
Document Page
Running head: FOOD CHARACTERISATION
Table 6 Summary table of multiple pair comparison (Tukey’s HSD) for each sample Cocoa 50%
Shine Lightness Cocoa Odour Bitterness Sweetness Firmness Melting
Cocoa
50%
62% Cocoa -2.360.000 1.530.063 -1.710.035 -3.890.000 0.610.765 -2.330.001 -0.360.947
72% Cocoa -1.500.030 1.960.010 -0.980.386 -3.300.000 2.070.10 -2.330.001 1.860.035
33% Cocoa 1.980.002 -1.740.027 2.300.002 1.480.054 -2.010.013 1.870.014 -2.060.016
X = superscript to show significant differences if any.
Summary table of multiple pair comparison (Tukey’s HSD) for each sample Cocoa 62%
Shine Lightness Cocoa Odour Bitterness Sweetness Firmness Melting
Cocoa
62%
50%
Cocoa
2.360.000 -1.530.063 1.710.035 3.890.000 -0.610.765 2.330.001 0.360.947
72%
Cocoa
0.860.362 0.430.891 0.730.628 0.590.722 1.460.108 0.0001.000 2.220.008
33%
Cocoa
4.340.000 -3.280.000 4.010.000 5.370.000 -2.620.001 4.200.000 -1.700.061
X = superscript to show significant differences if any.
Document Page
1FOOD CHARACTERISATION
Summary table of multiple pair comparison (Tukey’s HSD) for each sample Cocoa 72%
Shine Lightness Cocoa Odour Bitterness Sweetness Firmness Melting
Cocoa
72%
50%
Cocoa
1.500.030 -1.960.010 0.980.386 3.300.000 -2.070.010 2.330.001 -1.860.035
62%
Cocoa
-0.860.362 -0.430.891 -0.730.628 -0.590.722 -1.460.108 0.0001.000 -2.220.008
33%
Cocoa
3.480.000 -3.710.000 3.280.000 4.780.000 -4.070.000 4.200.000 -3.920.000
X = superscript to show significant differences if any.
Summary table of multiple pair comparison (Tukey’s HSD) for each sample Cocoa 33%
Shine Lightness Cocoa Odour Bitterness Sweetness Firmness Melting
Cocoa
33%
50%
Cocoa
-1.980.002 1.740.027 -2.300.002 -1.480.054 2.010.013 -1.870.014 2.060.016
62%
Cocoa
-4.340.000 3.280.000 -4.010.000 -5.370.000 2.620.001 -4.200.000 1.700.061
72%
Cocoa
-3.480.000 3.710.000 -3.280.000 -4.780.000 4.070.000 -4.200.000 3.920.000
X = superscript to show significant differences if any.
chevron_up_icon
1 out of 16
circle_padding
hide_on_mobile
zoom_out_icon
[object Object]