Codesharing Network Vulnerability in Global Airline Alliances Research
VerifiedAdded on 2022/08/25
|10
|8968
|29
Report
AI Summary
This report investigates the vulnerability of codesharing networks within global airline alliances, specifically Star Alliance, SkyTeam, and oneworld. Utilizing complex network theory and airline schedules data, the study proposes a normalized codesharing network (CN) vulnerability metric to assess the impact of member airline exits on network connectivity. The research compares CN vulnerability with the total network (TN) including routes with and without codesharing, revealing that oneworld is the most vulnerable, followed by SkyTeam and then Star Alliance. The methodology employs the concept of normalized average edge betweenness to measure CN vulnerability, offering a graph theory approach applicable to real-world airline networks. The findings show that the size of a carrier's scheduled operation is not strictly related to its importance for the vulnerability of an airline alliance route network. The study ranks member airlines based on their contribution to overall CN vulnerability and highlights the importance of considering codesharing in future analyses of airline route networks.
Contents lists available at ScienceDirect
Transportation Research Part A
journal homepage: www.elsevier.com/locate/tra
Codesharing network vulnerability of global airline alliances
Richard Klophausa,⁎, Oriol Lordanb
aCompetence Center Aviation Management (CCAM), Worms University of Applied Sciences, 67549 Worms, Germany
b Universitat Politècnica de Catalunya – Barcelona Tech., Department of Management, Colom 11, TR6, 3.17, 08222 Terrassa, Spain
A R T I C L E I N F O
Keywords:
Global airline alliances
Codesharing
Network vulnerability
Complex networks
A B S T R A C T
Global airline alliances provide connectivity based on codesharing agreements between membe
airlines.An alliance memberexit leads to the deletion ofroutes(if not operated by other
members) which affects network connectivity.The paper measures the vulnerability of the co-
desharing network (CN) of Star Alliance, SkyTeam and oneworld, respectively, by applying the
theory of complex networks.A normalized CN vulnerability metric is proposed.Using airline
schedules data, a ranking of member airlines according to their share in the overall CN vulner-
ability is derived. The results for CNs are compared with the ones for the respective total netwo
(TN) that includes routes with and without codesharing. The findings show that oneworld is the
most vulnerable globalairline alliance,SkyTeam ranks second followed by Star Alliance.The
proposed graph theory approach mightbecome a building block for a more comprehensive
measurement of real world airline networks.
1. Introduction
The restructuring of airline activities into branded global alliances has been one of the major traits of this industry since Star
Alliance was founded in 1997,followed by the formation ofoneworld in 1999 and SkyTeam in 2000.Global alliances provide
network connectivity based on codesharing agreements between member airlines. Codesharing is an interline partnership whe
carrier sell tickets by placing its designator code on another carrier's flights. The airline selling seats is referred to as the marke
carrier and the airline providing the flight is referred to as the operating carrier. While codesharing dates back to the 1960s, it o
became common in the early 1990s. The launch of the modern era of global airline alliances began with the large-scale codesh
agreement between Northwest Airlines and KLM in 1989. The aim is that the route network of a global alliance appears to be an
extension of each partner’s network.Codesharing in combination with coordinated flight schedules allows the provision of con-
tinuous services for passengers connecting between airlines. However, alliance members may take advantage of the route netw
partner airlines even without codesharing, e.g., due to interline agreements between individual airlines that cover connecting fl
A codeshare agreement usually requires an interline agreement.
At present, Star Alliance has 28 member airlines, SkyTeam 20, and oneworld 14 (cf. Appendix A) which together have a shar
around 60% in worldwide air traffic. Extensive codesharing among global alliances allows airlines to offer routes without operati
them which is cost-efficient. Avoiding overlapping operations also implies less competition. The drawback is a dependency on p
airlines. A member exit leads to the deletion of routes (if not operated by other alliance members) which affects network conne
In 2014, US Airways and TAM left Star Alliance after these two carriers merged with airlines from oneworld. oneworld on its part
Malév after the financial collapse of this former Hungarian flag carrier in 2012. In early 2016, Qatar Airways threatened to withd
from oneworld should fellow member American Airlines continue to push the US government to restrict market access for the G
https://doi.org/10.1016/j.tra.2018.02.010
Received 11 August 2017; Received in revised form 13 February 2018; Accepted 19 February 2018
⁎ Corresponding author.
E-mail addresses: klophaus@hs-worms.de (R. Klophaus), oriol.lordan@upc.edu (O. Lordan).
Transportation Research Part A 111 (2018) 1–10
0965-8564/ © 2018 Elsevier Ltd. All rights reserved.
T
Paraphrase This Document
Need a fresh take? Get an instant paraphrase of this document with our AI Paraphraser
carriers.An exit of partner airlines has negative consequences for global alliances,e.g.,in the form of sunk costs due to alliance-
specific investments or the risk that former alliance members use confidential information to their competitive advantage. Furth
implies a decrease in network coverage. The assessment of the (potential) damage to the codesharing network (CN) of global a
alliances is the subject matter of the present paper.
Not all member exits have the same impact because some airlines contribute more to the CN of a global alliance than others
Therefore, it is an important issue for the managing bodies of an alliance how to accurately assess the impact of an exit of a giv
member airline and similarly,how to develop a CN with appropriate partner selection.This paper studies the CN vulnerability of
global alliances to member exits.We propose measures that can be instrumental in assessing the dependency of an alliance on a
member’s route network and can also serve to develop a more resilient CN. The results for CNs are compared with the ones for
respective total network (TN) that includes routes with and without codesharing.
Research on airline alliances and codesharing among airlines includes several studies on the effects of airline alliances on tra
volumes and airfares (Oum et al., 1996; Park, 1997; Park and Zhang, 1998; Brueckner, 2001; Brueckner et al., 2011; Zou et al.,
Kleymann and Seristö (2001) analyzed the trade-off between alliance benefits and risks. Douglas and Tan (2017) examined whe
the formation of global airline alliances resulted in an increase in profitability for the founding members. Garg (2016) presented
model based approach to select strategic alliance partners. Different reasons for a company to leave an inter-firm co-operation
discussed by Sroka and Hittmár (2013). The welfare effects of codesharing agreements have been investigated by Hassin and S
(2004) and, more recently, Adler and Hanany (2016).
There is an increasing and extensive literature of transport vulnerability studies. This paper measures the (potential) damag
the CNs of global airline alliances caused by member exits. Such alliances constitute an intermediate level of air transport netw
between individualairline networks and the industry network (Lordan et al.,2014a).Mattsson and Jenelius (2015) provide an
overview of recent research on vulnerability and resilience of transport systems.While they point out that there is no commonly
agreed definition of transport system vulnerability,they conceptualize vulnerability as the susceptibility oftransport systems to
infrequent events that can result in considerable network degradations. In the context of the present paper, the infrequent eve
member exit having an adverse impact on the CN ofa global airline alliance.The study ofair transport networks includes the
topological analysis of global (Guimerà and Amaral, 2004; Guimerà et al., 2005) and regional (Bagler, 2008; Zhang et al., 2010)
networks. Vulnerability is investigated for global (Lordan et al., 2014b) and regional (Chi and Cai, 2004; Du et al., 2016) networ
Lordan et al. (2015) examine the robustness of alliance airline route networks based on the assumption of unweighted network
considering operating flights.Hence, the differing economic relevance of a given route operated by one member to other alliance
members is disregarded. Weights could be based on the number of flight frequencies or seat capacities, and also by distinguish
between domestic, continental and intercontinental routes. The consideration of codesharing as an indicator of route relevance
the perspective of partner airlines represents a basic weighting scheme to enhance the practical meaning of the vulnerability m
sures. CNs are subsets of the respective TNs which consist only of operated routes that have a marketing flight number by at le
other carrier belonging to the same alliance.Our paper only looks at codesharing between member airlines ofthe same global
alliance.In spite of this,the industry showcases other codesharing partnerships.There is codesharing between aligned and non-
aligned airlines (e.g.,Qantas and Emirates) and between carriers belonging to the same holding company (e.g.,Lufthansa and
Eurowings).Codesharing across globalalliances is rather unusual.One example is Aeroflot and Finnair on the Helsinki-Moscow-
route.
In this paper, CN vulnerability of real world networks is analyzed building on the theory of complex networks (Estrada, 2011;
Estrada and Knight,2015). More specifically, CN vulnerability is measured using the conceptof normalized average edge be-
tweenness (Mishkovski et al.,2011).The proposed method to measure CN vulnerability relates to work using a graph theory ap-
proach to develop strategies to increase the resilience of air traffic networks to disruptive events, such as extreme weather eve
strike action or terrorist threats (Dunn and Wilkinson,2015).It might also be valuable for a more comprehensive study of route
networks that include other network indicators such as hubness and size (Roucolle et al., 2017).
The proposed methodology provides a normalized measure of the vulnerability of a given CN to (potential) member exits. Da
comes from the OAG airline schedules database.One result of applying this measure is that oneworld is the most vulnerable CN,
SkyTeam ranks second and Star Alliance is the most robust CN.Further,the paper indicates a positive relation between network
robustness and route overlaps among members of globalairline alliances.We also rank member airlines according to their con-
tribution to the overall CN vulnerability. Our paper shows that the size of a carrier’s scheduled operation is not strictly related to
carrier’s importance for the vulnerability of an airline alliance route network.Finally, a comparison with results for TNs as un-
weighted alliance route networks illustrates the importance of bringing out relevant routes in future analysis of airline route net
works.
2. Methodology
A codesharing network (CN) contains airports (nodes) connected by codeshared routes (edges), i.e., two airports are linked i
alliance member is operating flights between them with a designator code of another carrier from the same alliance. The propo
metric to assess CN vulnerability extends the graph theory concept of average edge betweenness as introduced by Boccaletti e
(2007) for the graph G:
∑=
∈
b G E b( ) 1
| | l E
l
(1)
R. Klophaus, O. Lordan Transportation Research Part A 111 (2018) 1–10
2
where |E| is the number of edges and bl is the edge betweenness of the edge l defined as
∑=
≠
b n l
n
( )
l
i j
ij
ij (2)
where nij(l) is the number of geodesics (shortest paths) from node i to node j that contain the edge l, and nij is the total number of
shortest paths between i and j. If N represents the number of nodes of a network, then the b(G) values for a complete graph an
graph are
= = +
b G b G N N
( ) 1 and ( ) ( 1)
6
complete path (3)
and, hence, b(Gcomplete) ≤ b(G) ≤ b(Gpath). G is more robust than G', if b(G) < b(G'). The normalized average edge betweenness of a
network is defined as (Mishkovski et al., 2011)
= −
− = −
−
+
b G b G b G
b G b G
b G
( ) ( ) ( )
( ) ( )
( ) 1
1
nor
complete
path complete N N( 1)
6 (4)
where bnor(G) ranges from 0 (i.e., the most robust network) to 1 (i.e., the most vulnerable network). Thus, bnor(G) is a normalized
measure of network vulnerability. The contribution of a member airline to the overall vulnerability of a CN can then be calculate
the relative difference of the normalized average edge betweenness, that is
= ′ −
D b G b G
b G
( ) ( )
( )
member nor nor
nor (5)
where G'is the graph obtained from G (i.e.,the entire CN) after removing the edges of the exiting member airline which are not
operated by any other member. A positive value of Dmemberimplies that the CN becomes more vulnerable. The higher the value of
Dmemberthe more negatively affected is the CN by the exit of the respective airline. A negative value of Dmemberwould mean that a
member exit is actually decreasing the CN vulnerability, i.e., the alliance is more robust without this airline.
3. Results
The vulnerability of the three global alliances is analyzed using OAG airline schedules data for the week ending September 1
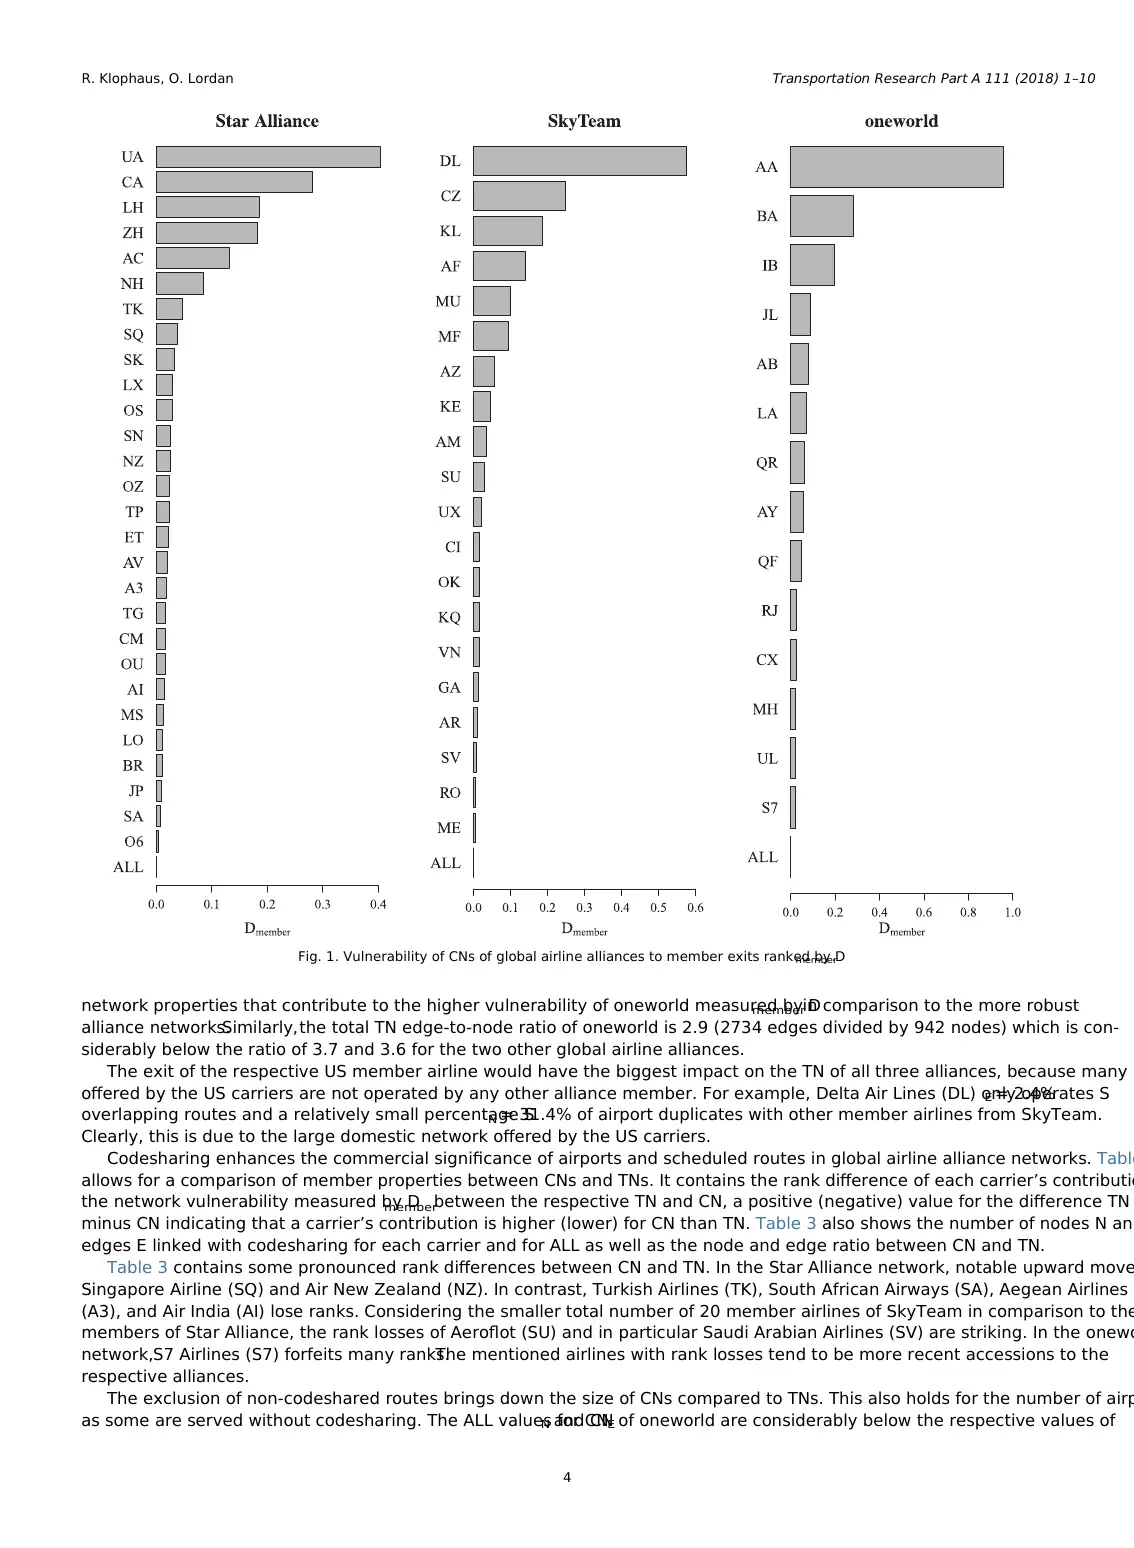
2016.In Fig. 1 we rank member airlines of Star Alliance,SkyTeam and oneworld based on their contribution to the codesharing
network (CN) of the respective alliance, i.e., according to their Dmembervalue. ALL (with value 0) refers to the entire CN without any
exit.
As Dmemberis calculated with the normalized average edge betweenness bnor(G) of a specific alliance, this metric measures the
relative impact on network vulnerability caused by the removal of an airline from this alliance.As the value of bnor(G) can vary
between alliances, the absolute impact on network vulnerability can be quite different across alliances for similar values of Dmember.
Taking this into account,the relative impact of American Airlines (AA) on oneworld’s CN is comparatively larger than the one of
United Airlines (UA) on Star Alliance and Delta Airlines (DL) on SkyTeam.This is illustrated in Fig.1 by the length of the bars
representing UA, DL, and AA in relation to the bars of the other carriers of Star Alliance, SkyTeam, and oneworld, respectively.
Table 1 provides the values ofthe average edge betweenness b(G'),the normalized average edge betweenness bnor(G'), and
relative difference of the normalized average edge betweenness Dmemberfor each member airline. For ALL, b(G') and bnor(G') equal b
(G) and bnor(G), respectively,as ALL stands for the CN without any member removal.The bnor(G) value ALL = 0.00724 for one-
world’s entire CN is larger than the respective values for SkyTeam and Star Alliance which makes it the most vulnerable among
three CNs. While the values of Dmemberand bnor(G') represent a one-to-one mapping, i.e., a higher (lower) value of Dmemberis strictly
related to a higher (lower) value of bnor(G'), this is not the case for the relation between Dmemberand b(G'). For example, the bnor(G') of
the Star Alliance members United Airlines (UA) and Air China (CA) are 0.00508 and 0.00464, respectively, while the values for b
have a reverse order (277.7 and 312.6).The average edge betweenness does not account for the change in the number of airport
nodes of a CN resulting from a member exit. This is the reason why Dmemberis computed as the relative difference of the normalized
average edge betweenness of a CN with and without a given member airline.
CNs contain only routes operated by one member airline of a global airline alliance network that also has codesharing (i.e.,a
marketing flight number) by at least another carrier from the respective alliance. Codesharing is an indicator for relevance of a
alliance route. This can also be seen as a basic weighting scheme assigning the weight “1” to all codeshared routes and “0” to
codeshared routes. The results for CNs are now related to the respective total network (TN) that includes routes with and witho
codesharing.
Table 2 provides the values for nodes N, edges E, shared nodes SN, and shared edges SE of each airline belonging to one of the
three TNs. SN and SE stand for the number of airport and route duplicates in a TN with other member airlines out of the total allian
nodes and edges. All non-shared nodes and edges of an airline, i.e., all airports and routes not operated by any other alliance m
disappear from the TN if this airline leaves the alliance. For ALL, SN and SE stand for all duplicates among its members out of the total
alliance nodes and edges. 39.0% of all 1207 weekly scheduled airports operated by Star Alliance in September 2016 are duplic
33.4% out of 1058 at SkyTeam and only 27.3% out of 942 at oneworld. oneworld has the lowest SE percentage with 2.6%, while SE
percentages for Star Alliance and SkyTeam are 5.8% and 9.0%, respectively. SN and SE for ALL are the lowest for oneworld which are
R. Klophaus, O. Lordan Transportation Research Part A 111 (2018) 1–10
3
∑=
≠
b n l
n
( )
l
i j
ij
ij (2)
where nij(l) is the number of geodesics (shortest paths) from node i to node j that contain the edge l, and nij is the total number of
shortest paths between i and j. If N represents the number of nodes of a network, then the b(G) values for a complete graph an
graph are
= = +
b G b G N N
( ) 1 and ( ) ( 1)
6
complete path (3)
and, hence, b(Gcomplete) ≤ b(G) ≤ b(Gpath). G is more robust than G', if b(G) < b(G'). The normalized average edge betweenness of a
network is defined as (Mishkovski et al., 2011)
= −
− = −
−
+
b G b G b G
b G b G
b G
( ) ( ) ( )
( ) ( )
( ) 1
1
nor
complete
path complete N N( 1)
6 (4)
where bnor(G) ranges from 0 (i.e., the most robust network) to 1 (i.e., the most vulnerable network). Thus, bnor(G) is a normalized
measure of network vulnerability. The contribution of a member airline to the overall vulnerability of a CN can then be calculate
the relative difference of the normalized average edge betweenness, that is
= ′ −
D b G b G
b G
( ) ( )
( )
member nor nor
nor (5)
where G'is the graph obtained from G (i.e.,the entire CN) after removing the edges of the exiting member airline which are not
operated by any other member. A positive value of Dmemberimplies that the CN becomes more vulnerable. The higher the value of
Dmemberthe more negatively affected is the CN by the exit of the respective airline. A negative value of Dmemberwould mean that a
member exit is actually decreasing the CN vulnerability, i.e., the alliance is more robust without this airline.
3. Results
The vulnerability of the three global alliances is analyzed using OAG airline schedules data for the week ending September 1
2016.In Fig. 1 we rank member airlines of Star Alliance,SkyTeam and oneworld based on their contribution to the codesharing
network (CN) of the respective alliance, i.e., according to their Dmembervalue. ALL (with value 0) refers to the entire CN without any
exit.
As Dmemberis calculated with the normalized average edge betweenness bnor(G) of a specific alliance, this metric measures the
relative impact on network vulnerability caused by the removal of an airline from this alliance.As the value of bnor(G) can vary
between alliances, the absolute impact on network vulnerability can be quite different across alliances for similar values of Dmember.
Taking this into account,the relative impact of American Airlines (AA) on oneworld’s CN is comparatively larger than the one of
United Airlines (UA) on Star Alliance and Delta Airlines (DL) on SkyTeam.This is illustrated in Fig.1 by the length of the bars
representing UA, DL, and AA in relation to the bars of the other carriers of Star Alliance, SkyTeam, and oneworld, respectively.
Table 1 provides the values ofthe average edge betweenness b(G'),the normalized average edge betweenness bnor(G'), and
relative difference of the normalized average edge betweenness Dmemberfor each member airline. For ALL, b(G') and bnor(G') equal b
(G) and bnor(G), respectively,as ALL stands for the CN without any member removal.The bnor(G) value ALL = 0.00724 for one-
world’s entire CN is larger than the respective values for SkyTeam and Star Alliance which makes it the most vulnerable among
three CNs. While the values of Dmemberand bnor(G') represent a one-to-one mapping, i.e., a higher (lower) value of Dmemberis strictly
related to a higher (lower) value of bnor(G'), this is not the case for the relation between Dmemberand b(G'). For example, the bnor(G') of
the Star Alliance members United Airlines (UA) and Air China (CA) are 0.00508 and 0.00464, respectively, while the values for b
have a reverse order (277.7 and 312.6).The average edge betweenness does not account for the change in the number of airport
nodes of a CN resulting from a member exit. This is the reason why Dmemberis computed as the relative difference of the normalized
average edge betweenness of a CN with and without a given member airline.
CNs contain only routes operated by one member airline of a global airline alliance network that also has codesharing (i.e.,a
marketing flight number) by at least another carrier from the respective alliance. Codesharing is an indicator for relevance of a
alliance route. This can also be seen as a basic weighting scheme assigning the weight “1” to all codeshared routes and “0” to
codeshared routes. The results for CNs are now related to the respective total network (TN) that includes routes with and witho
codesharing.
Table 2 provides the values for nodes N, edges E, shared nodes SN, and shared edges SE of each airline belonging to one of the
three TNs. SN and SE stand for the number of airport and route duplicates in a TN with other member airlines out of the total allian
nodes and edges. All non-shared nodes and edges of an airline, i.e., all airports and routes not operated by any other alliance m
disappear from the TN if this airline leaves the alliance. For ALL, SN and SE stand for all duplicates among its members out of the total
alliance nodes and edges. 39.0% of all 1207 weekly scheduled airports operated by Star Alliance in September 2016 are duplic
33.4% out of 1058 at SkyTeam and only 27.3% out of 942 at oneworld. oneworld has the lowest SE percentage with 2.6%, while SE
percentages for Star Alliance and SkyTeam are 5.8% and 9.0%, respectively. SN and SE for ALL are the lowest for oneworld which are
R. Klophaus, O. Lordan Transportation Research Part A 111 (2018) 1–10
3
⊘ This is a preview!⊘
Do you want full access?
Subscribe today to unlock all pages.
Trusted by 1+ million students worldwide
network properties that contribute to the higher vulnerability of oneworld measured by Dmemberin comparison to the more robust
alliance networks.Similarly,the total TN edge-to-node ratio of oneworld is 2.9 (2734 edges divided by 942 nodes) which is con-
siderably below the ratio of 3.7 and 3.6 for the two other global airline alliances.
The exit of the respective US member airline would have the biggest impact on the TN of all three alliances, because many r
offered by the US carriers are not operated by any other alliance member. For example, Delta Air Lines (DL) only operates SE = 2.4%
overlapping routes and a relatively small percentage SN = 31.4% of airport duplicates with other member airlines from SkyTeam.
Clearly, this is due to the large domestic network offered by the US carriers.
Codesharing enhances the commercial significance of airports and scheduled routes in global airline alliance networks. Table
allows for a comparison of member properties between CNs and TNs. It contains the rank difference of each carrier’s contributio
the network vulnerability measured by Dmemberbetween the respective TN and CN, a positive (negative) value for the difference TN
minus CN indicating that a carrier’s contribution is higher (lower) for CN than TN. Table 3 also shows the number of nodes N and
edges E linked with codesharing for each carrier and for ALL as well as the node and edge ratio between CN and TN.
Table 3 contains some pronounced rank differences between CN and TN. In the Star Alliance network, notable upward move
Singapore Airline (SQ) and Air New Zealand (NZ). In contrast, Turkish Airlines (TK), South African Airways (SA), Aegean Airlines
(A3), and Air India (AI) lose ranks. Considering the smaller total number of 20 member airlines of SkyTeam in comparison to the
members of Star Alliance, the rank losses of Aeroflot (SU) and in particular Saudi Arabian Airlines (SV) are striking. In the onewo
network,S7 Airlines (S7) forfeits many ranks.The mentioned airlines with rank losses tend to be more recent accessions to the
respective alliances.
The exclusion of non-codeshared routes brings down the size of CNs compared to TNs. This also holds for the number of airp
as some are served without codesharing. The ALL values for CNN and CNE of oneworld are considerably below the respective values of
Fig. 1. Vulnerability of CNs of global airline alliances to member exits ranked by Dmember.
R. Klophaus, O. Lordan Transportation Research Part A 111 (2018) 1–10
4
Paraphrase This Document
Need a fresh take? Get an instant paraphrase of this document with our AI Paraphraser
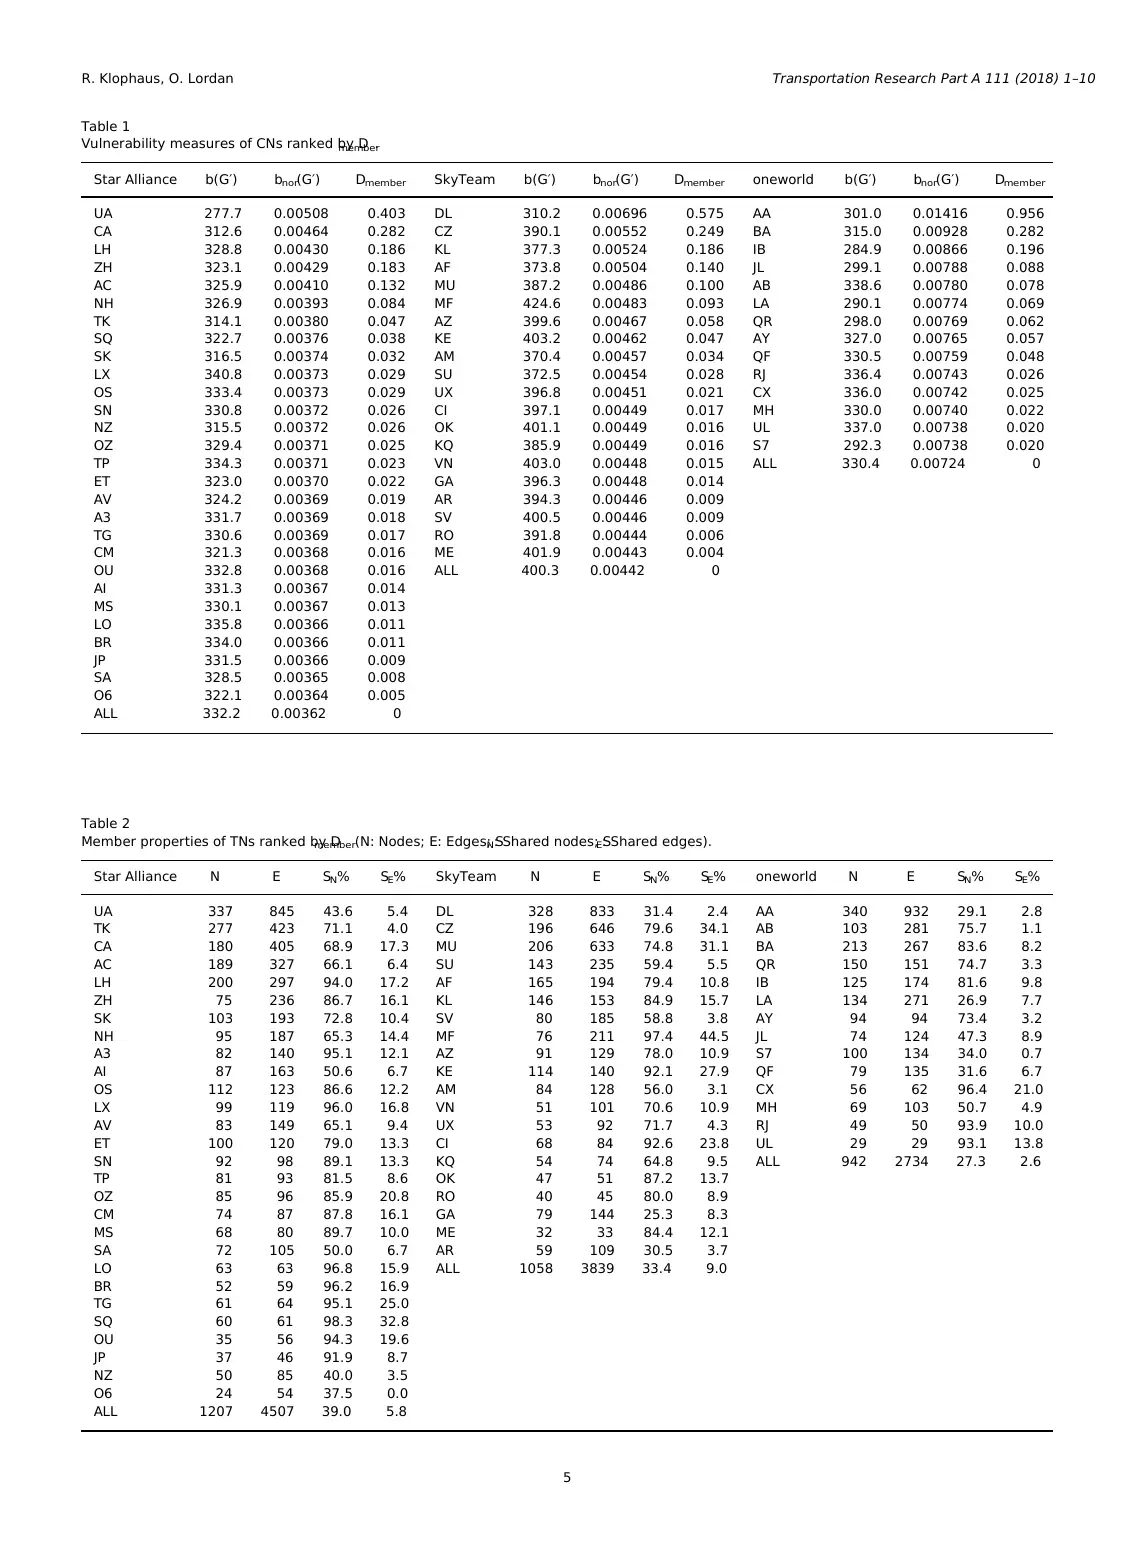
Table 1
Vulnerability measures of CNs ranked by Dmember.
Star Alliance b(G′) bnor(G′) Dmember SkyTeam b(G′) bnor(G′) Dmember oneworld b(G′) bnor(G′) Dmember
UA 277.7 0.00508 0.403 DL 310.2 0.00696 0.575 AA 301.0 0.01416 0.956
CA 312.6 0.00464 0.282 CZ 390.1 0.00552 0.249 BA 315.0 0.00928 0.282
LH 328.8 0.00430 0.186 KL 377.3 0.00524 0.186 IB 284.9 0.00866 0.196
ZH 323.1 0.00429 0.183 AF 373.8 0.00504 0.140 JL 299.1 0.00788 0.088
AC 325.9 0.00410 0.132 MU 387.2 0.00486 0.100 AB 338.6 0.00780 0.078
NH 326.9 0.00393 0.084 MF 424.6 0.00483 0.093 LA 290.1 0.00774 0.069
TK 314.1 0.00380 0.047 AZ 399.6 0.00467 0.058 QR 298.0 0.00769 0.062
SQ 322.7 0.00376 0.038 KE 403.2 0.00462 0.047 AY 327.0 0.00765 0.057
SK 316.5 0.00374 0.032 AM 370.4 0.00457 0.034 QF 330.5 0.00759 0.048
LX 340.8 0.00373 0.029 SU 372.5 0.00454 0.028 RJ 336.4 0.00743 0.026
OS 333.4 0.00373 0.029 UX 396.8 0.00451 0.021 CX 336.0 0.00742 0.025
SN 330.8 0.00372 0.026 CI 397.1 0.00449 0.017 MH 330.0 0.00740 0.022
NZ 315.5 0.00372 0.026 OK 401.1 0.00449 0.016 UL 337.0 0.00738 0.020
OZ 329.4 0.00371 0.025 KQ 385.9 0.00449 0.016 S7 292.3 0.00738 0.020
TP 334.3 0.00371 0.023 VN 403.0 0.00448 0.015 ALL 330.4 0.00724 0
ET 323.0 0.00370 0.022 GA 396.3 0.00448 0.014
AV 324.2 0.00369 0.019 AR 394.3 0.00446 0.009
A3 331.7 0.00369 0.018 SV 400.5 0.00446 0.009
TG 330.6 0.00369 0.017 RO 391.8 0.00444 0.006
CM 321.3 0.00368 0.016 ME 401.9 0.00443 0.004
OU 332.8 0.00368 0.016 ALL 400.3 0.00442 0
AI 331.3 0.00367 0.014
MS 330.1 0.00367 0.013
LO 335.8 0.00366 0.011
BR 334.0 0.00366 0.011
JP 331.5 0.00366 0.009
SA 328.5 0.00365 0.008
O6 322.1 0.00364 0.005
ALL 332.2 0.00362 0
Table 2
Member properties of TNs ranked by Dmember(N: Nodes; E: Edges; SN: Shared nodes; SE: Shared edges).
Star Alliance N E SN% SE% SkyTeam N E SN% SE% oneworld N E SN% SE%
UA 337 845 43.6 5.4 DL 328 833 31.4 2.4 AA 340 932 29.1 2.8
TK 277 423 71.1 4.0 CZ 196 646 79.6 34.1 AB 103 281 75.7 1.1
CA 180 405 68.9 17.3 MU 206 633 74.8 31.1 BA 213 267 83.6 8.2
AC 189 327 66.1 6.4 SU 143 235 59.4 5.5 QR 150 151 74.7 3.3
LH 200 297 94.0 17.2 AF 165 194 79.4 10.8 IB 125 174 81.6 9.8
ZH 75 236 86.7 16.1 KL 146 153 84.9 15.7 LA 134 271 26.9 7.7
SK 103 193 72.8 10.4 SV 80 185 58.8 3.8 AY 94 94 73.4 3.2
NH 95 187 65.3 14.4 MF 76 211 97.4 44.5 JL 74 124 47.3 8.9
A3 82 140 95.1 12.1 AZ 91 129 78.0 10.9 S7 100 134 34.0 0.7
AI 87 163 50.6 6.7 KE 114 140 92.1 27.9 QF 79 135 31.6 6.7
OS 112 123 86.6 12.2 AM 84 128 56.0 3.1 CX 56 62 96.4 21.0
LX 99 119 96.0 16.8 VN 51 101 70.6 10.9 MH 69 103 50.7 4.9
AV 83 149 65.1 9.4 UX 53 92 71.7 4.3 RJ 49 50 93.9 10.0
ET 100 120 79.0 13.3 CI 68 84 92.6 23.8 UL 29 29 93.1 13.8
SN 92 98 89.1 13.3 KQ 54 74 64.8 9.5 ALL 942 2734 27.3 2.6
TP 81 93 81.5 8.6 OK 47 51 87.2 13.7
OZ 85 96 85.9 20.8 RO 40 45 80.0 8.9
CM 74 87 87.8 16.1 GA 79 144 25.3 8.3
MS 68 80 89.7 10.0 ME 32 33 84.4 12.1
SA 72 105 50.0 6.7 AR 59 109 30.5 3.7
LO 63 63 96.8 15.9 ALL 1058 3839 33.4 9.0
BR 52 59 96.2 16.9
TG 61 64 95.1 25.0
SQ 60 61 98.3 32.8
OU 35 56 94.3 19.6
JP 37 46 91.9 8.7
NZ 50 85 40.0 3.5
O6 24 54 37.5 0.0
ALL 1207 4507 39.0 5.8
R. Klophaus, O. Lordan Transportation Research Part A 111 (2018) 1–10
5
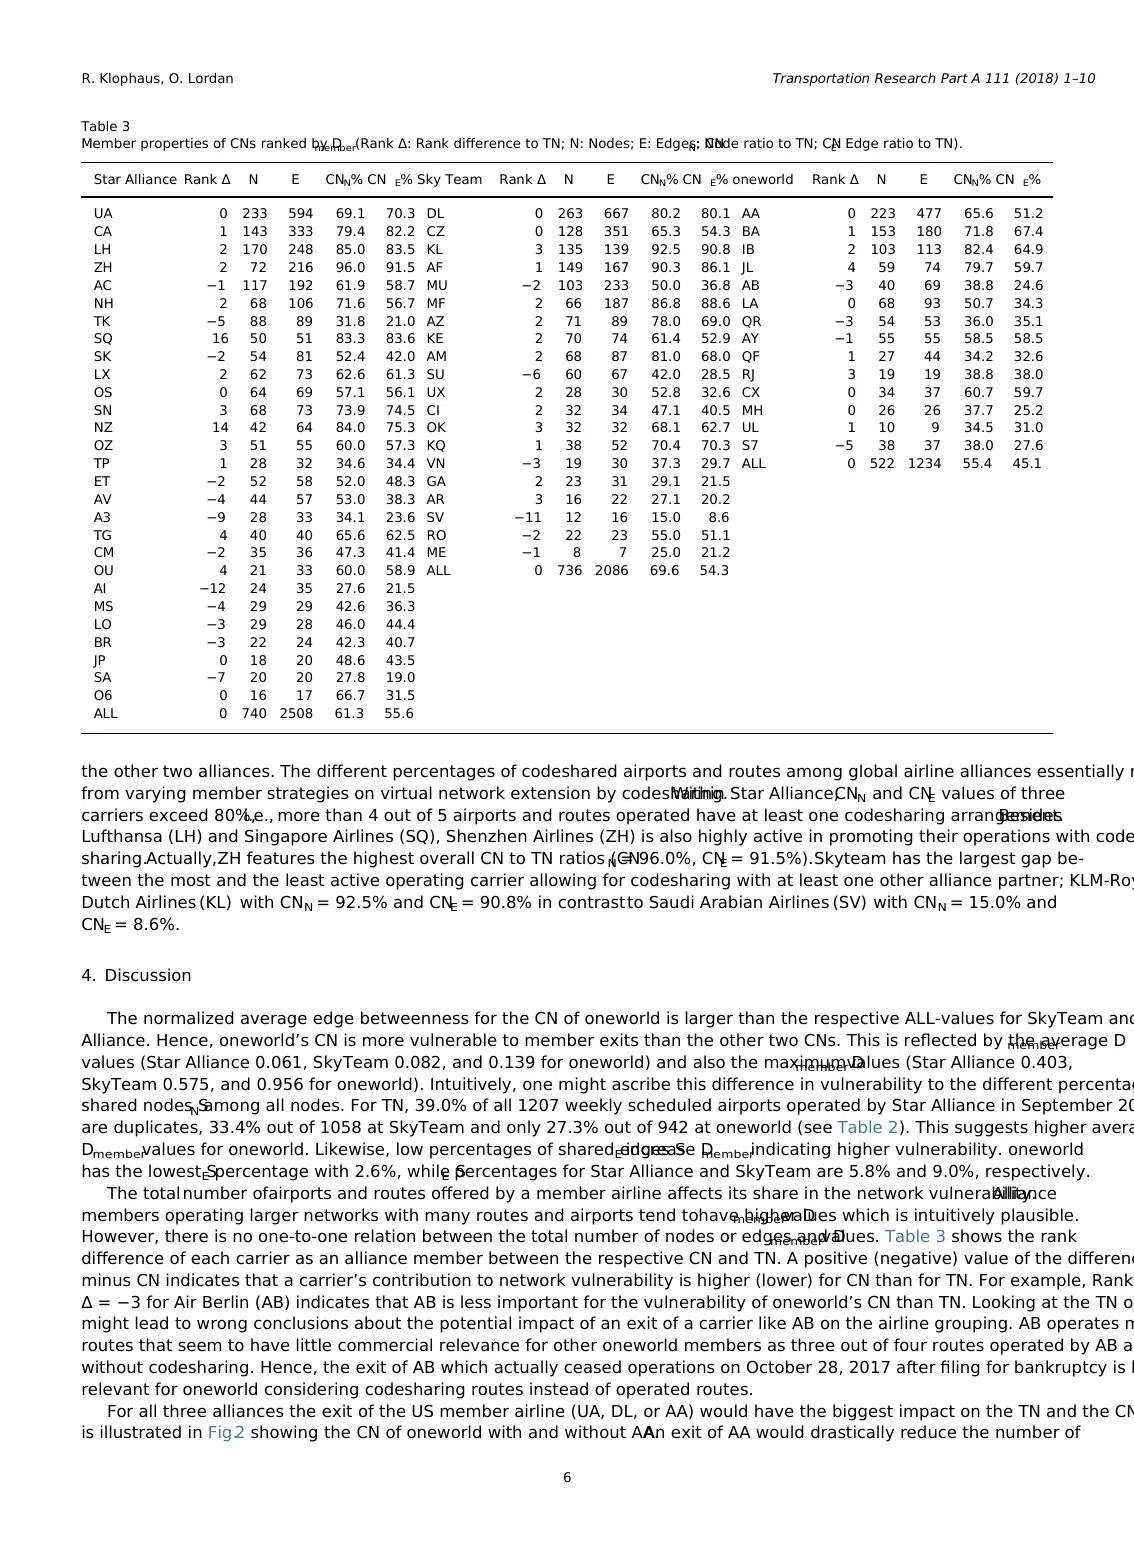
the other two alliances. The different percentages of codeshared airports and routes among global airline alliances essentially r
from varying member strategies on virtual network extension by codesharing.Within Star Alliance,CNN and CNE values of three
carriers exceed 80%,i.e., more than 4 out of 5 airports and routes operated have at least one codesharing arrangement.Besides
Lufthansa (LH) and Singapore Airlines (SQ), Shenzhen Airlines (ZH) is also highly active in promoting their operations with code
sharing.Actually,ZH features the highest overall CN to TN ratios (CNN = 96.0%, CNE = 91.5%).Skyteam has the largest gap be-
tween the most and the least active operating carrier allowing for codesharing with at least one other alliance partner; KLM-Roy
Dutch Airlines (KL) with CN N = 92.5% and CNE = 90.8% in contrastto Saudi Arabian Airlines (SV) with CN N = 15.0% and
CNE = 8.6%.
4. Discussion
The normalized average edge betweenness for the CN of oneworld is larger than the respective ALL-values for SkyTeam and
Alliance. Hence, oneworld’s CN is more vulnerable to member exits than the other two CNs. This is reflected by the average Dmember
values (Star Alliance 0.061, SkyTeam 0.082, and 0.139 for oneworld) and also the maximum Dmembervalues (Star Alliance 0.403,
SkyTeam 0.575, and 0.956 for oneworld). Intuitively, one might ascribe this difference in vulnerability to the different percentag
shared nodes SN among all nodes. For TN, 39.0% of all 1207 weekly scheduled airports operated by Star Alliance in September 20
are duplicates, 33.4% out of 1058 at SkyTeam and only 27.3% out of 942 at oneworld (see Table 2). This suggests higher avera
Dmembervalues for oneworld. Likewise, low percentages of shared edges SE increase Dmemberindicating higher vulnerability. oneworld
has the lowest SE percentage with 2.6%, while SE percentages for Star Alliance and SkyTeam are 5.8% and 9.0%, respectively.
The total number ofairports and routes offered by a member airline affects its share in the network vulnerability.Alliance
members operating larger networks with many routes and airports tend tohave higher Dmembervalues which is intuitively plausible.
However, there is no one-to-one relation between the total number of nodes or edges and Dmembervalues. Table 3 shows the rank
difference of each carrier as an alliance member between the respective CN and TN. A positive (negative) value of the differenc
minus CN indicates that a carrier’s contribution to network vulnerability is higher (lower) for CN than for TN. For example, Rank
Δ = −3 for Air Berlin (AB) indicates that AB is less important for the vulnerability of oneworld’s CN than TN. Looking at the TN on
might lead to wrong conclusions about the potential impact of an exit of a carrier like AB on the airline grouping. AB operates m
routes that seem to have little commercial relevance for other oneworld members as three out of four routes operated by AB ar
without codesharing. Hence, the exit of AB which actually ceased operations on October 28, 2017 after filing for bankruptcy is l
relevant for oneworld considering codesharing routes instead of operated routes.
For all three alliances the exit of the US member airline (UA, DL, or AA) would have the biggest impact on the TN and the CN
is illustrated in Fig.2 showing the CN of oneworld with and without AA.An exit of AA would drastically reduce the number of
Table 3
Member properties of CNs ranked by Dmember(Rank Δ: Rank difference to TN; N: Nodes; E: Edges; CNN: Node ratio to TN; CNE: Edge ratio to TN).
Star Alliance Rank Δ N E CNN% CN E% Sky Team Rank Δ N E CNN% CN E% oneworld Rank Δ N E CNN% CN E%
UA 0 233 594 69.1 70.3 DL 0 263 667 80.2 80.1 AA 0 223 477 65.6 51.2
CA 1 143 333 79.4 82.2 CZ 0 128 351 65.3 54.3 BA 1 153 180 71.8 67.4
LH 2 170 248 85.0 83.5 KL 3 135 139 92.5 90.8 IB 2 103 113 82.4 64.9
ZH 2 72 216 96.0 91.5 AF 1 149 167 90.3 86.1 JL 4 59 74 79.7 59.7
AC −1 117 192 61.9 58.7 MU −2 103 233 50.0 36.8 AB −3 40 69 38.8 24.6
NH 2 68 106 71.6 56.7 MF 2 66 187 86.8 88.6 LA 0 68 93 50.7 34.3
TK −5 88 89 31.8 21.0 AZ 2 71 89 78.0 69.0 QR −3 54 53 36.0 35.1
SQ 16 50 51 83.3 83.6 KE 2 70 74 61.4 52.9 AY −1 55 55 58.5 58.5
SK −2 54 81 52.4 42.0 AM 2 68 87 81.0 68.0 QF 1 27 44 34.2 32.6
LX 2 62 73 62.6 61.3 SU −6 60 67 42.0 28.5 RJ 3 19 19 38.8 38.0
OS 0 64 69 57.1 56.1 UX 2 28 30 52.8 32.6 CX 0 34 37 60.7 59.7
SN 3 68 73 73.9 74.5 CI 2 32 34 47.1 40.5 MH 0 26 26 37.7 25.2
NZ 14 42 64 84.0 75.3 OK 3 32 32 68.1 62.7 UL 1 10 9 34.5 31.0
OZ 3 51 55 60.0 57.3 KQ 1 38 52 70.4 70.3 S7 −5 38 37 38.0 27.6
TP 1 28 32 34.6 34.4 VN −3 19 30 37.3 29.7 ALL 0 522 1234 55.4 45.1
ET −2 52 58 52.0 48.3 GA 2 23 31 29.1 21.5
AV −4 44 57 53.0 38.3 AR 3 16 22 27.1 20.2
A3 −9 28 33 34.1 23.6 SV −11 12 16 15.0 8.6
TG 4 40 40 65.6 62.5 RO −2 22 23 55.0 51.1
CM −2 35 36 47.3 41.4 ME −1 8 7 25.0 21.2
OU 4 21 33 60.0 58.9 ALL 0 736 2086 69.6 54.3
AI −12 24 35 27.6 21.5
MS −4 29 29 42.6 36.3
LO −3 29 28 46.0 44.4
BR −3 22 24 42.3 40.7
JP 0 18 20 48.6 43.5
SA −7 20 20 27.8 19.0
O6 0 16 17 66.7 31.5
ALL 0 740 2508 61.3 55.6
R. Klophaus, O. Lordan Transportation Research Part A 111 (2018) 1–10
6
⊘ This is a preview!⊘
Do you want full access?
Subscribe today to unlock all pages.
Trusted by 1+ million students worldwide
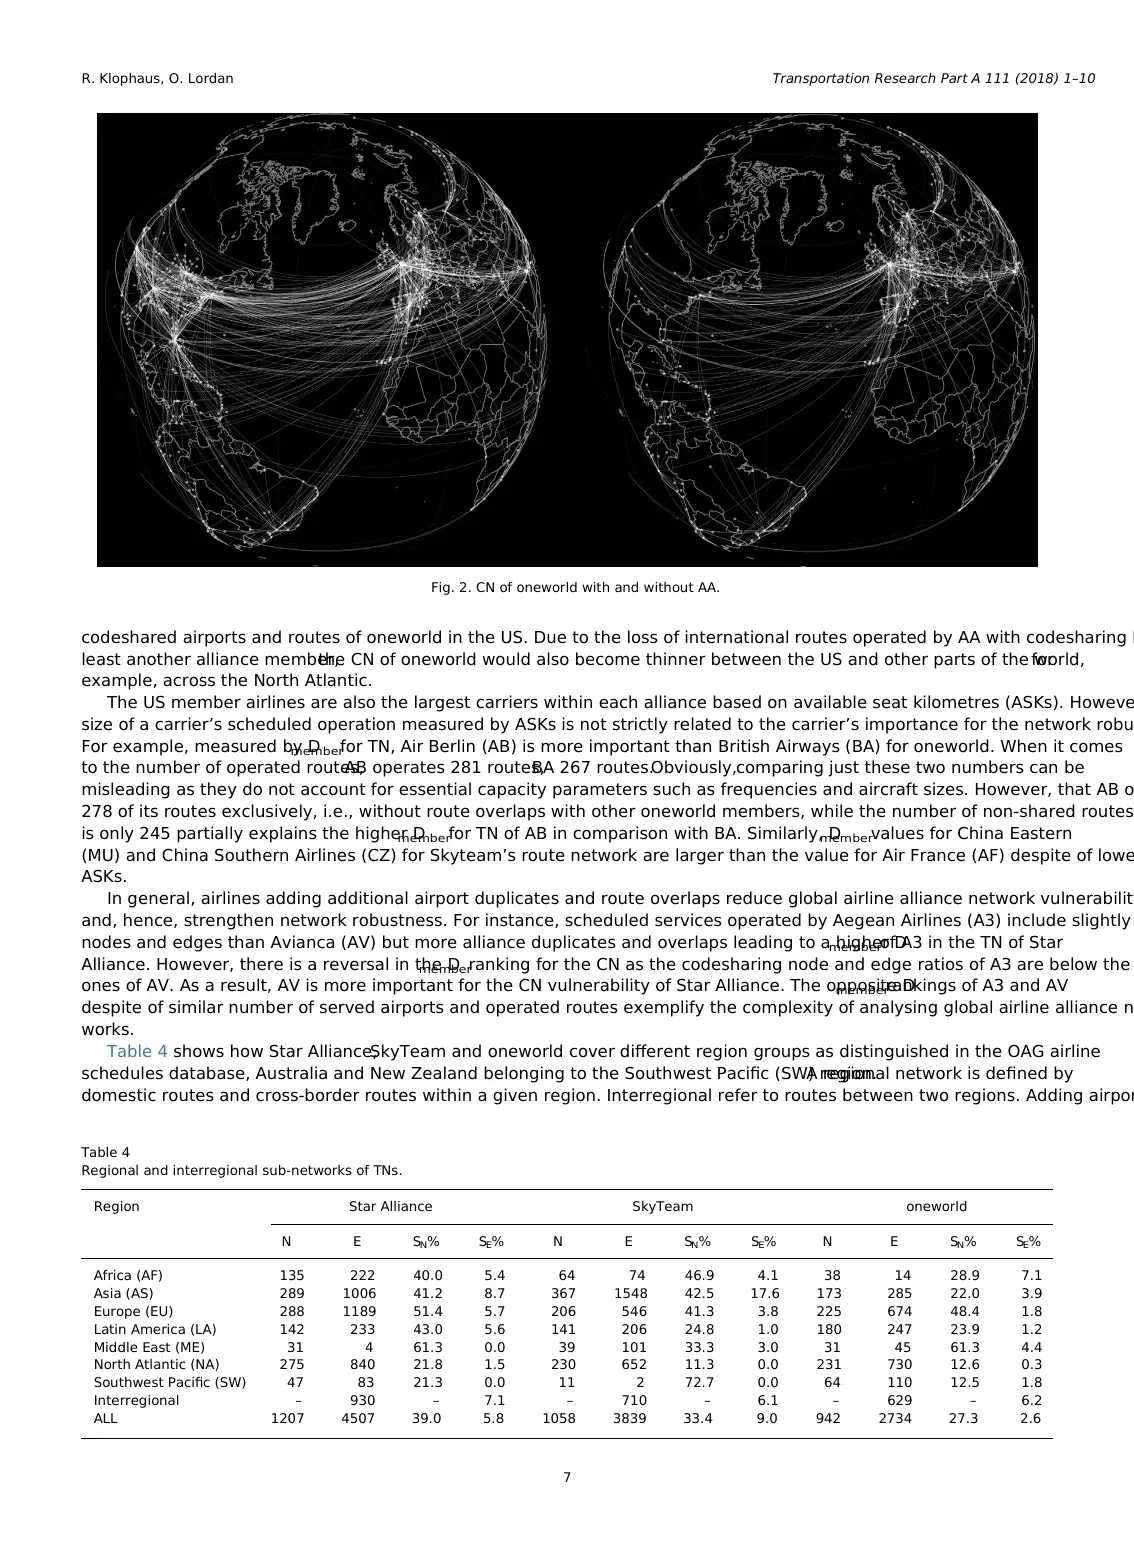
codeshared airports and routes of oneworld in the US. Due to the loss of international routes operated by AA with codesharing b
least another alliance member,the CN of oneworld would also become thinner between the US and other parts of the world,for
example, across the North Atlantic.
The US member airlines are also the largest carriers within each alliance based on available seat kilometres (ASKs). Howeve
size of a carrier’s scheduled operation measured by ASKs is not strictly related to the carrier’s importance for the network robu
For example, measured by Dmemberfor TN, Air Berlin (AB) is more important than British Airways (BA) for oneworld. When it comes
to the number of operated routes,AB operates 281 routes,BA 267 routes.Obviously,comparing just these two numbers can be
misleading as they do not account for essential capacity parameters such as frequencies and aircraft sizes. However, that AB o
278 of its routes exclusively, i.e., without route overlaps with other oneworld members, while the number of non-shared routes
is only 245 partially explains the higher Dmemberfor TN of AB in comparison with BA. Similarly, Dmembervalues for China Eastern
(MU) and China Southern Airlines (CZ) for Skyteam’s route network are larger than the value for Air France (AF) despite of lowe
ASKs.
In general, airlines adding additional airport duplicates and route overlaps reduce global airline alliance network vulnerability
and, hence, strengthen network robustness. For instance, scheduled services operated by Aegean Airlines (A3) include slightly
nodes and edges than Avianca (AV) but more alliance duplicates and overlaps leading to a higher Dmemberof A3 in the TN of Star
Alliance. However, there is a reversal in the Dmemberranking for the CN as the codesharing node and edge ratios of A3 are below the
ones of AV. As a result, AV is more important for the CN vulnerability of Star Alliance. The opposite Dmemberrankings of A3 and AV
despite of similar number of served airports and operated routes exemplify the complexity of analysing global airline alliance n
works.
Table 4 shows how Star Alliance,SkyTeam and oneworld cover different region groups as distinguished in the OAG airline
schedules database, Australia and New Zealand belonging to the Southwest Pacific (SW) region.A regional network is defined by
domestic routes and cross-border routes within a given region. Interregional refer to routes between two regions. Adding airpor
Fig. 2. CN of oneworld with and without AA.
Table 4
Regional and interregional sub-networks of TNs.
Region Star Alliance SkyTeam oneworld
N E SN% SE% N E SN% SE% N E SN% SE%
Africa (AF) 135 222 40.0 5.4 64 74 46.9 4.1 38 14 28.9 7.1
Asia (AS) 289 1006 41.2 8.7 367 1548 42.5 17.6 173 285 22.0 3.9
Europe (EU) 288 1189 51.4 5.7 206 546 41.3 3.8 225 674 48.4 1.8
Latin America (LA) 142 233 43.0 5.6 141 206 24.8 1.0 180 247 23.9 1.2
Middle East (ME) 31 4 61.3 0.0 39 101 33.3 3.0 31 45 61.3 4.4
North Atlantic (NA) 275 840 21.8 1.5 230 652 11.3 0.0 231 730 12.6 0.3
Southwest Pacific (SW) 47 83 21.3 0.0 11 2 72.7 0.0 64 110 12.5 1.8
Interregional – 930 – 7.1 – 710 – 6.1 – 629 – 6.2
ALL 1207 4507 39.0 5.8 1058 3839 33.4 9.0 942 2734 27.3 2.6
R. Klophaus, O. Lordan Transportation Research Part A 111 (2018) 1–10
7
Paraphrase This Document
Need a fresh take? Get an instant paraphrase of this document with our AI Paraphraser
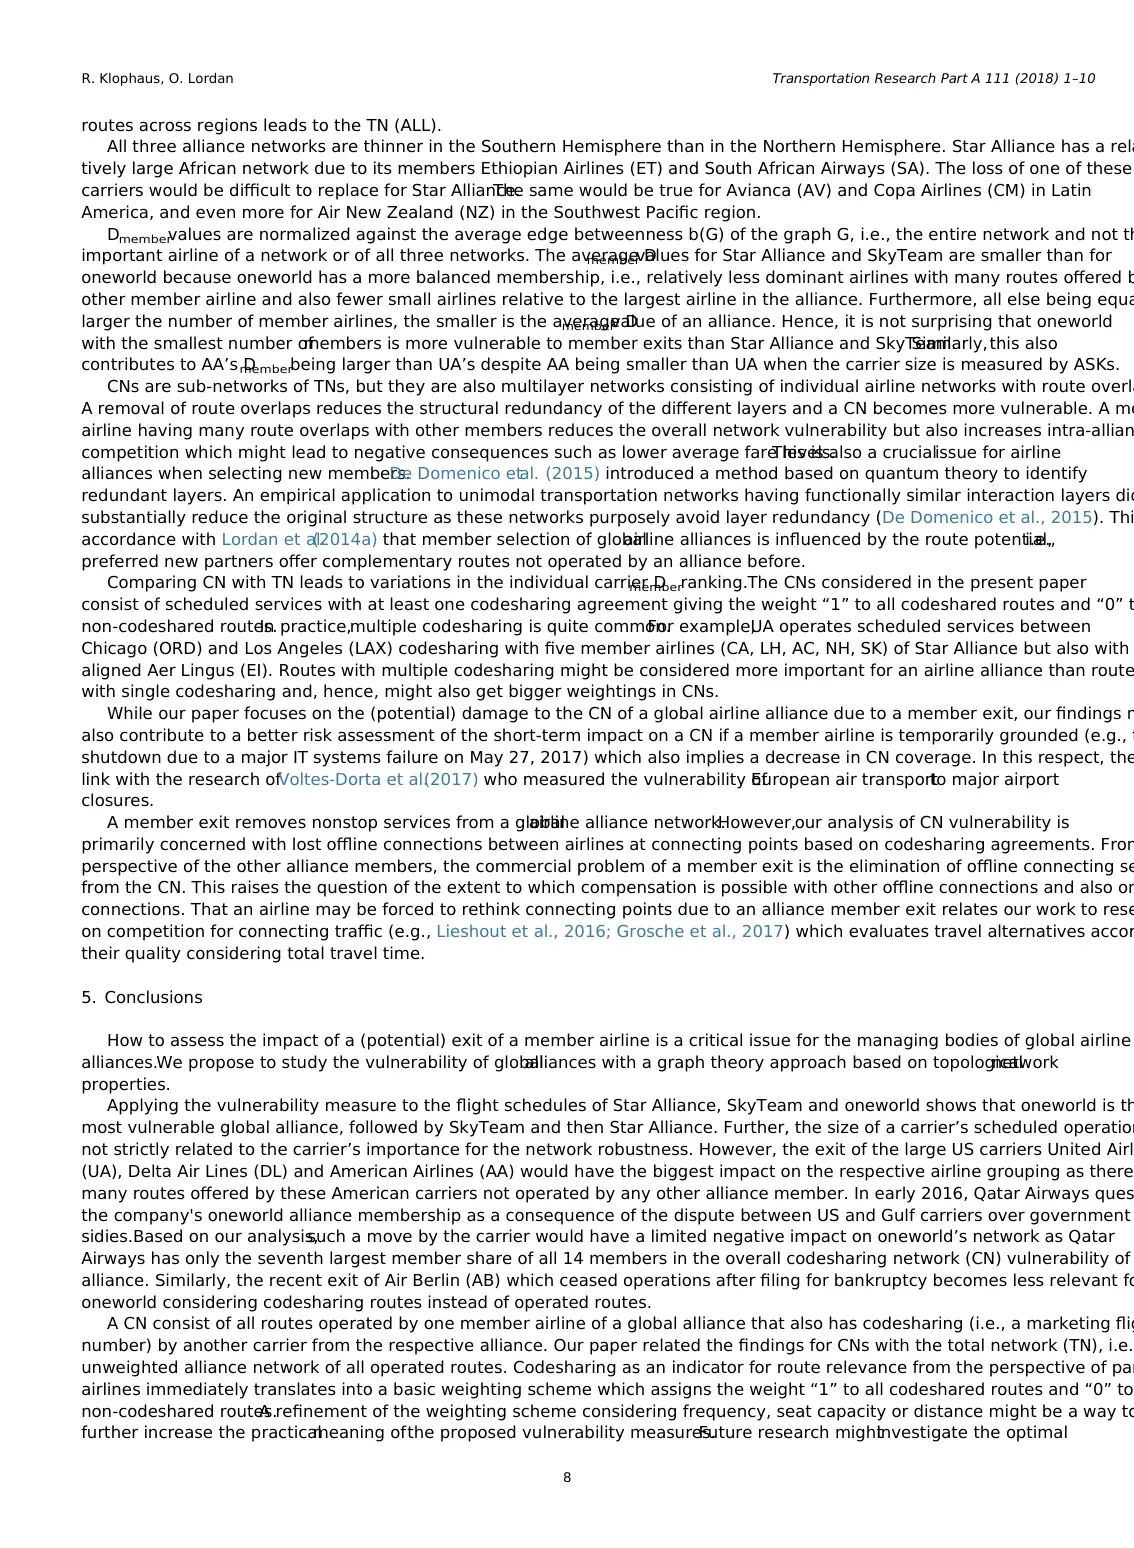
routes across regions leads to the TN (ALL).
All three alliance networks are thinner in the Southern Hemisphere than in the Northern Hemisphere. Star Alliance has a rela
tively large African network due to its members Ethiopian Airlines (ET) and South African Airways (SA). The loss of one of these
carriers would be difficult to replace for Star Alliance.The same would be true for Avianca (AV) and Copa Airlines (CM) in Latin
America, and even more for Air New Zealand (NZ) in the Southwest Pacific region.
Dmembervalues are normalized against the average edge betweenness b(G) of the graph G, i.e., the entire network and not th
important airline of a network or of all three networks. The average Dmembervalues for Star Alliance and SkyTeam are smaller than for
oneworld because oneworld has a more balanced membership, i.e., relatively less dominant airlines with many routes offered b
other member airline and also fewer small airlines relative to the largest airline in the alliance. Furthermore, all else being equa
larger the number of member airlines, the smaller is the average Dmembervalue of an alliance. Hence, it is not surprising that oneworld
with the smallest number ofmembers is more vulnerable to member exits than Star Alliance and SkyTeam.Similarly,this also
contributes to AA’s Dmemberbeing larger than UA’s despite AA being smaller than UA when the carrier size is measured by ASKs.
CNs are sub-networks of TNs, but they are also multilayer networks consisting of individual airline networks with route overla
A removal of route overlaps reduces the structural redundancy of the different layers and a CN becomes more vulnerable. A me
airline having many route overlaps with other members reduces the overall network vulnerability but also increases intra-allian
competition which might lead to negative consequences such as lower average fare levels.This is also a crucialissue for airline
alliances when selecting new members.De Domenico etal. (2015) introduced a method based on quantum theory to identify
redundant layers. An empirical application to unimodal transportation networks having functionally similar interaction layers did
substantially reduce the original structure as these networks purposely avoid layer redundancy (De Domenico et al., 2015). Thi
accordance with Lordan et al.(2014a) that member selection of globalairline alliances is influenced by the route potential,i.e.,
preferred new partners offer complementary routes not operated by an alliance before.
Comparing CN with TN leads to variations in the individual carrier Dmemberranking.The CNs considered in the present paper
consist of scheduled services with at least one codesharing agreement giving the weight “1” to all codeshared routes and “0” t
non-codeshared routes.In practice,multiple codesharing is quite common.For example,UA operates scheduled services between
Chicago (ORD) and Los Angeles (LAX) codesharing with five member airlines (CA, LH, AC, NH, SK) of Star Alliance but also with
aligned Aer Lingus (EI). Routes with multiple codesharing might be considered more important for an airline alliance than route
with single codesharing and, hence, might also get bigger weightings in CNs.
While our paper focuses on the (potential) damage to the CN of a global airline alliance due to a member exit, our findings m
also contribute to a better risk assessment of the short-term impact on a CN if a member airline is temporarily grounded (e.g., t
shutdown due to a major IT systems failure on May 27, 2017) which also implies a decrease in CN coverage. In this respect, the
link with the research ofVoltes-Dorta et al.(2017) who measured the vulnerability ofEuropean air transportto major airport
closures.
A member exit removes nonstop services from a globalairline alliance network.However,our analysis of CN vulnerability is
primarily concerned with lost offline connections between airlines at connecting points based on codesharing agreements. From
perspective of the other alliance members, the commercial problem of a member exit is the elimination of offline connecting se
from the CN. This raises the question of the extent to which compensation is possible with other offline connections and also on
connections. That an airline may be forced to rethink connecting points due to an alliance member exit relates our work to rese
on competition for connecting traffic (e.g., Lieshout et al., 2016; Grosche et al., 2017) which evaluates travel alternatives accor
their quality considering total travel time.
5. Conclusions
How to assess the impact of a (potential) exit of a member airline is a critical issue for the managing bodies of global airline
alliances.We propose to study the vulnerability of globalalliances with a graph theory approach based on topologicalnetwork
properties.
Applying the vulnerability measure to the flight schedules of Star Alliance, SkyTeam and oneworld shows that oneworld is th
most vulnerable global alliance, followed by SkyTeam and then Star Alliance. Further, the size of a carrier’s scheduled operation
not strictly related to the carrier’s importance for the network robustness. However, the exit of the large US carriers United Airli
(UA), Delta Air Lines (DL) and American Airlines (AA) would have the biggest impact on the respective airline grouping as there
many routes offered by these American carriers not operated by any other alliance member. In early 2016, Qatar Airways ques
the company's oneworld alliance membership as a consequence of the dispute between US and Gulf carriers over government
sidies.Based on our analysis,such a move by the carrier would have a limited negative impact on oneworld’s network as Qatar
Airways has only the seventh largest member share of all 14 members in the overall codesharing network (CN) vulnerability of
alliance. Similarly, the recent exit of Air Berlin (AB) which ceased operations after filing for bankruptcy becomes less relevant fo
oneworld considering codesharing routes instead of operated routes.
A CN consist of all routes operated by one member airline of a global alliance that also has codesharing (i.e., a marketing flig
number) by another carrier from the respective alliance. Our paper related the findings for CNs with the total network (TN), i.e.,
unweighted alliance network of all operated routes. Codesharing as an indicator for route relevance from the perspective of par
airlines immediately translates into a basic weighting scheme which assigns the weight “1” to all codeshared routes and “0” to
non-codeshared routes.A refinement of the weighting scheme considering frequency, seat capacity or distance might be a way to
further increase the practicalmeaning ofthe proposed vulnerability measures.Future research mightinvestigate the optimal
R. Klophaus, O. Lordan Transportation Research Part A 111 (2018) 1–10
8
robustness of an airline alliance route network, i.e., the trade-off between network vulnerability and overlapping networks, whic
should be of interest to airline managers. Similarly, it might be valuable to combine the proposed vulnerability analysis of airlin
alliance networks in a more comprehensive approach with related concepts such as hubness. The vulnerability analysis might a
expanded to consider connecting flights in addition to nonstop flights which requires a methodology for connection building wit
parameters such as minimum or maximum connecting times. A related problem to measuring vulnerability is how to build a rob
network with appropriate partner selection.This paper did not measure a new member’s contribution to network robustness.In
practical terms, optimization of alliance composition should be assessed with available candidates.
Appendix A. Alliances and member airlines
Star Alliance SkyTeam oneworld
A3 Aegean Airlines AF Air France AA American Airlines
AC Air Canada AM Aeromexico AB Air Berlin
AI Air India AR Aerolineas Argentinas AY Finnair
AV Avianca AZ Alitalia BA British Airways
BR EVA Airways CI China Airlines CX Cathay Pacific Airways
CA Air China CZ China Southern Airlines IB Iberia
CM Copa Airlines DL Delta Air Lines JL Japan Airlines
ET Ethiopian Airlines GA Garuda Indonesia LA LATAM Airlines
JP Adria Airways KE Korean Air MH Malaysia Airlines
LH Lufthansa German Airlines KL KLM-Royal Dutch Airlines QF Qantas Airways
LO LOT - Polish Airlines KQ Kenya Airways QR Qatar Airways
LX Swiss ME Middle East Airlines RJ Royal Jordanian
MS Egyptair MF Xiamen Airlines Company S7 S7 Airlines
NH All Nippon Airways MU China Eastern Airlines UL Srilankan Airlines
NZ Air New Zealand OK Czech Airlines
O6 Avianca Brazil RO Tarom
OS Austrian Airlines SU Aeroflot Russian Airlines
OU Croatia Airlines SV Saudi Arabian Airlines
OZ Asiana Airlines UX Air Europa
SA South African Airways VN Vietnam Airlines
SK SAS Scandinavian Airlines
SN Brussels Airlines
SQ Singapore Airlines
TG Thai Airways International
TK Turkish Airlines
TP TAP Portugal
UA United Airlines
ZH Shenzhen Airlines
References
Adler, N., Hanany, E., 2016. Regulating inter-firm agreements: the case of airline codesharing in parallel networks. Transp. Res. Part B: Methodol. 84, 31–54.
Bagler, G., 2008. Analysis of the airport network of India as a complex weighted network. Phys. A: Statist. Mech. Appl. 387, 2972–2980.
Boccaletti, S., Buldu, J., Criado, R., Flores, J., Latora, V., Pello, J., Romance, M., 2007. Multiscale vulnerability of complex networks. Chaos (Woodbury, N.Y.) 17,
043110. URL: < http://www.ncbi.nlm.nih.gov/pubmed/18163774 > , http://doi.org/10.1063/1.2801687.
Brueckner, J.K., 2001. The economics of international codesharing: an analysis of airline alliances. Int. J. Ind. Organiz. 19, 1475–1498.
Brueckner, J.K., Lee, D.N., Singer, E.S., 2011. Alliances, codesharing, antitrust immunity, and international airfares: do previous patterns persist? J. Competit.
Econom. 7, 573–602.
Chi, L.P., Cai, X., 2004. Structural changes caused by error and attack tolerance in US airport network. Int. J. Mod. Phys. B 18, 2394–2400.
Douglas, I., Tan, D., 2017. Global airline alliances and profitability: a difference-in-difference analysis. Transport. Res. Part A: Policy Pract. http://dx.doi.org/10.
j.tra.2017.05.024. (in press).
Du, W.-B., Zhou, X.-L., Lordan, O., Wang, Z., Zhao,, C., Zhu, Y.-B., 2016. Analysis of the Chinese airline network as multi-layer networks. Transp. Res. Part E: L
Transp. Rev. 89, 108–116.
De Domenico, M., Nicosia, V., Arenas, A., Latora, V., 2015. Structural reducibility of multilayer networks. Nat. Commun. 6, 6864. http://dx.doi.org/10.1038/
ncomms7864.
Dunn, S., Wilkinson, S.M., 2015. Increasing the resilience of air traffic networks using a network graph theory approach. Transport Res. Part E: Logist. Transpo
90, 39–50.
Estrada, E., 2011. The Structure of Complex Networks: Theory and Applications. Oxford University Press.
Estrada, E., Knight, P., 2015. A First Course in Network Theory, Oxford University Press.
Garg, C.P., 2016. A robust hybrid decision model for evaluation and selection of the strategic alliance partner in the airline industry. J. Air Transp. Manage. 52
Grosche, T., Klophaus, R., Seredyński, A., 2017. Competition for long-haul connecting traffic among airports in Europe and the Middle East. J. Air Transp. Mana
3–14.
R. Klophaus, O. Lordan Transportation Research Part A 111 (2018) 1–10
9
⊘ This is a preview!⊘
Do you want full access?
Subscribe today to unlock all pages.
Trusted by 1+ million students worldwide
Guimerà, R., Amaral, L.A.N., 2004. Modeling the world-wide airport network. Eur. Phys. J. B - Condensed Matter 38 (2), 381–385.
Guimerà, R., Mossa, S., Turtschi, A., Amaral, L.A.N., 2005. The worldwide air transportation network: Anomalous centrality, community structure, and cities’ g
roles. Proc. National Acad. Sci. United States of America 102 (22), 7794–7799.
Hassin, O., Shy, O., 2004. Codesharing agreements and interconnections in markets for international flights. Rev. Int. Econom. 12, 337–352.
Kleymann, B., Seristö, H., 2001. Levels of airline alliance membership: balancing risks and benefits. J. Air Transp. Manage. 7, 303–310.
Mattsson, L.-G., Jenelius, E., 2015. Vulnerability and resilience of transport systems – a discussion of recent research. Transp. Res. Part A: Policy and Practice
16–34.
Mishkovski, I., Biey, M., Kocarev, L., 2011. Vulnerability of complex networks. Commun. Nonlinear Sci. Numer. Simul. 16 (1), 341–349.
Lieshout, R., Malighetti, P., Redondi, R., Burghouwt, G., 2016. The competitive landscape of air transport in Europe. J. Transp. Geogr. 50, 68–82.
Lordan, O., Sallan, J.M., Simo, P., 2014a. Study of the topology and robustness of airline route networks from the complex network approach: a survey and res
agenda. J. Transp. Geogr. 37, 112–120.
Lordan, O., Sallan, J.M., Simo, P., Gonzalez-Prieto, D., 2014b. Robustness of the air transport network. Transp. Res. Part E: Logist. Transp. Rev. 68, 155–163. h
doi.org/10.1016/j.tre.2014.05.011.
Lordan, O., Sallan, J.M., Simo, P., Gonzalez-Prieto, D., 2015. Robustness of airline alliance route networks. Commun. Nonlinear Sci. Numer. Simulat. 22 (1–3),
587–595.
Oum, T.-H., Park, J.-H., Zhang, A., 1996. The effects of airline codesharing agreements on firm conduct and international air fares. J. Transp. Econom. Policy 30
187–202.
Park, J.-H., 1997. The effects of airline alliances on markets and economic welfare. Transp. Res. Part E: Logist. Transp. Rev. 33, 181–195.
Park, J.-H., Zhang, A., 1998. Airline alliances and partner firms’outputs. Transp. Res. Part E: Logist. Transp. Rev. 34, 245–255.
Roucolle, C., Urdanoz, M., Seregina, T., 2017. Measuring Airline Networks. In: Proceedings of the 21th ATRS World Conference, Antwerp, Belgium, 5–8 July 201
1–31.
Sroka, W., Hittmár, S., 2013. Management of an Alliance Network at the Post-operational Stage. In: Management of Alliance Networks. SpringerBriefs in Busin
2013.
Voltes-Dorta, A., Rodríguez-Déniz, H., Suau-Sanchez, P., 2017. Vulnerability of the European air transport network to major airport closures from the perspect
passenger delays: ranking the most critical airports. Transp. Res. Part A: Policy and Practice 96, 119–145.
Zhang, J., Cao, X.-B., Du, W., Cai, K.-Q., 2010. Evolution of Chinese airport network. Phys. A: Statist. Mech. Its Appl. 389 (18), 3922–3931.
Zou, L., Oum, T.H., Yu, C., 2011. Assessing the price effects of airline alliances on complementary routes. Transp. Res. Part E: Logist. Transp. Rev. 47, 315–33
R. Klophaus, O. Lordan Transportation Research Part A 111 (2018) 1–10
10
1 out of 10
Your All-in-One AI-Powered Toolkit for Academic Success.
+13062052269
info@desklib.com
Available 24*7 on WhatsApp / Email
![[object Object]](/_next/static/media/star-bottom.7253800d.svg)
Unlock your academic potential
Copyright © 2020–2026 A2Z Services. All Rights Reserved. Developed and managed by ZUCOL.