The Impact of PJ's Coffee Ads on Starbucks Purchase Habits
VerifiedAdded on 2022/08/12
|13
|2586
|11
Report
AI Summary
This report presents a qualitative study investigating the impact of advertisements for PJ's Coffee of New Orleans on the purchasing habits of Starbucks customers. The research employed a correlational and descriptive design, surveying 20 participants after they viewed a short advertisement. The study examined variables such as age, gender, and coffee preference. Findings revealed that age and gender could predict the likelihood of purchasing PJ's Coffee, with the logistics regression analysis indicating that male participants were more likely to be influenced. The report includes descriptive statistics, a logistics regression analysis, and a discussion of the study's limitations and implications. The study suggests that other coffee providers can leverage short video advertisements to effectively compete with Starbucks, offering valuable insights into consumer behavior and marketing strategies. The report is a student contribution available on Desklib, a platform providing AI-based study tools.

Running head: PJ’S COFFEE OF NEW ORLEANS AND STARBUCK COFFEE
1
Group Name:
Group Members:
Effects of Advertisement of PJ’s Coffee of New Orleans on the Purchase of Starbuck Coffee
1
Group Name:
Group Members:
Effects of Advertisement of PJ’s Coffee of New Orleans on the Purchase of Starbuck Coffee
Paraphrase This Document
Need a fresh take? Get an instant paraphrase of this document with our AI Paraphraser
PJ’S COFFEE OF NEW ORLEANS AND STARBUCK COFFEE
2
Abstract
The objective of this study was to investigate whether there is a significant change in
purchasing habits of Starbucks coffee after the advertisement for a new brand of coffee. The
study was qualitative research that took the form of correlational and descriptive study designs.
The study revealed that the likelihood of an effect on the purchasing patterns of Starbucks can be
investigated using the male gender. Similarly, the logistics regression analysis revealed that the
likelihood of purchasing PJ’s Coffee of New Orleans can be predicted using the age and gender
of the participants. From the overall findings, we can say that the other coffee providers can take
advantage of advertising their coffee though short videos in order to effectively compete with
Starbucks.
PJ’S COFFEE OF NEW ORLEANS AND STARBUCK COFFEE
3
Introduction
In the working environment, it has been observed that most people opt to get Starbucks
almost every day as a part of their daily routine. Although, there are other coffee shops,
Starbucks, despite it being costly, is one of the most visited by Americans. According to statistics
from Business Insider, Starbucks stores have an average of just over 750 customers a day in
2020 (Lutz, 2013). According to an article written by Goodwin, the prices of Starbucks drinks in
the U.S. average to about $ 2.75. Even if the prices are quite high for a cup of coffee, the
business is not projected to fall since the brand just keeps expanding and its popularity. Even
with its expense, the researchers believe that there are still people who prefer getting Starbucks
instead of cheaper alternatives that are not as prominent.
In our qualitative experiment, we are going to play an advertisement on YouTube of a
smaller coffee chain, PJ’s Coffee of New Orleans. In the said advertisement, we will show that
PJ’s Coffee is a great tasting like Starbucks but cheaper Stilger, M. (2018, September 12). We
had 20 random subjects of an adult from ages 18 and up. We will be asking each subject to
watch the advertisement and ask them if they are willing to drive to PJ’s coffee to get a drink or
if they will continue to buy their coffee from Starbucks. This research would benefit the
community by recognizing and promoting the presence of alternative coffee places. This
experiment wishes to find out if people are willing to switch Starbucks with any other coffee
shop.
Method
We started this study with the intention of attempting to see who would be willing to
change their coffee routine after seeing a certain advertisement for it. We thought that half of the
subjects surveyed would stay the course and continue to buy Starbucks and the other half would
⊘ This is a preview!⊘
Do you want full access?
Subscribe today to unlock all pages.
Trusted by 1+ million students worldwide
PJ’S COFFEE OF NEW ORLEANS AND STARBUCK COFFEE
4
at least try PJ’s coffee one time. We split up the survey locations and asked a random 10 adults
from walking around HEB and a random 10 adults from Wal-Mart. Most everyone approached
were willing to participate in the survey happily and a couple was coaxed by their family
members to participate.
We decided on showing people an advertisement for a coffee shop other than Starbucks
and seeing if people would break their routine of going to Starbucks for their coffee or keep it.
Our variables include age, gender and a likeness for coffee. The main objective of the study was
to investigate whether there is a significant change in purchasing habits of Starbucks coffee after
the advertisement for a new brand of coffee.
This is a qualitative experiment because we are trying to see if we can influence the
subjects to choose PJ’s Coffee of New Orleans over another coffee café. The survey questions
included “What is your age and gender and do you like coffee?” “Would you be willing to watch
a 57-second coffee advertisement video?” and “After having watched the video, will you buy
coffee from PJ’s Coffee of New Orleans? We used a random design of sampling 20 different
adults and asking them to watch the short 57-second advertisement video (Mitch, 2018).
The following hypothesis was tasted
H0: The likelihood of purchasing PJ’s Coffee of New Orleans cannot be predicted using
the age and gender of the participants.
H1: The likelihood of purchasing PJ’s Coffee of New Orleans can be predicted using the
age and gender of the participants.
Paraphrase This Document
Need a fresh take? Get an instant paraphrase of this document with our AI Paraphraser
PJ’S COFFEE OF NEW ORLEANS AND STARBUCK COFFEE
5
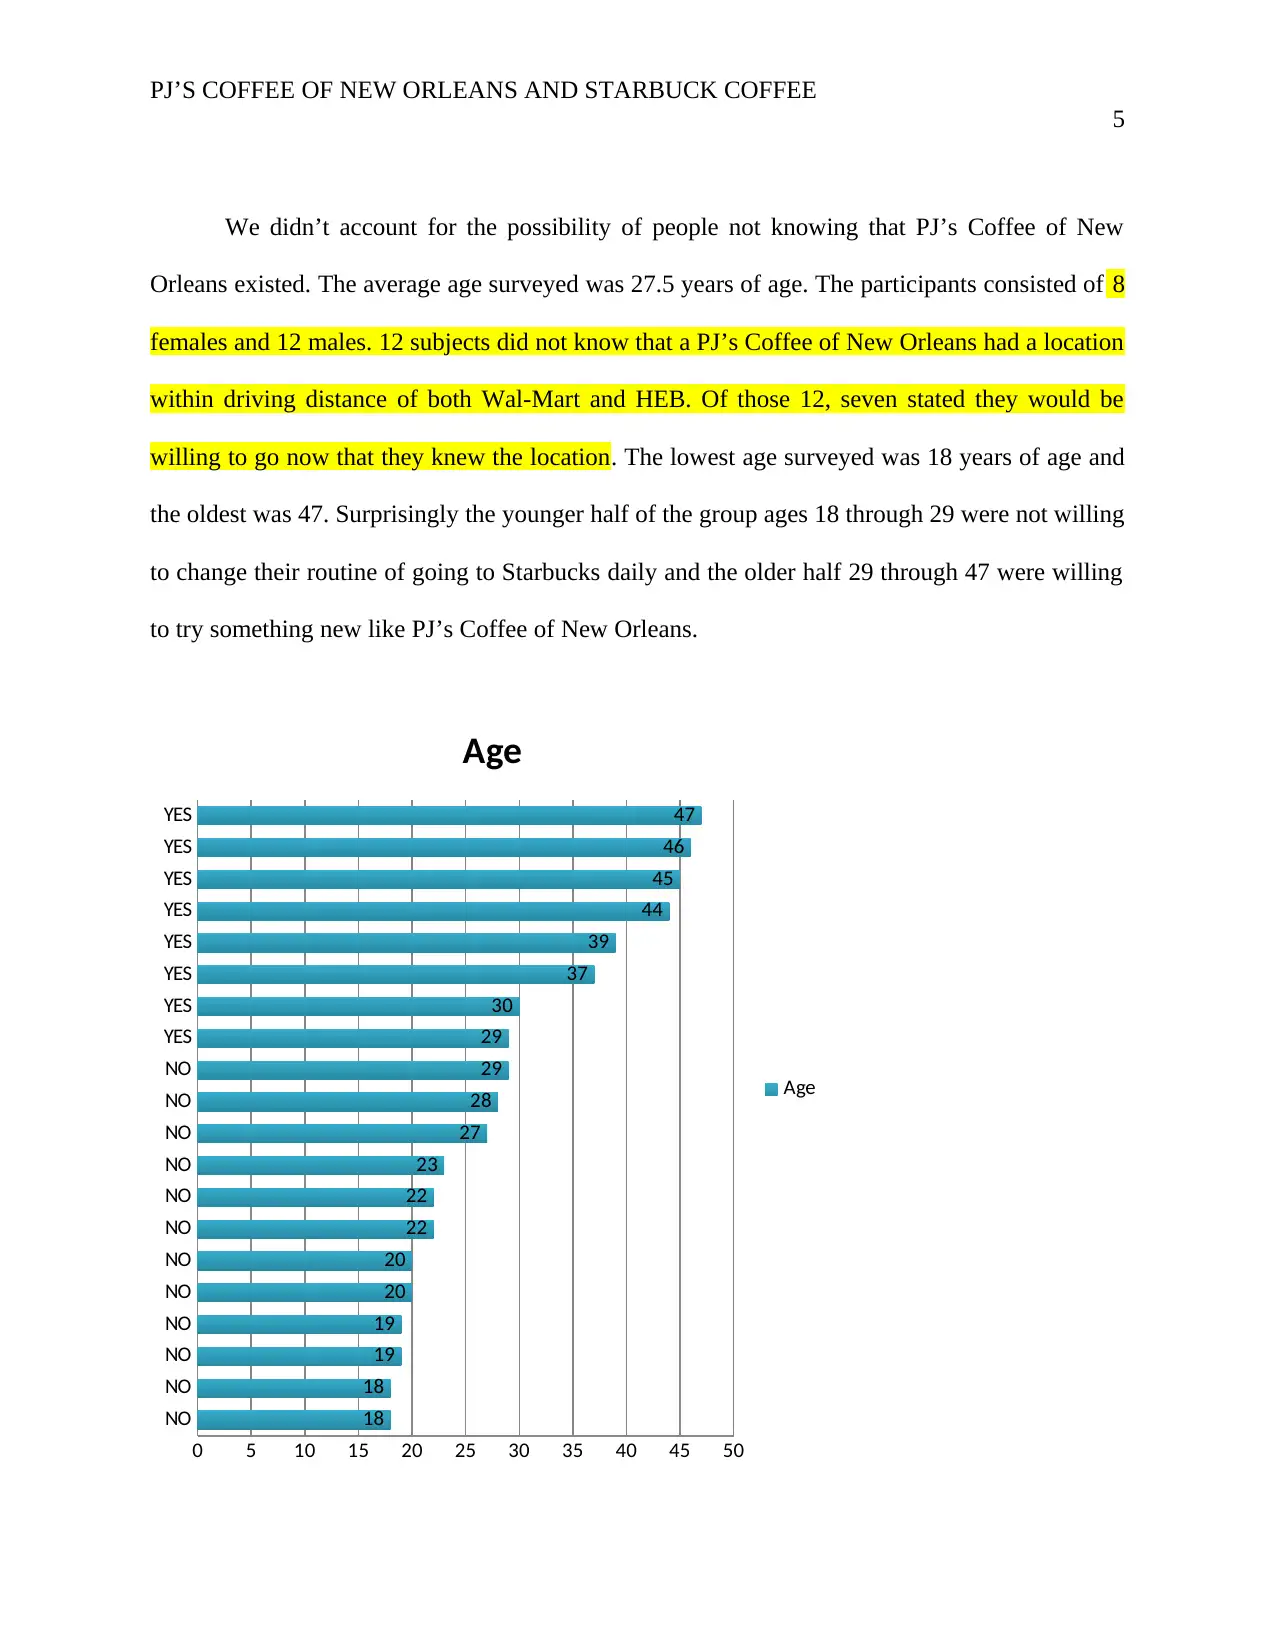
We didn’t account for the possibility of people not knowing that PJ’s Coffee of New
Orleans existed. The average age surveyed was 27.5 years of age. The participants consisted of 8
females and 12 males. 12 subjects did not know that a PJ’s Coffee of New Orleans had a location
within driving distance of both Wal-Mart and HEB. Of those 12, seven stated they would be
willing to go now that they knew the location. The lowest age surveyed was 18 years of age and
the oldest was 47. Surprisingly the younger half of the group ages 18 through 29 were not willing
to change their routine of going to Starbucks daily and the older half 29 through 47 were willing
to try something new like PJ’s Coffee of New Orleans.
NO
NO
NO
NO
NO
NO
NO
NO
NO
NO
NO
NO
YES
YES
YES
YES
YES
YES
YES
YES
0 5 10 15 20 25 30 35 40 45 50
18
18
19
19
20
20
22
22
23
27
28
29
29
30
37
39
44
45
46
47
Age
Age
5
We didn’t account for the possibility of people not knowing that PJ’s Coffee of New
Orleans existed. The average age surveyed was 27.5 years of age. The participants consisted of 8
females and 12 males. 12 subjects did not know that a PJ’s Coffee of New Orleans had a location
within driving distance of both Wal-Mart and HEB. Of those 12, seven stated they would be
willing to go now that they knew the location. The lowest age surveyed was 18 years of age and
the oldest was 47. Surprisingly the younger half of the group ages 18 through 29 were not willing
to change their routine of going to Starbucks daily and the older half 29 through 47 were willing
to try something new like PJ’s Coffee of New Orleans.
NO
NO
NO
NO
NO
NO
NO
NO
NO
NO
NO
NO
YES
YES
YES
YES
YES
YES
YES
YES
0 5 10 15 20 25 30 35 40 45 50
18
18
19
19
20
20
22
22
23
27
28
29
29
30
37
39
44
45
46
47
Age
Age
PJ’S COFFEE OF NEW ORLEANS AND STARBUCK COFFEE
6
Findings
Descriptive statistics analysis
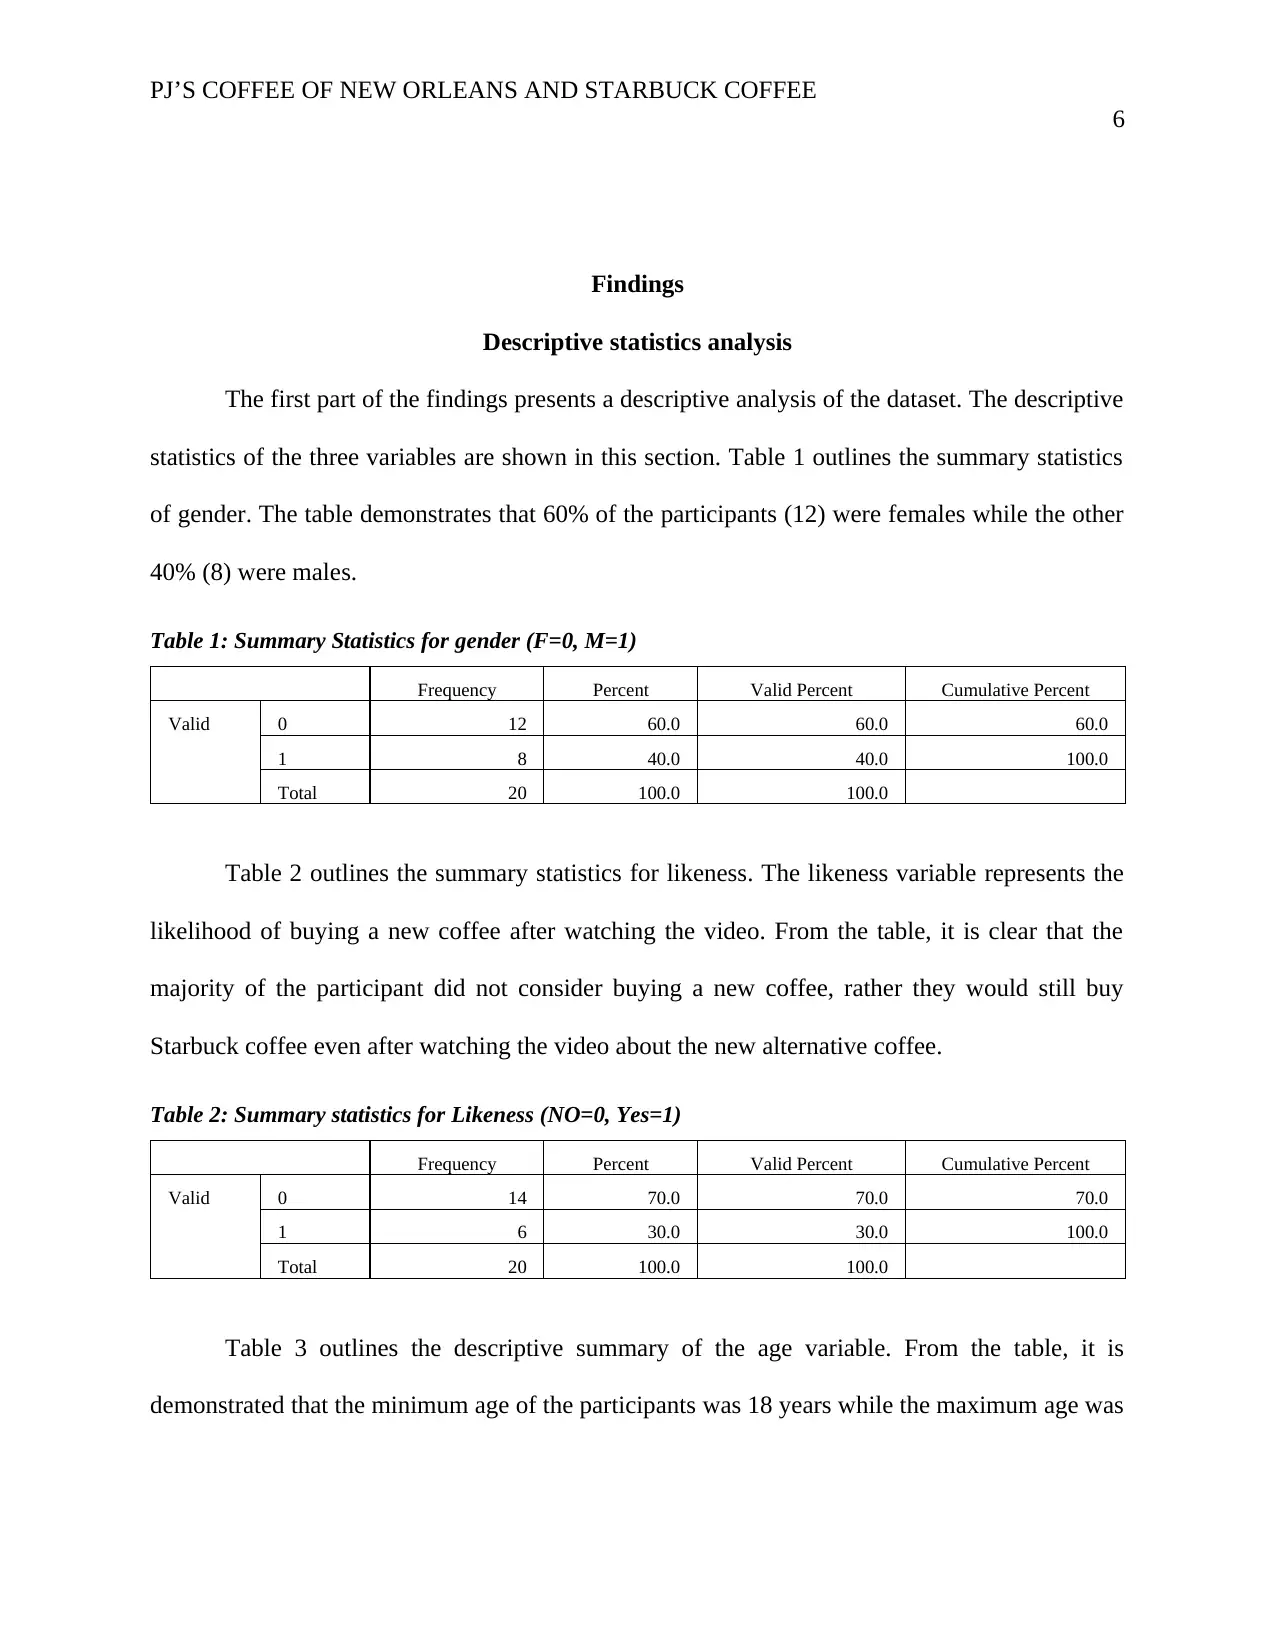
The first part of the findings presents a descriptive analysis of the dataset. The descriptive
statistics of the three variables are shown in this section. Table 1 outlines the summary statistics
of gender. The table demonstrates that 60% of the participants (12) were females while the other
40% (8) were males.
Table 1: Summary Statistics for gender (F=0, M=1)
Frequency Percent Valid Percent Cumulative Percent
Valid 0 12 60.0 60.0 60.0
1 8 40.0 40.0 100.0
Total 20 100.0 100.0
Table 2 outlines the summary statistics for likeness. The likeness variable represents the
likelihood of buying a new coffee after watching the video. From the table, it is clear that the
majority of the participant did not consider buying a new coffee, rather they would still buy
Starbuck coffee even after watching the video about the new alternative coffee.
Table 2: Summary statistics for Likeness (NO=0, Yes=1)
Frequency Percent Valid Percent Cumulative Percent
Valid 0 14 70.0 70.0 70.0
1 6 30.0 30.0 100.0
Total 20 100.0 100.0
Table 3 outlines the descriptive summary of the age variable. From the table, it is
demonstrated that the minimum age of the participants was 18 years while the maximum age was
6
Findings
Descriptive statistics analysis
The first part of the findings presents a descriptive analysis of the dataset. The descriptive
statistics of the three variables are shown in this section. Table 1 outlines the summary statistics
of gender. The table demonstrates that 60% of the participants (12) were females while the other
40% (8) were males.
Table 1: Summary Statistics for gender (F=0, M=1)
Frequency Percent Valid Percent Cumulative Percent
Valid 0 12 60.0 60.0 60.0
1 8 40.0 40.0 100.0
Total 20 100.0 100.0
Table 2 outlines the summary statistics for likeness. The likeness variable represents the
likelihood of buying a new coffee after watching the video. From the table, it is clear that the
majority of the participant did not consider buying a new coffee, rather they would still buy
Starbuck coffee even after watching the video about the new alternative coffee.
Table 2: Summary statistics for Likeness (NO=0, Yes=1)
Frequency Percent Valid Percent Cumulative Percent
Valid 0 14 70.0 70.0 70.0
1 6 30.0 30.0 100.0
Total 20 100.0 100.0
Table 3 outlines the descriptive summary of the age variable. From the table, it is
demonstrated that the minimum age of the participants was 18 years while the maximum age was
⊘ This is a preview!⊘
Do you want full access?
Subscribe today to unlock all pages.
Trusted by 1+ million students worldwide
PJ’S COFFEE OF NEW ORLEANS AND STARBUCK COFFEE
7
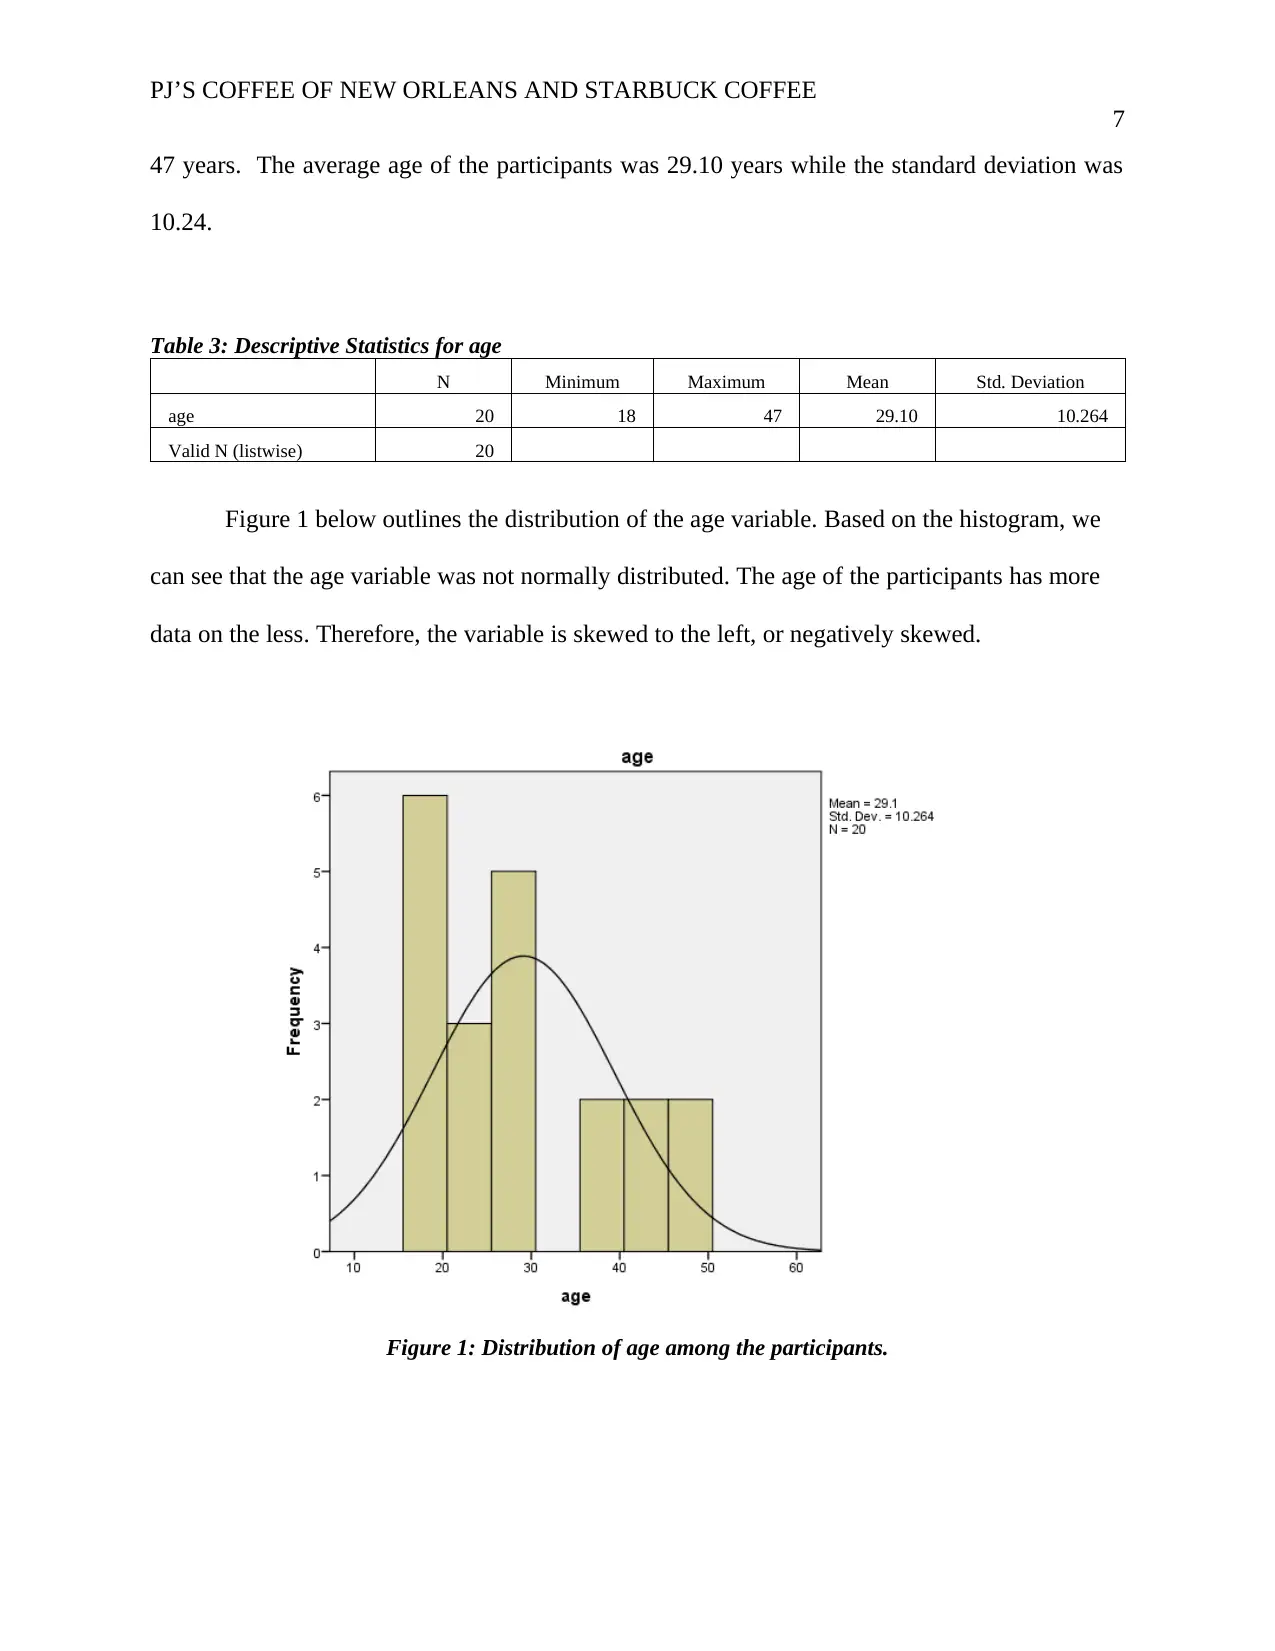
47 years. The average age of the participants was 29.10 years while the standard deviation was
10.24.
Table 3: Descriptive Statistics for age
N Minimum Maximum Mean Std. Deviation
age 20 18 47 29.10 10.264
Valid N (listwise) 20
Figure 1 below outlines the distribution of the age variable. Based on the histogram, we
can see that the age variable was not normally distributed. The age of the participants has more
data on the less. Therefore, the variable is skewed to the left, or negatively skewed.
Figure 1: Distribution of age among the participants.
7
47 years. The average age of the participants was 29.10 years while the standard deviation was
10.24.
Table 3: Descriptive Statistics for age
N Minimum Maximum Mean Std. Deviation
age 20 18 47 29.10 10.264
Valid N (listwise) 20
Figure 1 below outlines the distribution of the age variable. Based on the histogram, we
can see that the age variable was not normally distributed. The age of the participants has more
data on the less. Therefore, the variable is skewed to the left, or negatively skewed.
Figure 1: Distribution of age among the participants.
Paraphrase This Document
Need a fresh take? Get an instant paraphrase of this document with our AI Paraphraser
PJ’S COFFEE OF NEW ORLEANS AND STARBUCK COFFEE
8
Logistics Regression analysis: Predicting the likelihood of a person buying PJ’s Coffee of
New Orleans after watching the video.
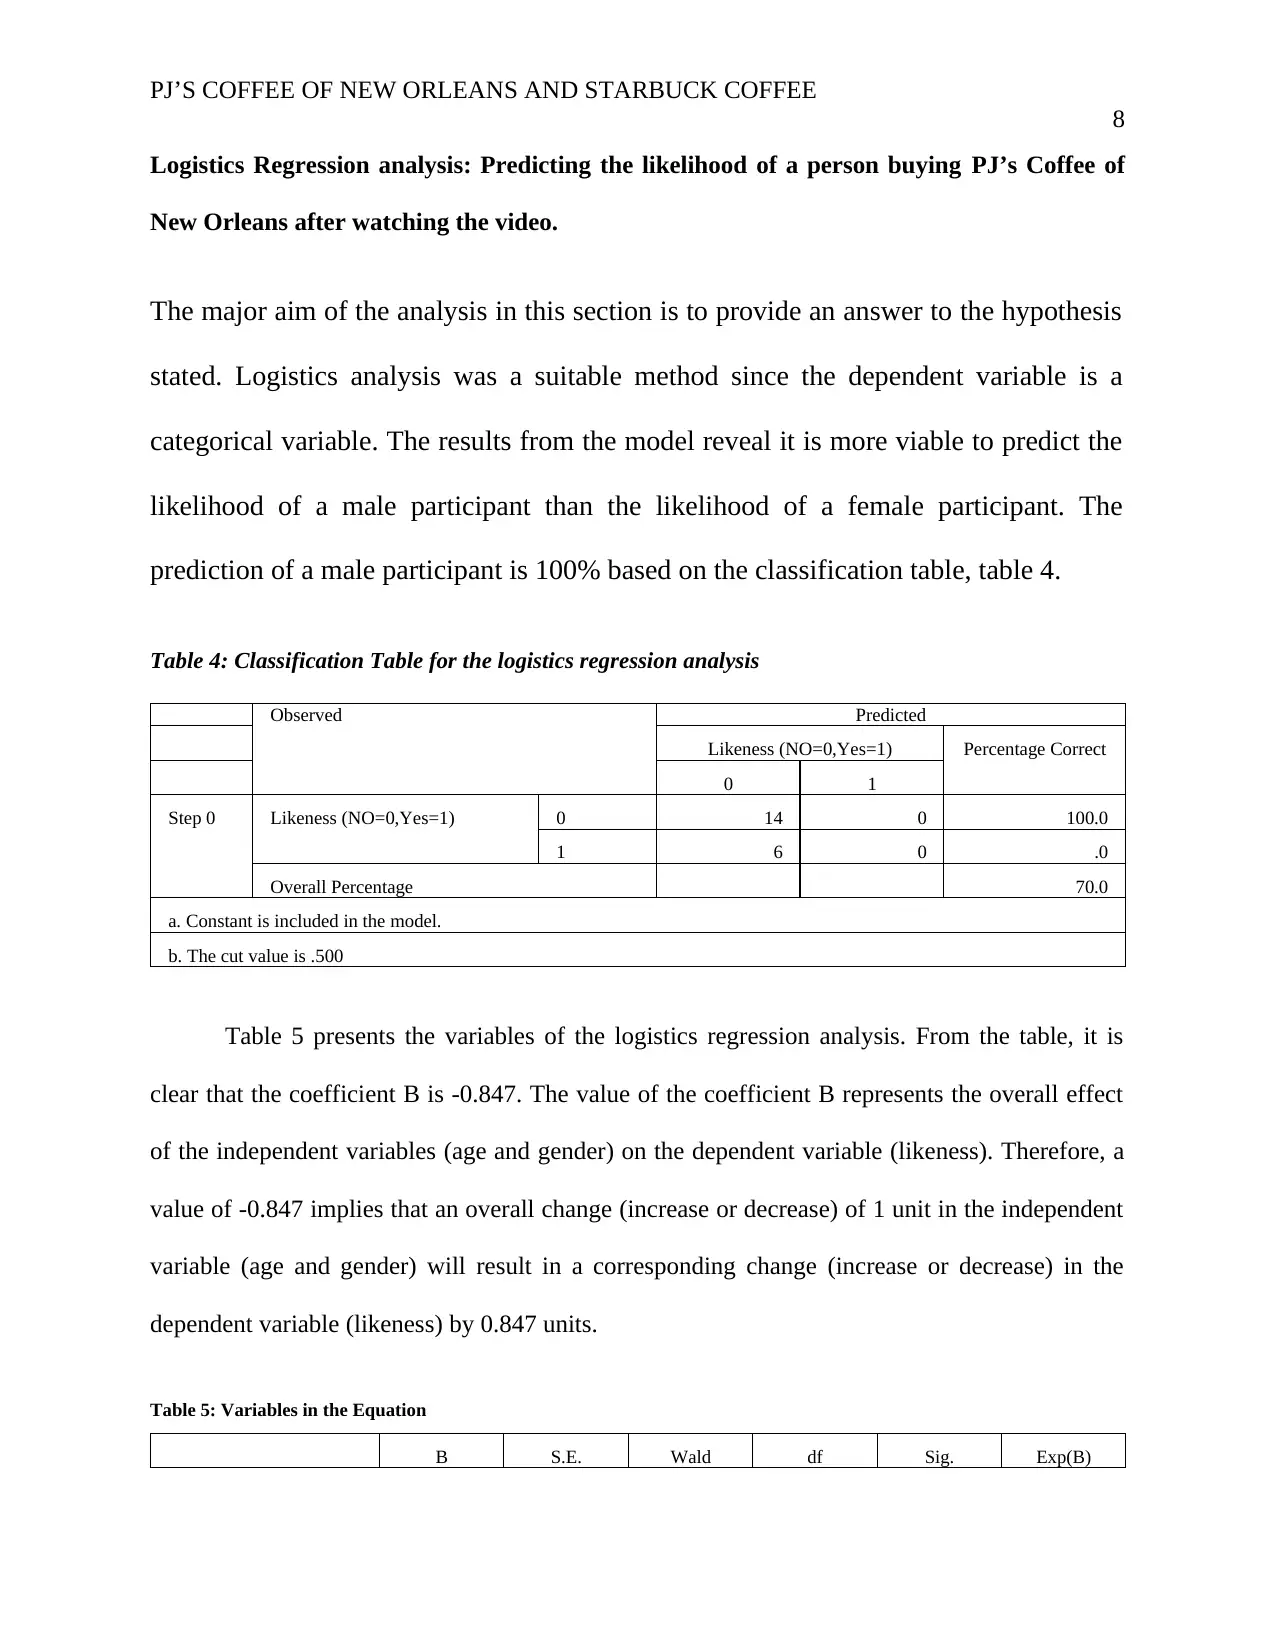
The major aim of the analysis in this section is to provide an answer to the hypothesis
stated. Logistics analysis was a suitable method since the dependent variable is a
categorical variable. The results from the model reveal it is more viable to predict the
likelihood of a male participant than the likelihood of a female participant. The
prediction of a male participant is 100% based on the classification table, table 4.
Table 4: Classification Table for the logistics regression analysis
Observed Predicted
Likeness (NO=0,Yes=1) Percentage Correct
0 1
Step 0 Likeness (NO=0,Yes=1) 0 14 0 100.0
1 6 0 .0
Overall Percentage 70.0
a. Constant is included in the model.
b. The cut value is .500
Table 5 presents the variables of the logistics regression analysis. From the table, it is
clear that the coefficient B is -0.847. The value of the coefficient B represents the overall effect
of the independent variables (age and gender) on the dependent variable (likeness). Therefore, a
value of -0.847 implies that an overall change (increase or decrease) of 1 unit in the independent
variable (age and gender) will result in a corresponding change (increase or decrease) in the
dependent variable (likeness) by 0.847 units.
Table 5: Variables in the Equation
B S.E. Wald df Sig. Exp(B)
8
Logistics Regression analysis: Predicting the likelihood of a person buying PJ’s Coffee of
New Orleans after watching the video.
The major aim of the analysis in this section is to provide an answer to the hypothesis
stated. Logistics analysis was a suitable method since the dependent variable is a
categorical variable. The results from the model reveal it is more viable to predict the
likelihood of a male participant than the likelihood of a female participant. The
prediction of a male participant is 100% based on the classification table, table 4.
Table 4: Classification Table for the logistics regression analysis
Observed Predicted
Likeness (NO=0,Yes=1) Percentage Correct
0 1
Step 0 Likeness (NO=0,Yes=1) 0 14 0 100.0
1 6 0 .0
Overall Percentage 70.0
a. Constant is included in the model.
b. The cut value is .500
Table 5 presents the variables of the logistics regression analysis. From the table, it is
clear that the coefficient B is -0.847. The value of the coefficient B represents the overall effect
of the independent variables (age and gender) on the dependent variable (likeness). Therefore, a
value of -0.847 implies that an overall change (increase or decrease) of 1 unit in the independent
variable (age and gender) will result in a corresponding change (increase or decrease) in the
dependent variable (likeness) by 0.847 units.
Table 5: Variables in the Equation
B S.E. Wald df Sig. Exp(B)
PJ’S COFFEE OF NEW ORLEANS AND STARBUCK COFFEE
9
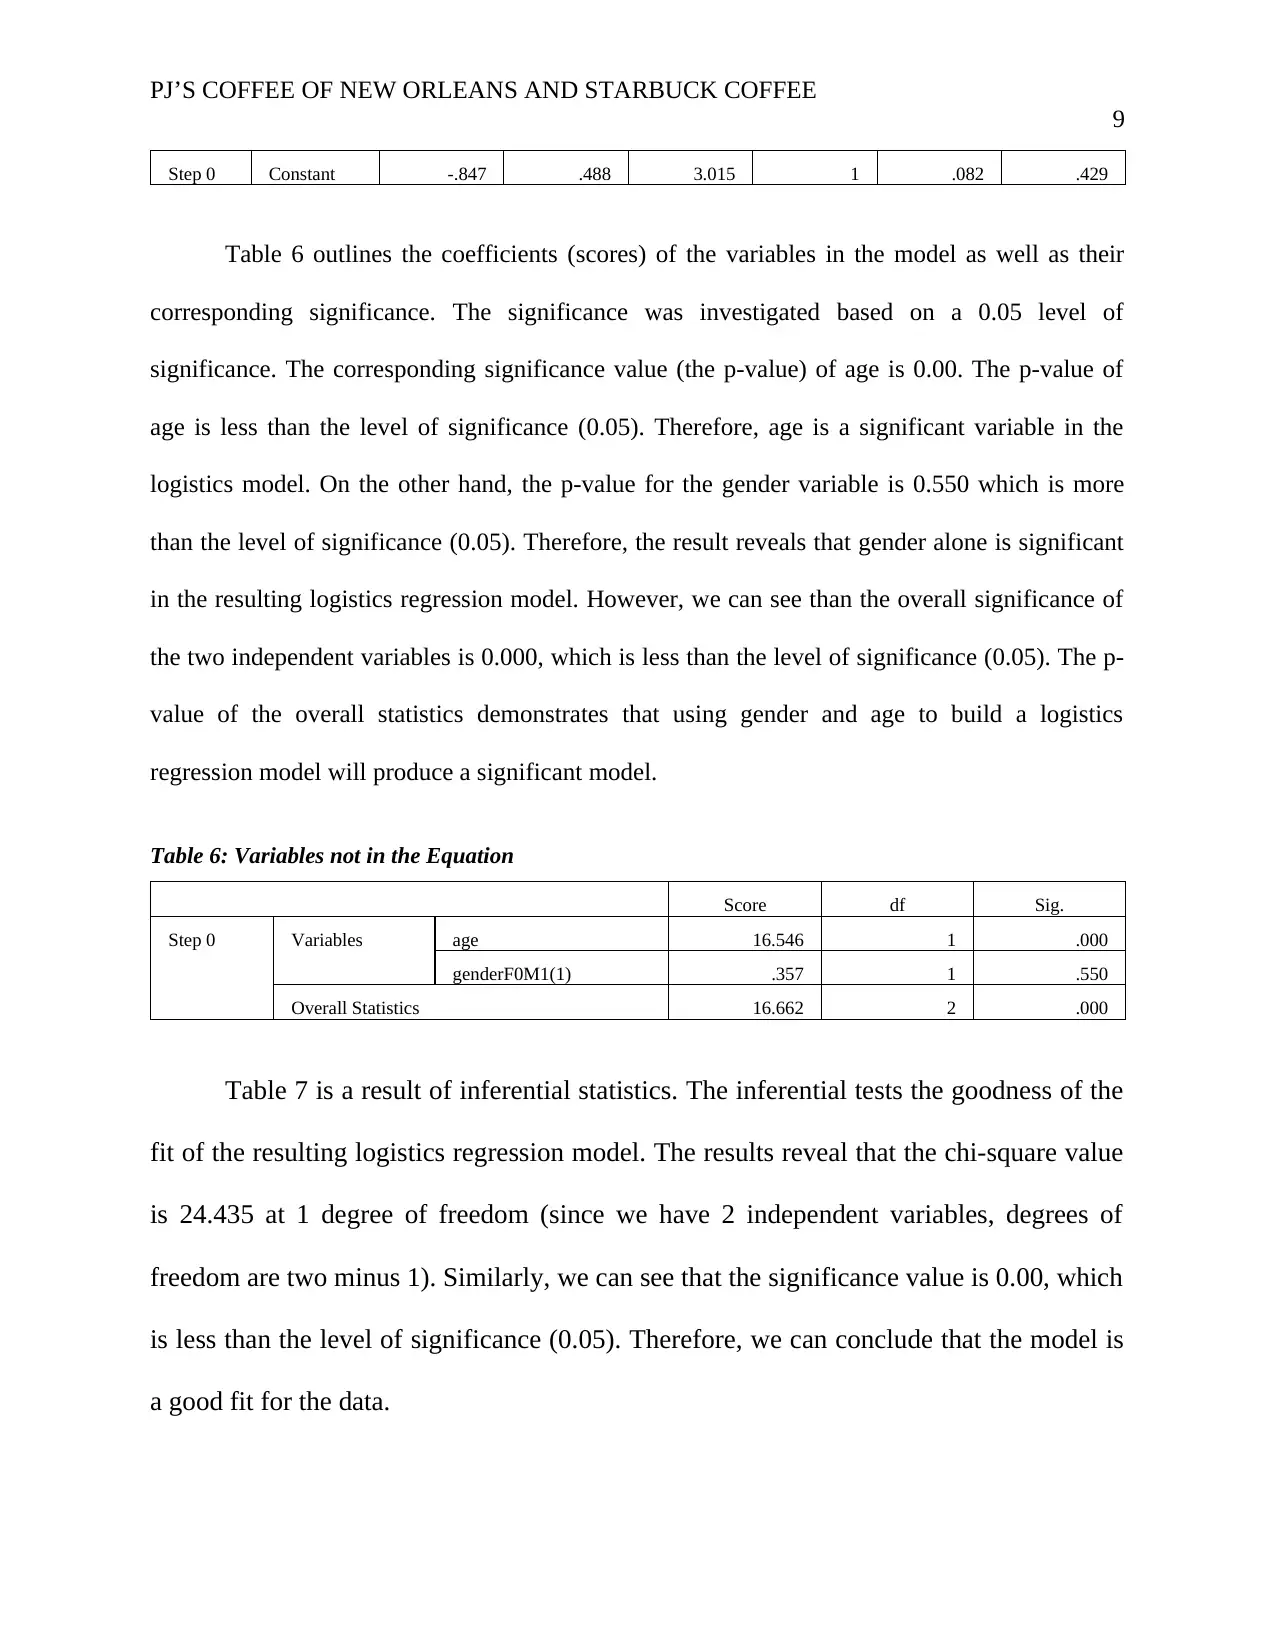
Step 0 Constant -.847 .488 3.015 1 .082 .429
Table 6 outlines the coefficients (scores) of the variables in the model as well as their
corresponding significance. The significance was investigated based on a 0.05 level of
significance. The corresponding significance value (the p-value) of age is 0.00. The p-value of
age is less than the level of significance (0.05). Therefore, age is a significant variable in the
logistics model. On the other hand, the p-value for the gender variable is 0.550 which is more
than the level of significance (0.05). Therefore, the result reveals that gender alone is significant
in the resulting logistics regression model. However, we can see than the overall significance of
the two independent variables is 0.000, which is less than the level of significance (0.05). The p-
value of the overall statistics demonstrates that using gender and age to build a logistics
regression model will produce a significant model.
Table 6: Variables not in the Equation
Score df Sig.
Step 0 Variables age 16.546 1 .000
genderF0M1(1) .357 1 .550
Overall Statistics 16.662 2 .000
Table 7 is a result of inferential statistics. The inferential tests the goodness of the
fit of the resulting logistics regression model. The results reveal that the chi-square value
is 24.435 at 1 degree of freedom (since we have 2 independent variables, degrees of
freedom are two minus 1). Similarly, we can see that the significance value is 0.00, which
is less than the level of significance (0.05). Therefore, we can conclude that the model is
a good fit for the data.
9
Step 0 Constant -.847 .488 3.015 1 .082 .429
Table 6 outlines the coefficients (scores) of the variables in the model as well as their
corresponding significance. The significance was investigated based on a 0.05 level of
significance. The corresponding significance value (the p-value) of age is 0.00. The p-value of
age is less than the level of significance (0.05). Therefore, age is a significant variable in the
logistics model. On the other hand, the p-value for the gender variable is 0.550 which is more
than the level of significance (0.05). Therefore, the result reveals that gender alone is significant
in the resulting logistics regression model. However, we can see than the overall significance of
the two independent variables is 0.000, which is less than the level of significance (0.05). The p-
value of the overall statistics demonstrates that using gender and age to build a logistics
regression model will produce a significant model.
Table 6: Variables not in the Equation
Score df Sig.
Step 0 Variables age 16.546 1 .000
genderF0M1(1) .357 1 .550
Overall Statistics 16.662 2 .000
Table 7 is a result of inferential statistics. The inferential tests the goodness of the
fit of the resulting logistics regression model. The results reveal that the chi-square value
is 24.435 at 1 degree of freedom (since we have 2 independent variables, degrees of
freedom are two minus 1). Similarly, we can see that the significance value is 0.00, which
is less than the level of significance (0.05). Therefore, we can conclude that the model is
a good fit for the data.
⊘ This is a preview!⊘
Do you want full access?
Subscribe today to unlock all pages.
Trusted by 1+ million students worldwide
PJ’S COFFEE OF NEW ORLEANS AND STARBUCK COFFEE
10
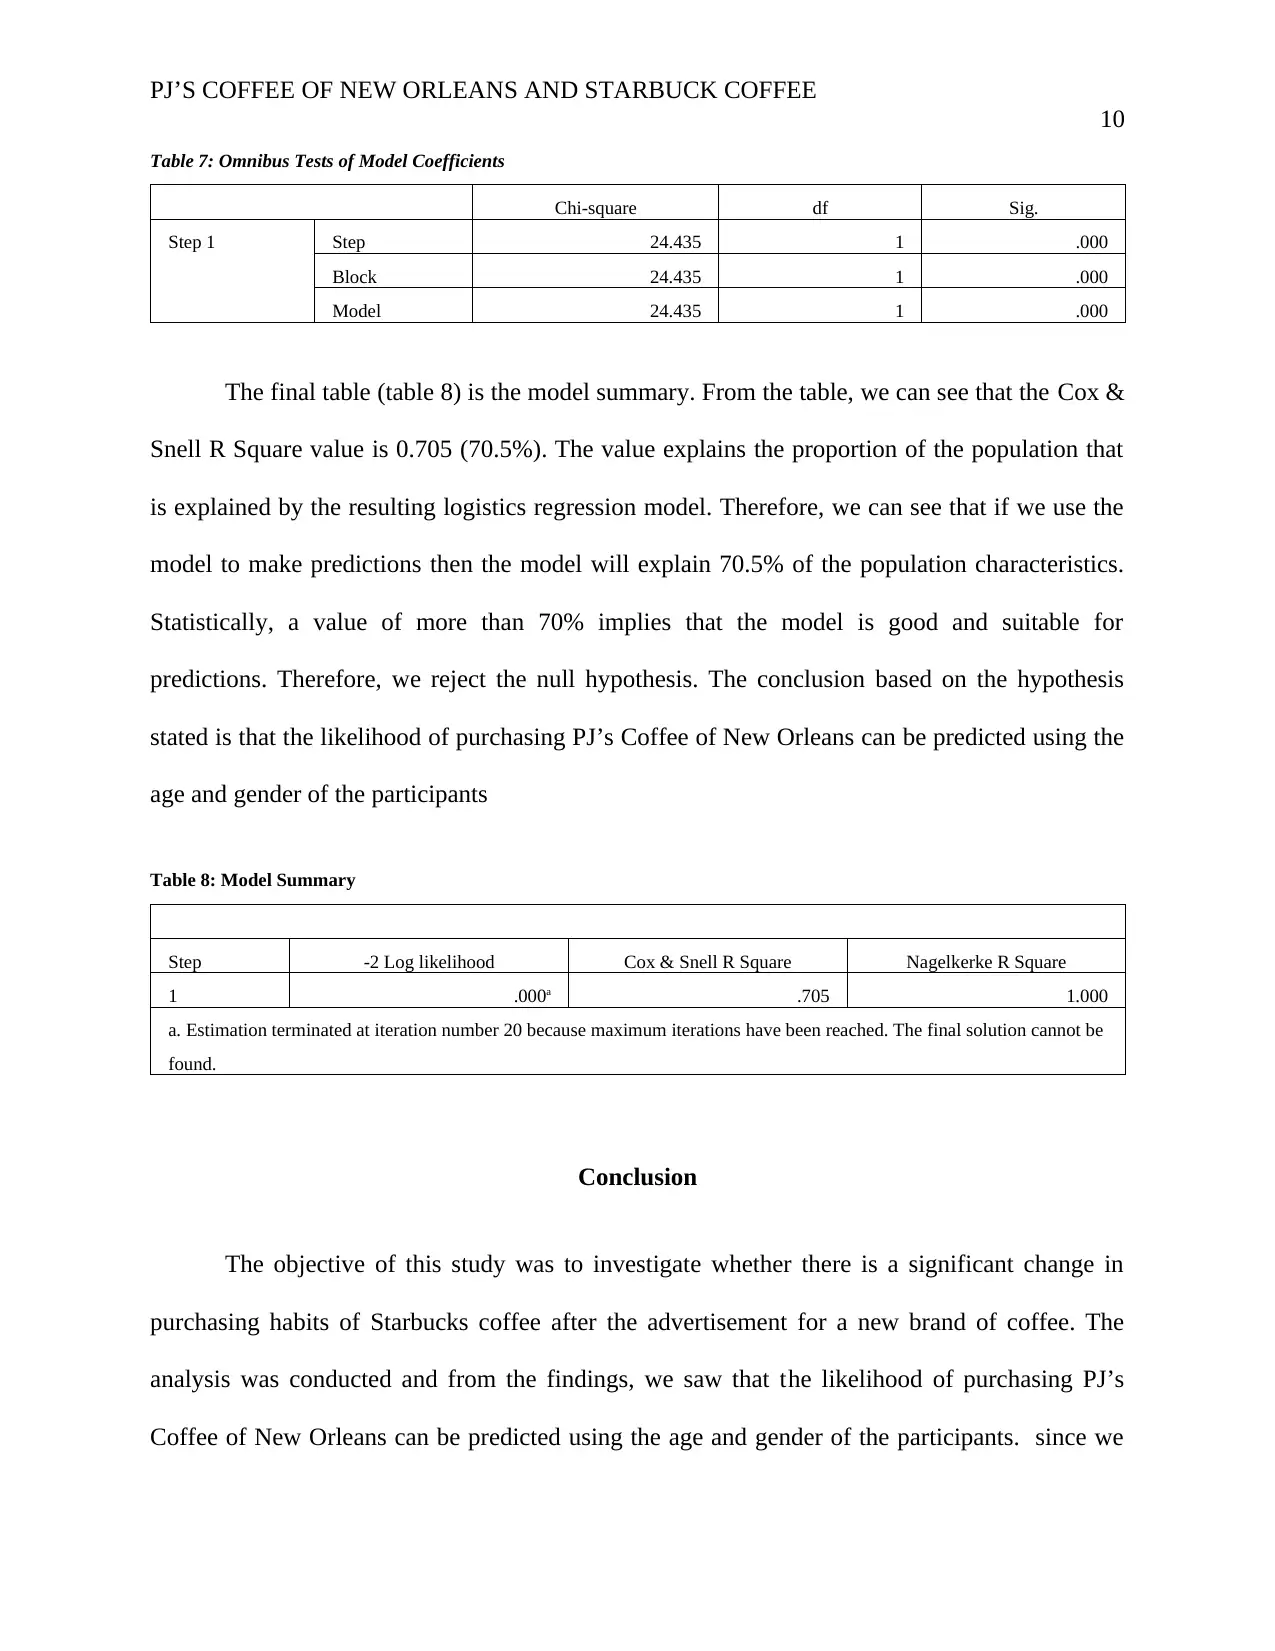
Table 7: Omnibus Tests of Model Coefficients
Chi-square df Sig.
Step 1 Step 24.435 1 .000
Block 24.435 1 .000
Model 24.435 1 .000
The final table (table 8) is the model summary. From the table, we can see that the Cox &
Snell R Square value is 0.705 (70.5%). The value explains the proportion of the population that
is explained by the resulting logistics regression model. Therefore, we can see that if we use the
model to make predictions then the model will explain 70.5% of the population characteristics.
Statistically, a value of more than 70% implies that the model is good and suitable for
predictions. Therefore, we reject the null hypothesis. The conclusion based on the hypothesis
stated is that the likelihood of purchasing PJ’s Coffee of New Orleans can be predicted using the
age and gender of the participants
Table 8: Model Summary
Step -2 Log likelihood Cox & Snell R Square Nagelkerke R Square
1 .000a .705 1.000
a. Estimation terminated at iteration number 20 because maximum iterations have been reached. The final solution cannot be
found.
Conclusion
The objective of this study was to investigate whether there is a significant change in
purchasing habits of Starbucks coffee after the advertisement for a new brand of coffee. The
analysis was conducted and from the findings, we saw that the likelihood of purchasing PJ’s
Coffee of New Orleans can be predicted using the age and gender of the participants. since we
10
Table 7: Omnibus Tests of Model Coefficients
Chi-square df Sig.
Step 1 Step 24.435 1 .000
Block 24.435 1 .000
Model 24.435 1 .000
The final table (table 8) is the model summary. From the table, we can see that the Cox &
Snell R Square value is 0.705 (70.5%). The value explains the proportion of the population that
is explained by the resulting logistics regression model. Therefore, we can see that if we use the
model to make predictions then the model will explain 70.5% of the population characteristics.
Statistically, a value of more than 70% implies that the model is good and suitable for
predictions. Therefore, we reject the null hypothesis. The conclusion based on the hypothesis
stated is that the likelihood of purchasing PJ’s Coffee of New Orleans can be predicted using the
age and gender of the participants
Table 8: Model Summary
Step -2 Log likelihood Cox & Snell R Square Nagelkerke R Square
1 .000a .705 1.000
a. Estimation terminated at iteration number 20 because maximum iterations have been reached. The final solution cannot be
found.
Conclusion
The objective of this study was to investigate whether there is a significant change in
purchasing habits of Starbucks coffee after the advertisement for a new brand of coffee. The
analysis was conducted and from the findings, we saw that the likelihood of purchasing PJ’s
Coffee of New Orleans can be predicted using the age and gender of the participants. since we
Paraphrase This Document
Need a fresh take? Get an instant paraphrase of this document with our AI Paraphraser
PJ’S COFFEE OF NEW ORLEANS AND STARBUCK COFFEE
11
can predict the likelihood of purchasing a new brand of coffee based on the advertisement, we
can say watching the video had a significant change in purchasing habits of Starbucks coffee
after the advertisement of a new brand of coffee. The likely effect of the results is that the other
coffee providers can take advantage of advertising their coffee though short videos in order to
effectively compete with Starbucks.
References
Goodwin, L. (2019, August 18). How Much is Starbucks Coffee in Countries Around the World?
Retrieved from https://www.thespruceeats.com/how-much-is-starbucks-coffee-766065
Lutz, A. (2013, October 30). How Many Customers Starbucks Will Have In The Future
[CHART]. Retrieved from https://www.businessinsider.com/how-many-customers-starbucks-
will-have-2013-10
Stilger, M. (2018, September 12). PJ’s Coffee of New Orleans Product Reel [Video]. Retrieved
from https://www.youtube.com/watch?v=d6ubrl3lb3c
We conducted our survey by sampling a random assortment of twenty adults from around Wal-
Mart and HEB grocery stores. 10 from each store respectively.
PJ’S COFFEE OF NEW ORLEANS AND STARBUCK COFFEE
12
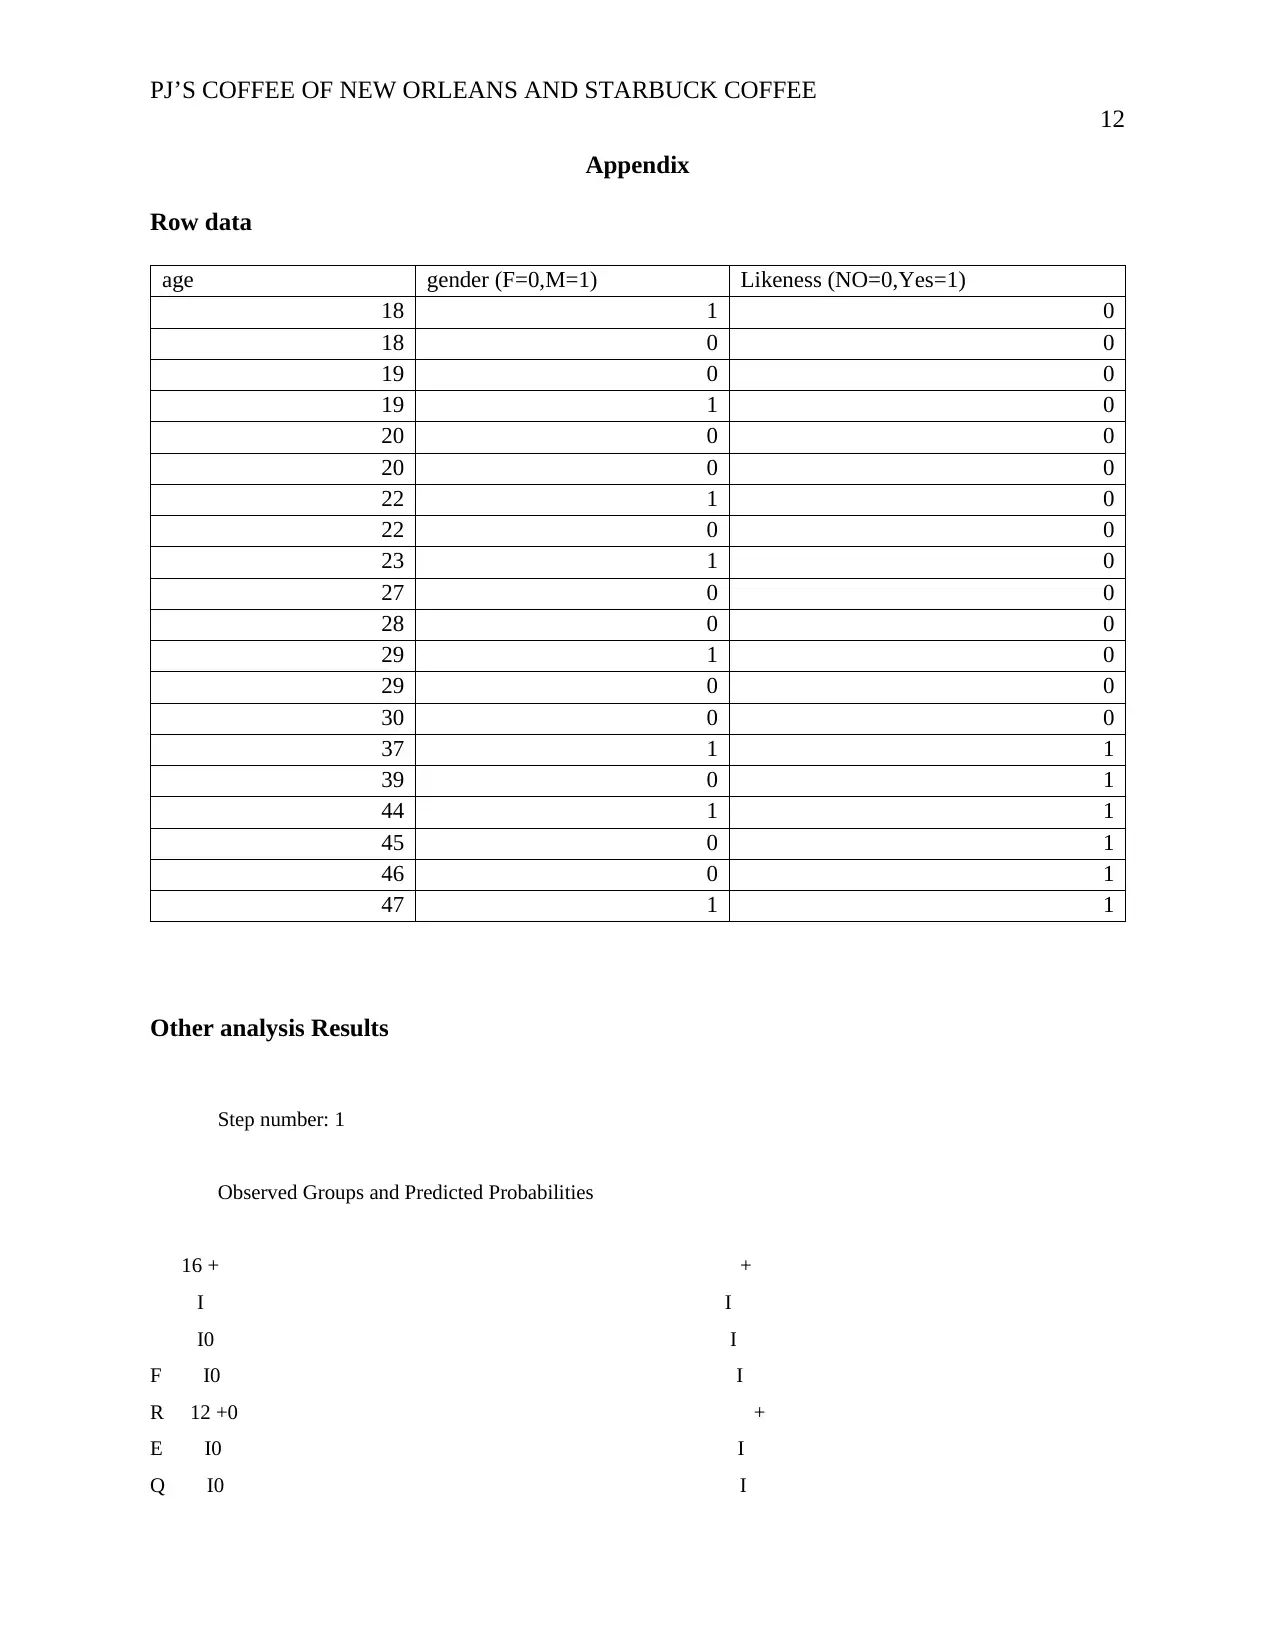
Appendix
Row data
age gender (F=0,M=1) Likeness (NO=0,Yes=1)
18 1 0
18 0 0
19 0 0
19 1 0
20 0 0
20 0 0
22 1 0
22 0 0
23 1 0
27 0 0
28 0 0
29 1 0
29 0 0
30 0 0
37 1 1
39 0 1
44 1 1
45 0 1
46 0 1
47 1 1
Other analysis Results
Step number: 1
Observed Groups and Predicted Probabilities
16 + +
I I
I0 I
F I0 I
R 12 +0 +
E I0 I
Q I0 I
12
Appendix
Row data
age gender (F=0,M=1) Likeness (NO=0,Yes=1)
18 1 0
18 0 0
19 0 0
19 1 0
20 0 0
20 0 0
22 1 0
22 0 0
23 1 0
27 0 0
28 0 0
29 1 0
29 0 0
30 0 0
37 1 1
39 0 1
44 1 1
45 0 1
46 0 1
47 1 1
Other analysis Results
Step number: 1
Observed Groups and Predicted Probabilities
16 + +
I I
I0 I
F I0 I
R 12 +0 +
E I0 I
Q I0 I
⊘ This is a preview!⊘
Do you want full access?
Subscribe today to unlock all pages.
Trusted by 1+ million students worldwide
1 out of 13
Your All-in-One AI-Powered Toolkit for Academic Success.
+13062052269
info@desklib.com
Available 24*7 on WhatsApp / Email
![[object Object]](/_next/static/media/star-bottom.7253800d.svg)
Unlock your academic potential
Copyright © 2020–2026 A2Z Services. All Rights Reserved. Developed and managed by ZUCOL.