Data Analysis and Statistical Report: Coffee Shop Performance Analysis

Verified

Added on  2022/12/29

|7
|1648
|37
Report
AI Summary
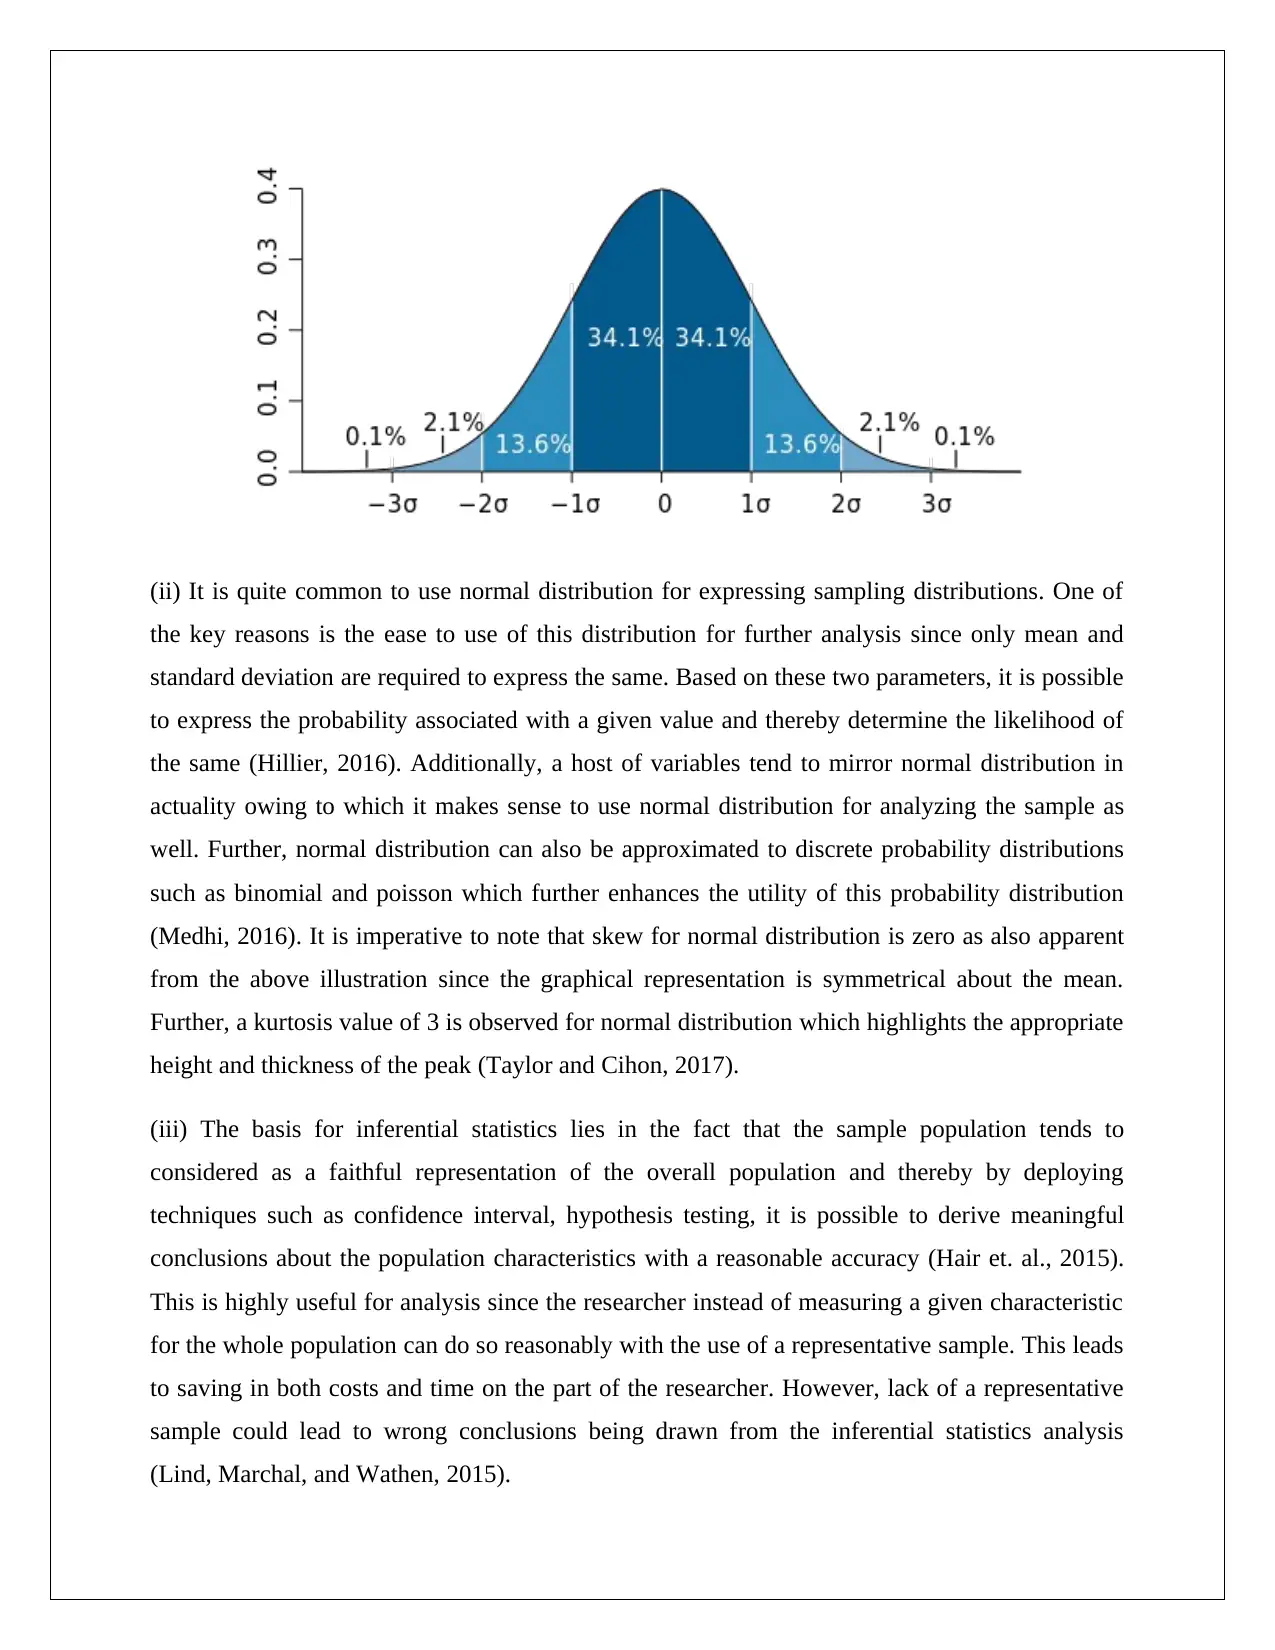
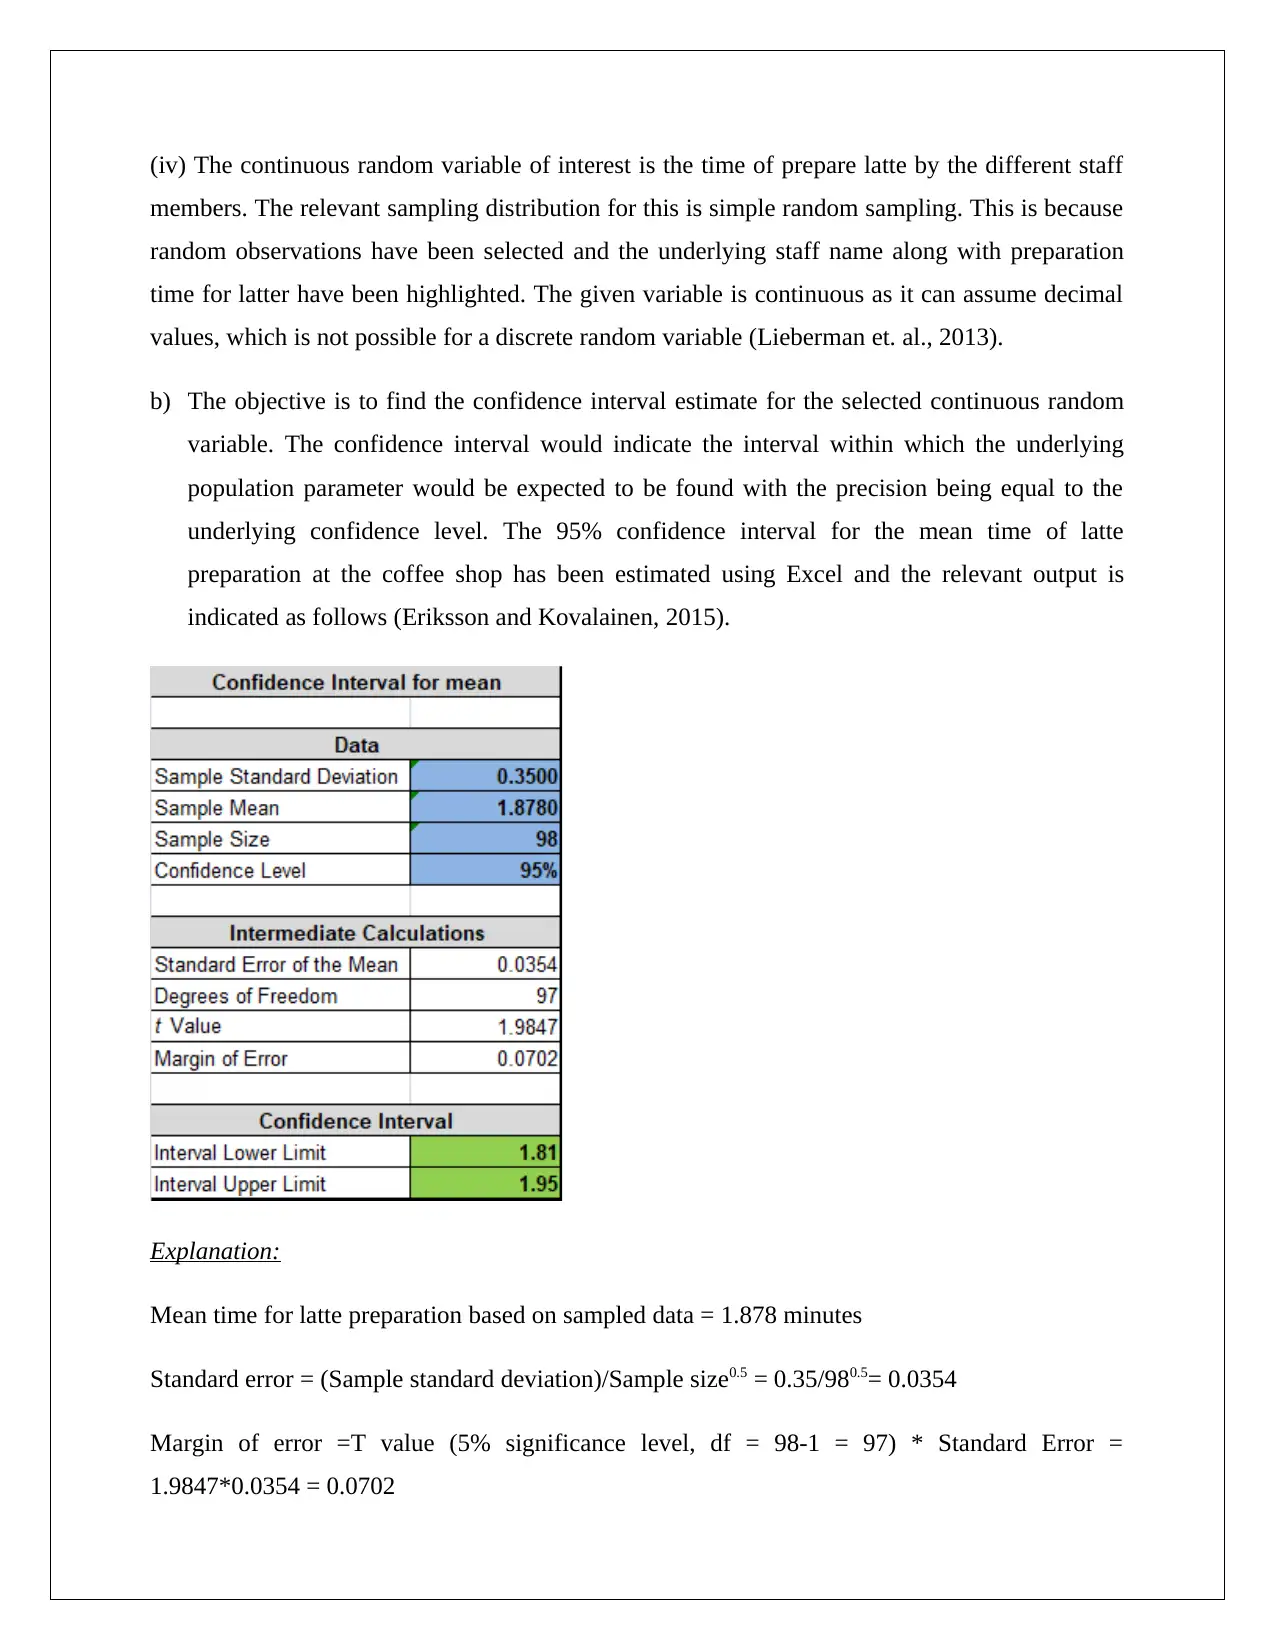
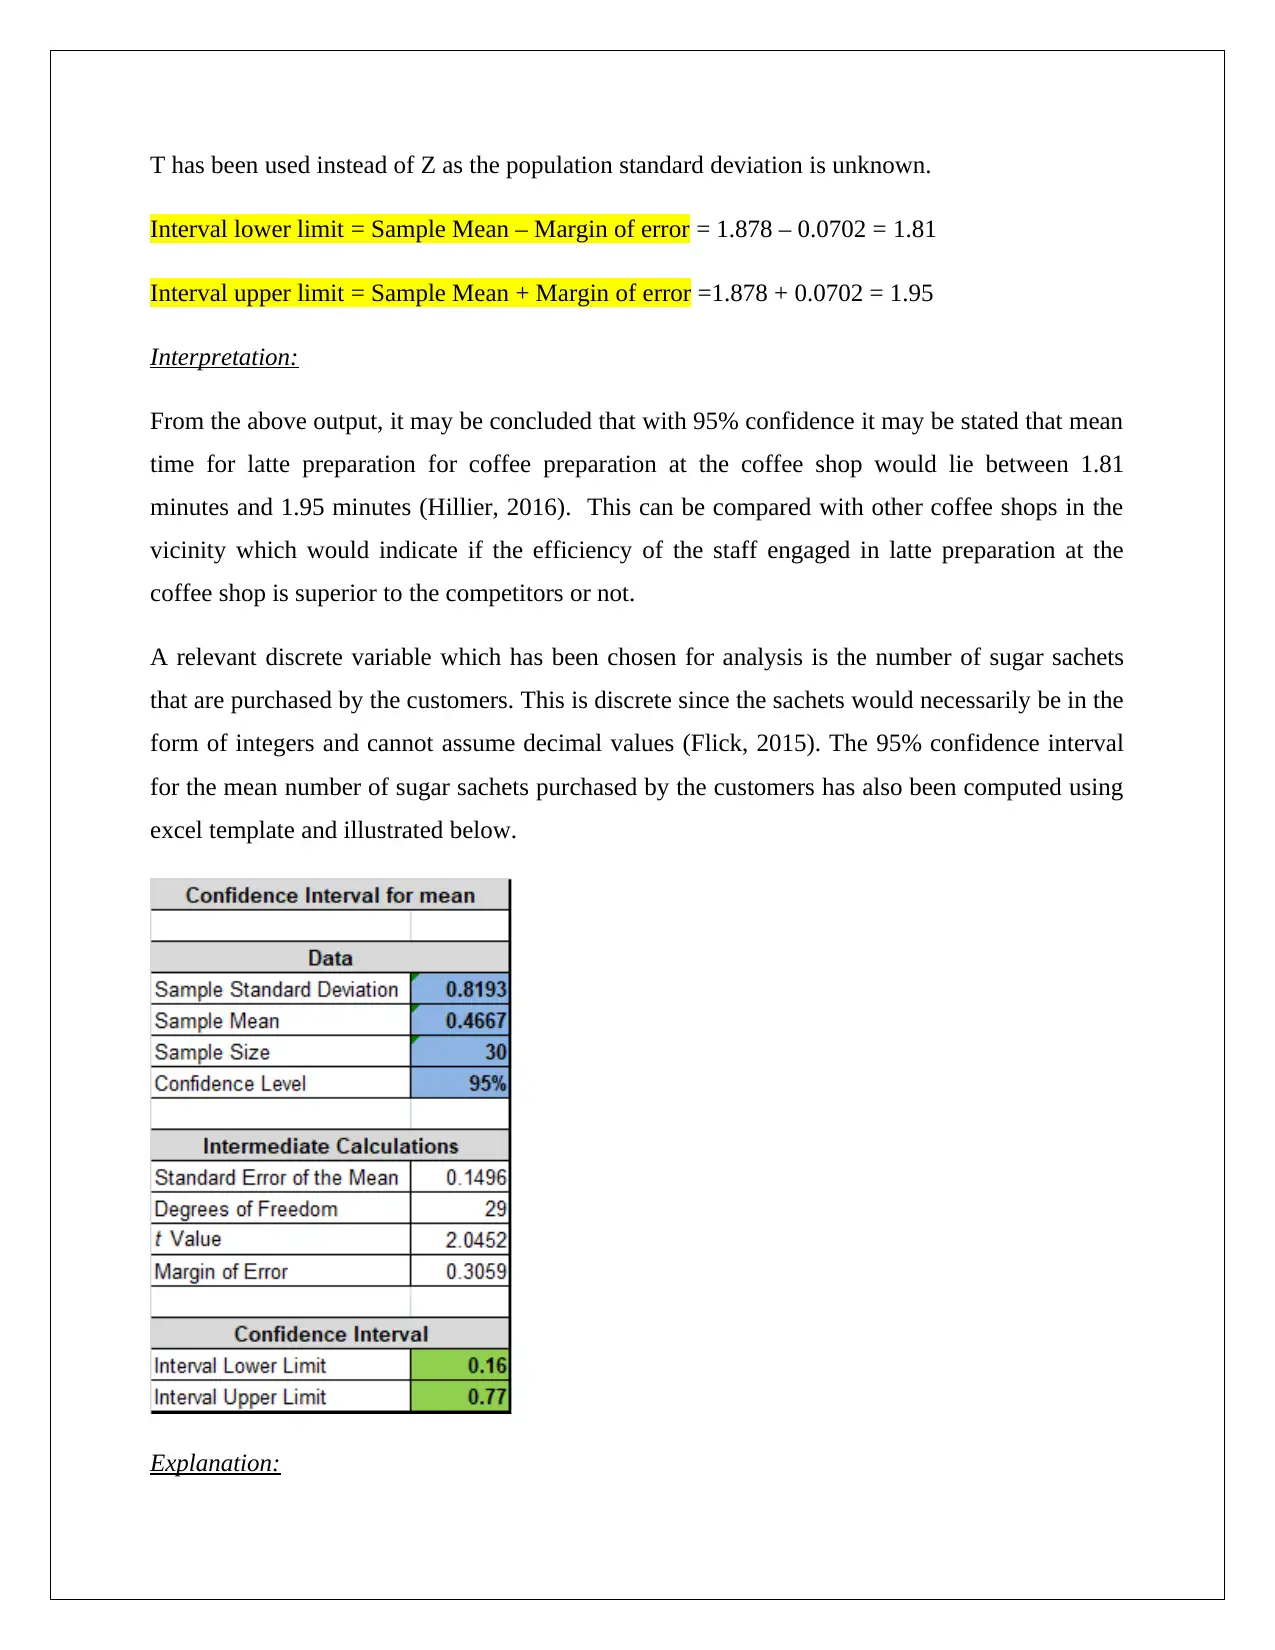
This report presents a data analysis of a coffee shop's business activities, focusing on food preparation time and customer behavior. The analysis utilizes statistical techniques, including the application of normal distribution and confidence intervals, to derive meaningful conclusions. The report examines a continuous random variable, latte preparation time, and a discrete variable, sugar sachet purchases, providing confidence interval estimates for their means. The findings suggest that the average latte preparation time falls between 1.81 and 1.95 minutes with 95% confidence, and the average sugar sachet purchase per order ranges from 0.16 to 0.77 with 95% confidence. This information can assist the coffee shop management in evaluating staff efficiency, managing inventory, and making informed business decisions. The report also provides a theoretical background on normal distribution and inferential statistics, explaining their significance in data analysis.
Document Page
DATA ANALYSIS
STATISTICS
STUDENT ID:
[Pick the date]
tabler-icon-diamond-filled.svg

Paraphrase This Document

Need a fresh take? Get an instant paraphrase of this document with our AI Paraphraser
Document Page
Introduction
The objective of the given report is to provide the result of data analysis with regards to data
pertaining to coffee shop based on the application of appropriate statistical techniques. The given
report also provides some theoretical background with regards to normal distribution and also an
inferential statistical technique which is confidence interval. The data in the context of coffee
shop relates to food preparation time and the customer behavior. The former provides
information about the staff and their efficiency in terms of time required to prepare various items
on the menu. The latter provides information pertaining to behavior of customer in terms of
purchasing decision and time spent in the coffee shop. A continuous random variable has been
selected from the food preparation time which relates to the latte preparation time. Further, a
discrete variable has been selected from customer behavior which relates to the sugar sachet
purchased by the consumers per order. The confidence interval for the mean of both selected
variables has been estimated as part of the report which may be useful for the management in
taking suitable decisions to enhance efficiency and profitability of the coffee shop.
Analysis
a) (i) For facilitating analysis of various populations, suitable samples are drawn and requisite
inferential statistical techniques are applied based on the underlying probability distribution
associated with the sample. One of the most common sampling distributions is normal
distribution. This may be defined as a continuous probability distribution which is symmetric
about the mean and tends to represent itself in a form of a bell curve. This implies that as one
moves away from the mean, the probability of finding a particular value decreases (Flick,
2015). This is evident from the following graphical illustration.
Document Page
(ii) It is quite common to use normal distribution for expressing sampling distributions. One of
the key reasons is the ease to use of this distribution for further analysis since only mean and
standard deviation are required to express the same. Based on these two parameters, it is possible
to express the probability associated with a given value and thereby determine the likelihood of
the same (Hillier, 2016). Additionally, a host of variables tend to mirror normal distribution in
actuality owing to which it makes sense to use normal distribution for analyzing the sample as
well. Further, normal distribution can also be approximated to discrete probability distributions
such as binomial and poisson which further enhances the utility of this probability distribution
(Medhi, 2016). It is imperative to note that skew for normal distribution is zero as also apparent
from the above illustration since the graphical representation is symmetrical about the mean.
Further, a kurtosis value of 3 is observed for normal distribution which highlights the appropriate
height and thickness of the peak (Taylor and Cihon, 2017).
(iii) The basis for inferential statistics lies in the fact that the sample population tends to
considered as a faithful representation of the overall population and thereby by deploying
techniques such as confidence interval, hypothesis testing, it is possible to derive meaningful
conclusions about the population characteristics with a reasonable accuracy (Hair et. al., 2015).
This is highly useful for analysis since the researcher instead of measuring a given characteristic
for the whole population can do so reasonably with the use of a representative sample. This leads
to saving in both costs and time on the part of the researcher. However, lack of a representative
sample could lead to wrong conclusions being drawn from the inferential statistics analysis
(Lind, Marchal, and Wathen, 2015).
Document Page
(iv) The continuous random variable of interest is the time of prepare latte by the different staff
members. The relevant sampling distribution for this is simple random sampling. This is because
random observations have been selected and the underlying staff name along with preparation
time for latter have been highlighted. The given variable is continuous as it can assume decimal
values, which is not possible for a discrete random variable (Lieberman et. al., 2013).
b) The objective is to find the confidence interval estimate for the selected continuous random
variable. The confidence interval would indicate the interval within which the underlying
population parameter would be expected to be found with the precision being equal to the
underlying confidence level. The 95% confidence interval for the mean time of latte
preparation at the coffee shop has been estimated using Excel and the relevant output is
indicated as follows (Eriksson and Kovalainen, 2015).
Explanation:
Mean time for latte preparation based on sampled data = 1.878 minutes
Standard error = (Sample standard deviation)/Sample size0.5 = 0.35/980.5= 0.0354
Margin of error =T value (5% significance level, df = 98-1 = 97) * Standard Error =
1.9847*0.0354 = 0.0702
tabler-icon-diamond-filled.svg

Paraphrase This Document

Need a fresh take? Get an instant paraphrase of this document with our AI Paraphraser
Document Page
T has been used instead of Z as the population standard deviation is unknown.
Interval lower limit = Sample Mean – Margin of error = 1.878 – 0.0702 = 1.81
Interval upper limit = Sample Mean + Margin of error =1.878 + 0.0702 = 1.95
Interpretation:
From the above output, it may be concluded that with 95% confidence it may be stated that mean
time for latte preparation for coffee preparation at the coffee shop would lie between 1.81
minutes and 1.95 minutes (Hillier, 2016). This can be compared with other coffee shops in the
vicinity which would indicate if the efficiency of the staff engaged in latte preparation at the
coffee shop is superior to the competitors or not.
A relevant discrete variable which has been chosen for analysis is the number of sugar sachets
that are purchased by the customers. This is discrete since the sachets would necessarily be in the
form of integers and cannot assume decimal values (Flick, 2015). The 95% confidence interval
for the mean number of sugar sachets purchased by the customers has also been computed using
excel template and illustrated below.
Explanation:
Document Page
Mean number of sugar sachets purchased based on sampled data = 0.4667
Standard error = (Sample standard deviation)/Sample size0.5 = 0.8193/300.5= 0.1496
Margin of error =T value (5% significance level, df = 30-1 = 29) * Standard Error =
2.0452*0.1496 = 0.3059
T has been used instead of Z as the population standard deviation is unknown.
Interval lower limit = Sample Mean – Margin of error = 0.4667 – 0.3059 = 0.16
Interval upper limit = Sample Mean + Margin of error =0.4667 + 0.3059 = 0.77
Interpretation:
The 95% confidence interval for average purchase of sugar sachets by consumers at the coffee
shop per order varies from 0.16 to 0.77 (Hastie, Tibshirani and Friedman, 2014). This clearly
highlights that the sugar sachets that are purchased by the consumers is quite less.
Conclusion
Based on the above analysis, it can be concluded with 95% confidence that the average time for
latte preparation for the complete staff at the given coffee shop would lie between 1.81 minutes
and 1.95 minutes. This information could be useful for the management in comparing the
performance of the staff at coffee shop with the staff at other coffee shops and derive a more
accurate analysis of the overall performance. Further, it can also be concluded with 95%
confidence that the average sugar sachets which would be bought by customer per order would
range between 0.16 to 0.77. As a result, the inventory of sugar can be managed considering this
demand which can potentially lead to better management of working capital.
Document Page
References
Eriksson, P. and Kovalainen, A. (2015) Quantitative methods in business research. 3rd ed.
London: Sage Publications, pp. 156-157
Flick, U. (2015) Introducing research methodology: A beginner's guide to doing a research
project. 4th ed. New York: Sage Publications, pp. 134
Hair, J. F., Wolfinbarger, M., Money, A. H., Samouel, P., and Page, M. J. (2015) Essentials of
business research methods. 2nd ed. New York: Routledge, pp. 198
Hastie, T., Tibshirani, R. and Friedman, J. (2014) The Elements of Statistical Learning. 4th
ed. New York: Springer Publications, pp. 167
Hillier, F. (2016) Introduction to Operations Research.6th ed.New York: McGraw Hill
Publications, pp. 213
Lieberman, F. J., Nag, B., Hiller, F.S. and Basu, P. (2013) Introduction To Operations Research.
5th ed.New Delhi: Tata McGraw Hill Publishers, pp. 154
Lind, A.D., Marchal, G.W. and Wathen, A.S. (2015) Statistical Techniques in Business and
Economics. 15th ed. New York : McGraw-Hill/Irwin, pp. 112
Medhi, J. (2016) Statistical Methods: An Introductory Text. 4th ed. Sydney: New Age
International, pp. 187-188
Taylor, K. J. and Cihon, C. (2017) Statistical Techniques for Data Analysis. 2nd ed. Melbourne:
CRC Press.
chevron_up_icon
1 out of 7
circle_padding
hide_on_mobile
zoom_out_icon
[object Object]