Statistics Report: Industry Experience, Cognitive Ability, Performance
VerifiedAdded on 2020/10/05
|44
|7616
|282
Report
AI Summary
This report presents a comprehensive statistical analysis examining the relationships between cognitive ability, job performance, and industry experience. It begins with an interpretation of factor analysis outputs for Big Five personality traits, cognitive variables, and job performance variables, detailing correlation matrices, communalities, total variance explained, scree plots, component matrices, and rotated component matrices. The report then delves into regression analysis, interpreting ANOVA outputs to assess the significance of personality traits, cognitive ability, and experience. Furthermore, it explores the hypothesis that industry experience mediates and moderates the effect of cognitive ability on job performance, supported by statistical findings and referencing relevant literature. The analysis includes detailed explanations of statistical outputs and their implications, providing a thorough understanding of the data and its interpretations.

Statistics
Paraphrase This Document
Need a fresh take? Get an instant paraphrase of this document with our AI Paraphraser
Table of Contents
Q1: Factor analysis: .................................................................................................................................3
Q2: Regression analysis:..........................................................................................................................5
Q3: Hypothesis that industry experience mediates the effect of cognitive ability on job performance..6
Q4: Other factors, aside from statistical support in the regression model..............................................8
Q5: Hypothesis that industry experience moderates the effect of cognitive ability on job performance
.................................................................................................................................................................8
REFERENCES................................................................................................................................................9
APPENDIX..................................................................................................................................................10
Q1: Factor analysis:
Interpretation of Outputs for Big five personality traits, Cognitive Analysis and Job Performance
Analysis:
Big five personality traits:
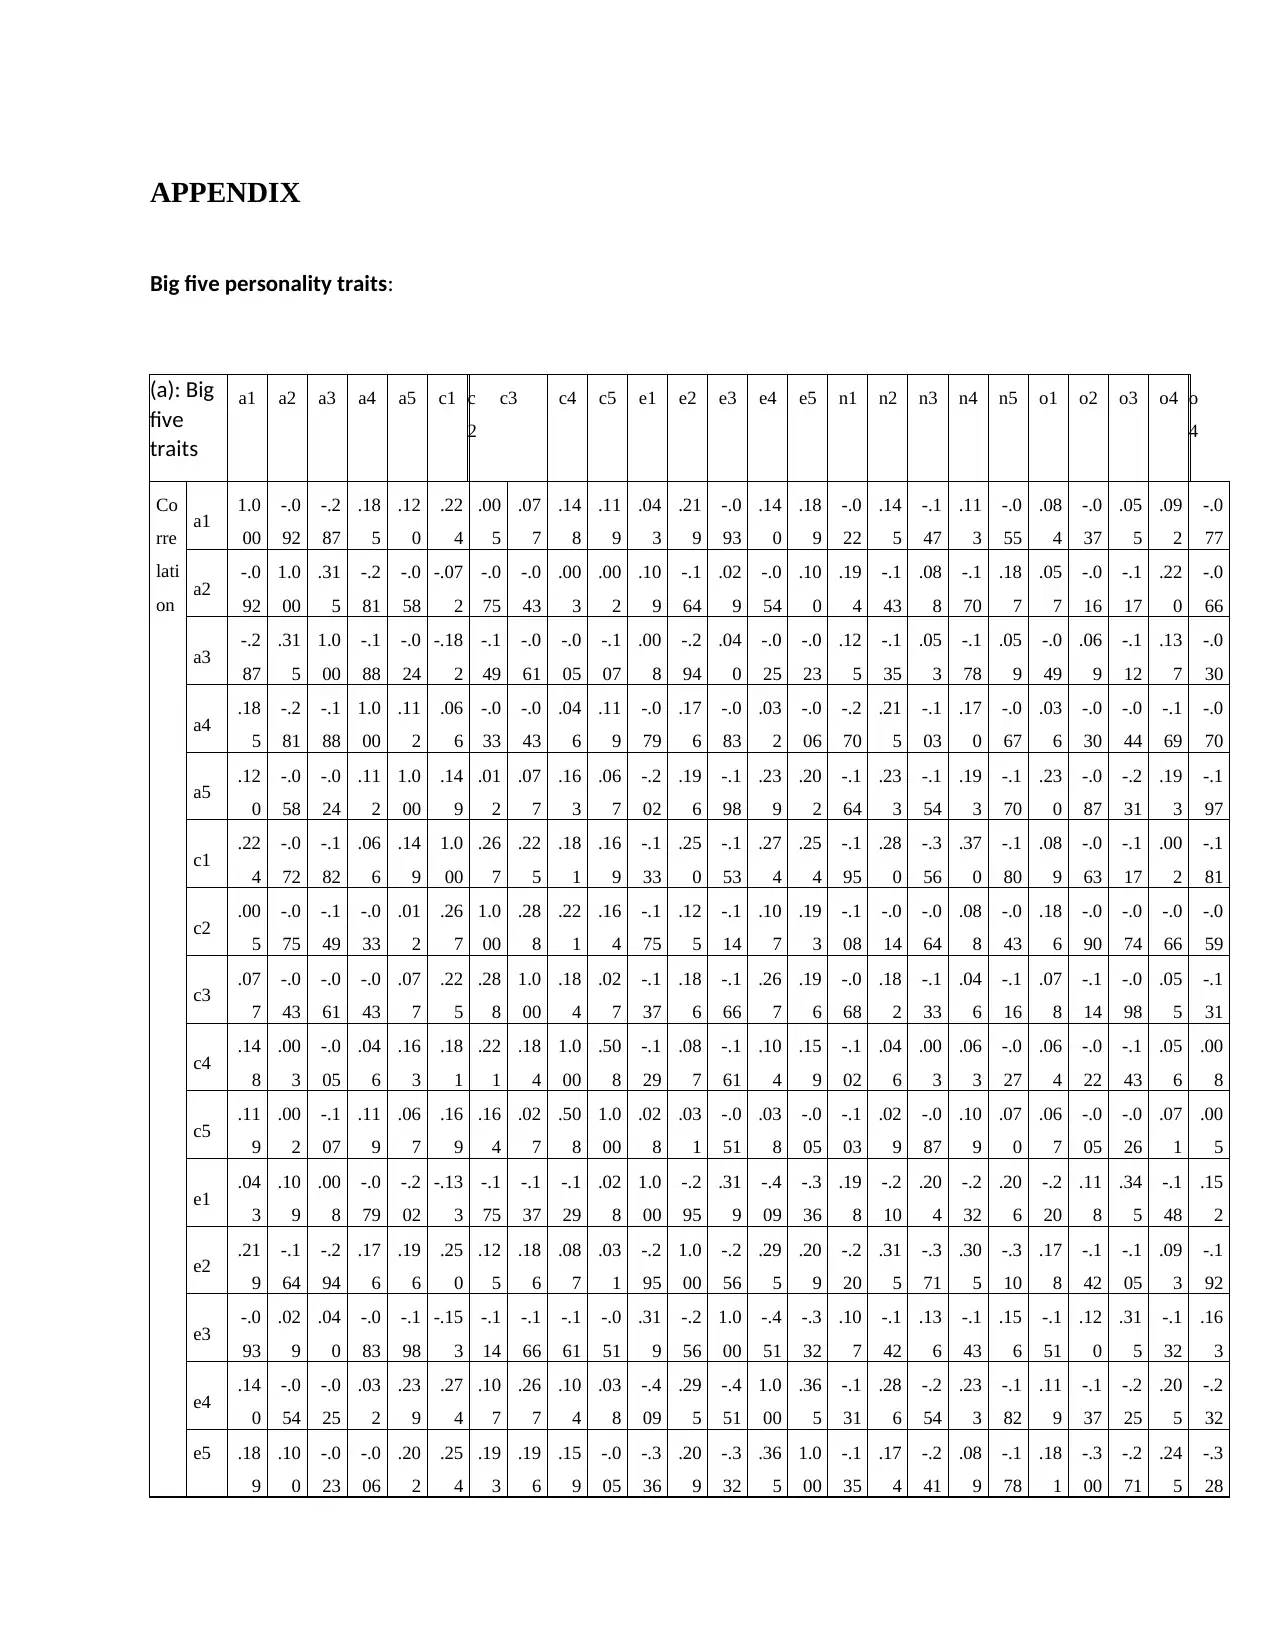
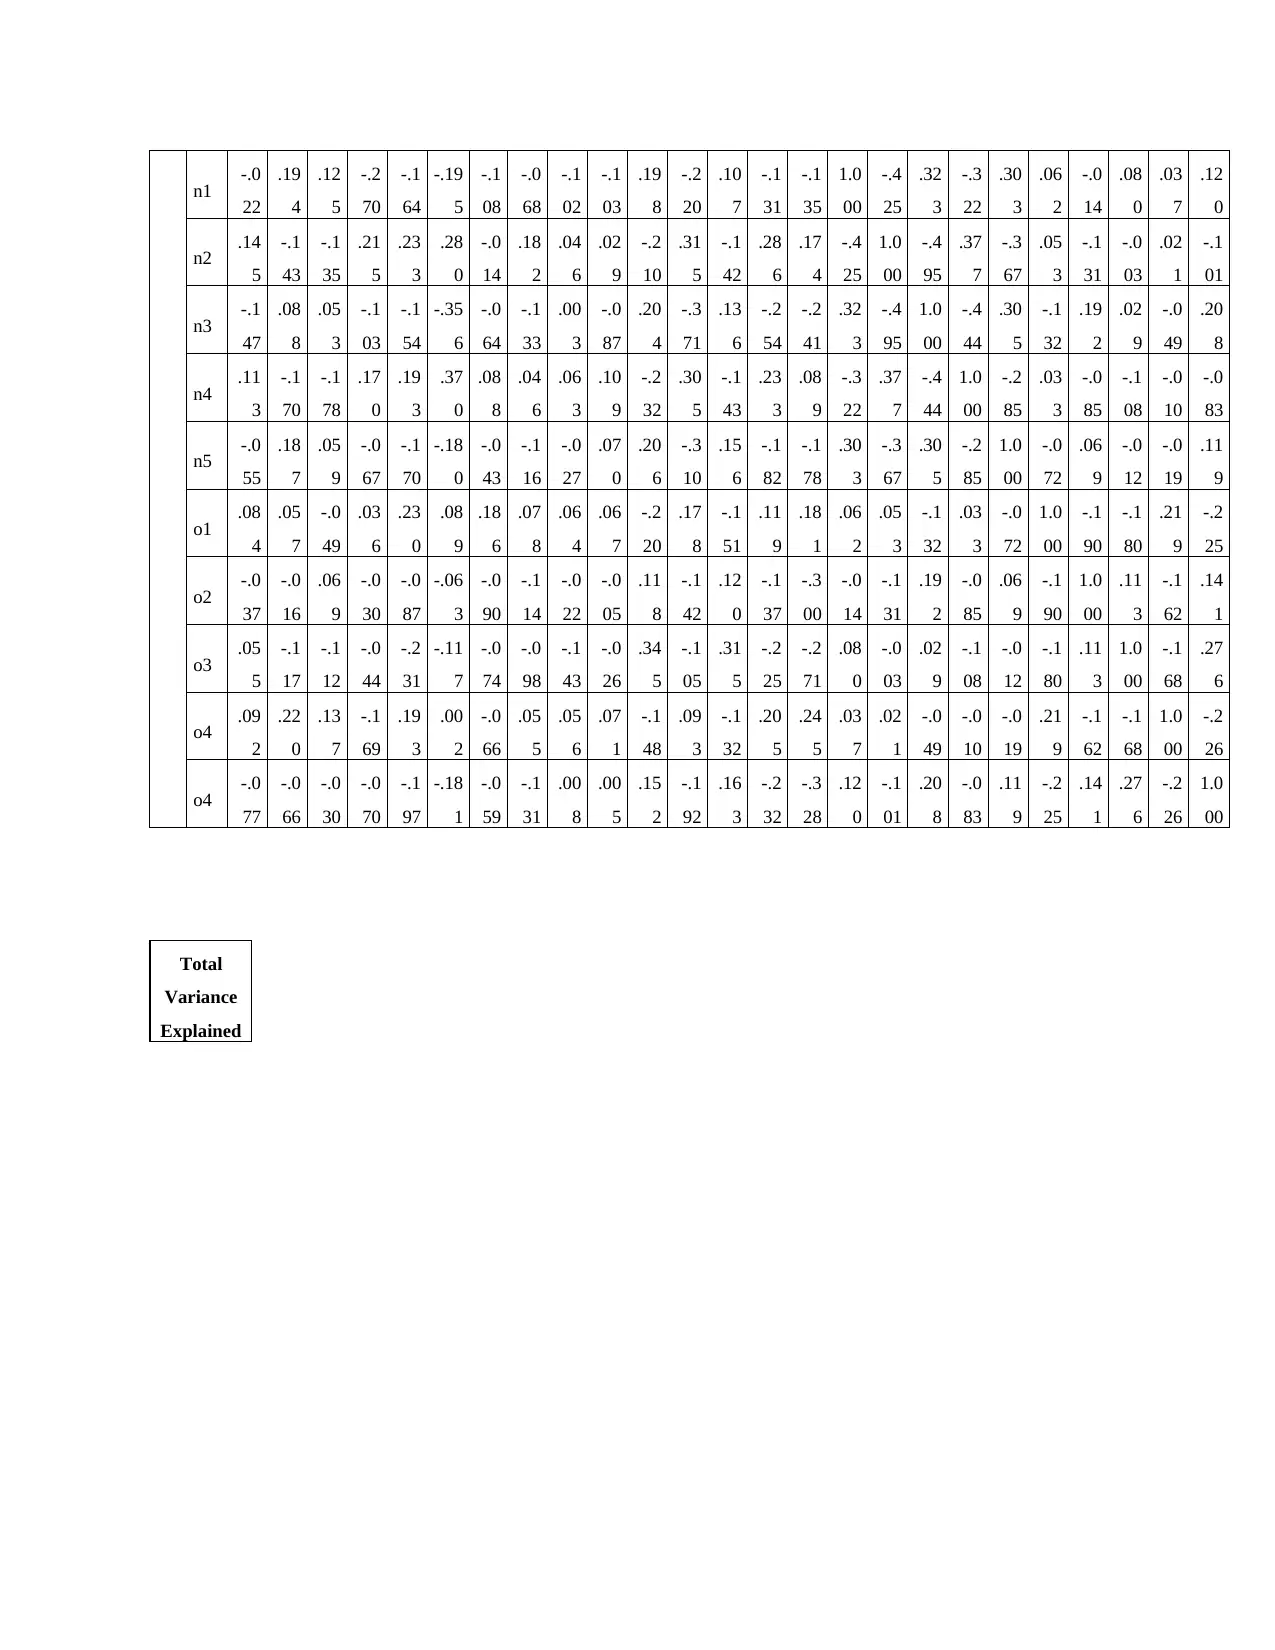
Correlation Matrix: A basic screening of this output tells us how many variables are
significant. Significance of a variable is generally shown when the majority of the values equal
or more than 0.05. After screening, correlation coefficients of value equal or more than 0.9 are
observed from these selected significant variables. Out of 25 personality traits, 2 personality
traits viz. a1, o1 have 15 significant values over 0.05.
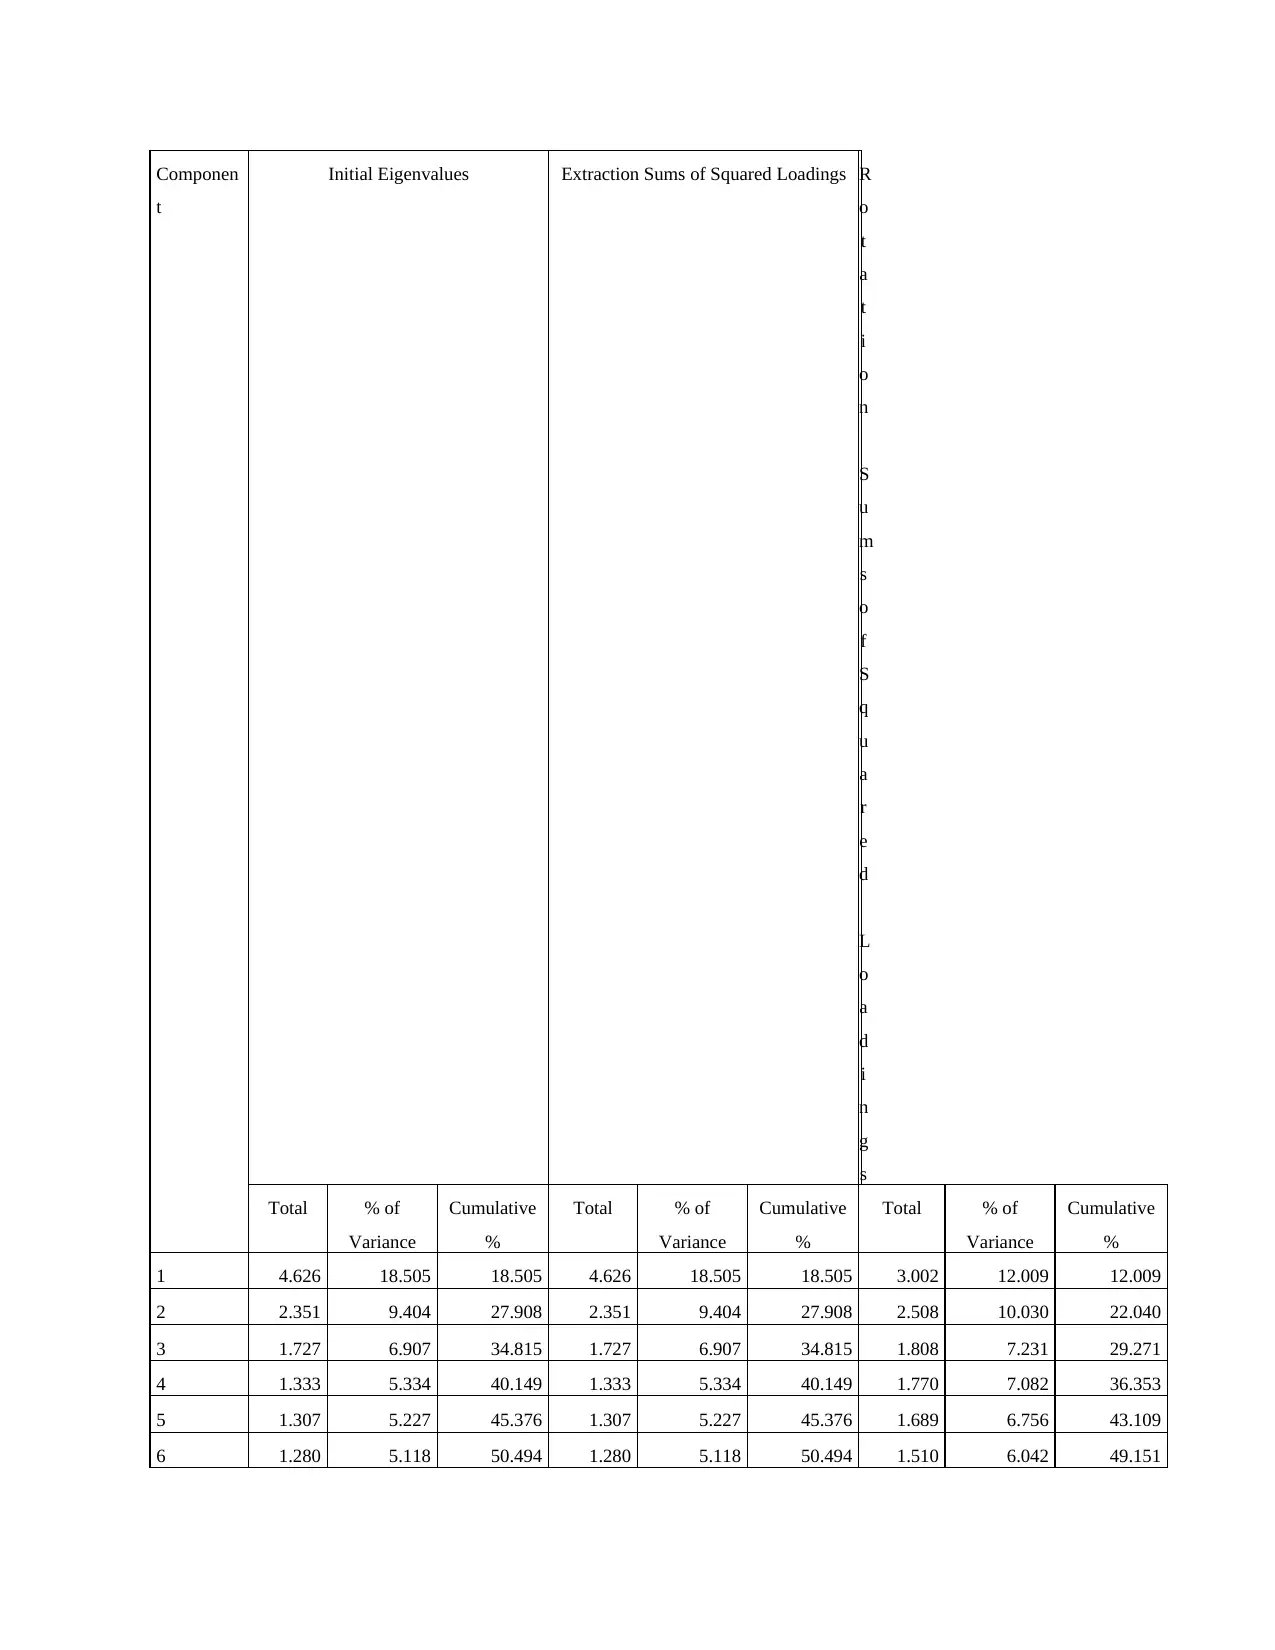
Total Variance Explained: Eigenvalues are variances of principal components. The percentage
of variance for these seven dimensions account for 54.75% of the total variance. The first
Eigenvalue will always be the highest accounting for most variance (DeSantis And et. Al, 2014).
Extraction Sums of Squared Loading reproduces exact values as generated by column 2 to 3,
focusing only on components with Eigenvalue more than 1.Rotation Sums of Squared Loadings
represents varimax rotation that has redistributed total variance over 7 component making it
more concise and smooth.
Scree Plot: Scree Plot is a graphical representation of Eigenvalues against their components.
Eigenvalues have been plotted on the Y-axis and their related component numbers have been
plotted on the X-axis respectively. One can observe that after the 7th dimension in component
space, the graph shows a flat line conveying that each successive component with variance
accounted goes on decreasing.
Component Matrix: The table shows a component matrix before rotation. It can be seen that
except for a2, o4, c5, c4,a1, a3, c2 and a4,most of the personality traits are loaded on Factor 1.
On the other hand, apart from n5, c5, c4 and c2, none of the personality traits are loaded on
Factor 3.
Rotated Component Matrix: Rotated Component Matrix forms one of the key outputs of
Principal Components Analysis in SPSS. The Output shows that out of all the components,
Component 1 has the highest correlation with n2 (+0.752) and lowest correlation with n3 (-
Interpretation of Outputs for Big five personality traits, Cognitive Analysis and Job Performance
Analysis:
Big five personality traits:
Correlation Matrix: A basic screening of this output tells us how many variables are
significant. Significance of a variable is generally shown when the majority of the values equal
or more than 0.05. After screening, correlation coefficients of value equal or more than 0.9 are
observed from these selected significant variables. Out of 25 personality traits, 2 personality
traits viz. a1, o1 have 15 significant values over 0.05.
Total Variance Explained: Eigenvalues are variances of principal components. The percentage
of variance for these seven dimensions account for 54.75% of the total variance. The first
Eigenvalue will always be the highest accounting for most variance (DeSantis And et. Al, 2014).
Extraction Sums of Squared Loading reproduces exact values as generated by column 2 to 3,
focusing only on components with Eigenvalue more than 1.Rotation Sums of Squared Loadings
represents varimax rotation that has redistributed total variance over 7 component making it
more concise and smooth.
Scree Plot: Scree Plot is a graphical representation of Eigenvalues against their components.
Eigenvalues have been plotted on the Y-axis and their related component numbers have been
plotted on the X-axis respectively. One can observe that after the 7th dimension in component
space, the graph shows a flat line conveying that each successive component with variance
accounted goes on decreasing.
Component Matrix: The table shows a component matrix before rotation. It can be seen that
except for a2, o4, c5, c4,a1, a3, c2 and a4,most of the personality traits are loaded on Factor 1.
On the other hand, apart from n5, c5, c4 and c2, none of the personality traits are loaded on
Factor 3.
Rotated Component Matrix: Rotated Component Matrix forms one of the key outputs of
Principal Components Analysis in SPSS. The Output shows that out of all the components,
Component 1 has the highest correlation with n2 (+0.752) and lowest correlation with n3 (-
⊘ This is a preview!⊘
Do you want full access?
Subscribe today to unlock all pages.
Trusted by 1+ million students worldwide
0.755). Component 5 has highest correlation with c5 (+0.838) trait out of c5 and c4 personality
traits (Triola, 2013) .
Component Transformation Matrix: This matrix displays the correlation among components
that exists before and after the rotation. It has used Varimax as a rotational method with Kaiser
Normalization.
Cognitive analysis:
Correlation Matrix:In this output significance of a variable is generally shown when the
majority of the values equal or more than 0.05. Cognitive Variable x1 has highest correlation
with x8 variable (+0.270) and least correlation with x9 (+0.072).
Communalities: Communalities represent the ratio of variance accounted for in every variable
by extracted factors. Over 58.8% of the variance has been accounted for in x2 and only 21.4% of
the variance has been accounted for in x11.
Total Variance Explained: Eigenvalues are variances of principal components. The percentage
of variance for these three dimensions account for 46.59% of the total variance. Extraction Sums
of Squared Loading reproduces exact values as generated by column 2 to 3, focusing only on
components with Eigenvalue more than 1. Varimax rotation has redistributed total variance over
3 dimensions in component space making it more concise and smooth.
Scree Plot: In the above Scree Plot, Eigenvalues have been plotted on the Y-axis and their
related component numbers have been plotted on the X-axis respectively. One can observe that
after the 3rd dimension in component number, a flat line is formed (DeSantis, Bryan and Jemal,
2014).
Component Matrix: The table shows a component matrix before rotation. It can be seen that
most of the cognitive variables are loaded on Factor 1. On the other hand, apart from x1, x2 and
x10, none of the cognitive variables are loaded on Factor 3.
Rotated Component Matrix: The generated output shows that out of all the components,
Component 1 has the highest correlation with x10 (+0.688) and lowest correlation with x12
(+0.500). Component 3 has highest correlation with x2 cognitive variable (+0.761) and lowest
correlation with x11 cognitive variable (+0.327).
Paraphrase This Document
Need a fresh take? Get an instant paraphrase of this document with our AI Paraphraser
Component Transformation Matrix: This matrix displays the correlation among components
that exists before and after the rotation. It has used Varimax as a rotational method with Kaiser
Normalization.
Job performance analysis:
Correlation Matrix:A basic screening of this output tells us how many variables are significant.
Significance of a variable is generally shown when the majority of the values equal or more than
0.05. R1 includes highest correlation with R8 (+0.689) and least correlation with R10 (+0.111).
Communalities: Communalities generated in the above output shows over 79.5% of the
variance accounted for in R8 and only 51.4% of the variance has been accounted for in R10.
Total Variance Explained: The above output indicates the percentage of variance for two
components account for 65.77% of the total variance (Blackwell, Lucas and Clarke, 2014).
Extraction Sums of Squared Loading reproduces exact values focusing only on components with
Eigenvalue more than 1. Varimax rotation has redistributed total variance over 3 dimensions in
component space making it more concise and smooth.
Scree Plot: The Scree Plot has Eigenvalues plotted on the Y-axis and their related component
numbers have been plotted on the X-axis respectively. One can observe that after the 2nd
dimension in component number, a flat line is formed.
Component Matrix:The table shows a component matrix with most of the variables loaded on
Factor 1. On the other hand, apart from R5, R2 and R10, none of the variables are loaded on
Factor 2.
Rotated Component Matrix: The table shows a component matrix before rotation. It can be
seen that most of the cognitive variables are loaded on Factor 1. On the other hand, apart from
x1, x2 and x10, none of the cognitive variables are loaded on Factor 3.
Component Transformation Matrix: This matrix displays the correlation among components
that exists before and after the rotation. It has used Varimax as a rotational method with Kaiser
Normalization.
Q2: Regression analysis:
ANOVA Interpretation:
that exists before and after the rotation. It has used Varimax as a rotational method with Kaiser
Normalization.
Job performance analysis:
Correlation Matrix:A basic screening of this output tells us how many variables are significant.
Significance of a variable is generally shown when the majority of the values equal or more than
0.05. R1 includes highest correlation with R8 (+0.689) and least correlation with R10 (+0.111).
Communalities: Communalities generated in the above output shows over 79.5% of the
variance accounted for in R8 and only 51.4% of the variance has been accounted for in R10.
Total Variance Explained: The above output indicates the percentage of variance for two
components account for 65.77% of the total variance (Blackwell, Lucas and Clarke, 2014).
Extraction Sums of Squared Loading reproduces exact values focusing only on components with
Eigenvalue more than 1. Varimax rotation has redistributed total variance over 3 dimensions in
component space making it more concise and smooth.
Scree Plot: The Scree Plot has Eigenvalues plotted on the Y-axis and their related component
numbers have been plotted on the X-axis respectively. One can observe that after the 2nd
dimension in component number, a flat line is formed.
Component Matrix:The table shows a component matrix with most of the variables loaded on
Factor 1. On the other hand, apart from R5, R2 and R10, none of the variables are loaded on
Factor 2.
Rotated Component Matrix: The table shows a component matrix before rotation. It can be
seen that most of the cognitive variables are loaded on Factor 1. On the other hand, apart from
x1, x2 and x10, none of the cognitive variables are loaded on Factor 3.
Component Transformation Matrix: This matrix displays the correlation among components
that exists before and after the rotation. It has used Varimax as a rotational method with Kaiser
Normalization.
Q2: Regression analysis:
ANOVA Interpretation:
Personality traits: The value of 0.078 indicates that p-value is greater than 0.05 showing
significant difference between means.
Cognitive Ability:The value of 0.499 indicates that p-value is greater than 0.05 showing
significant difference between means.
Experience:The value of 0.446 indicates that p-value is greater than 0.05 showing significant
difference between means (Searle and Khuri, 2017).
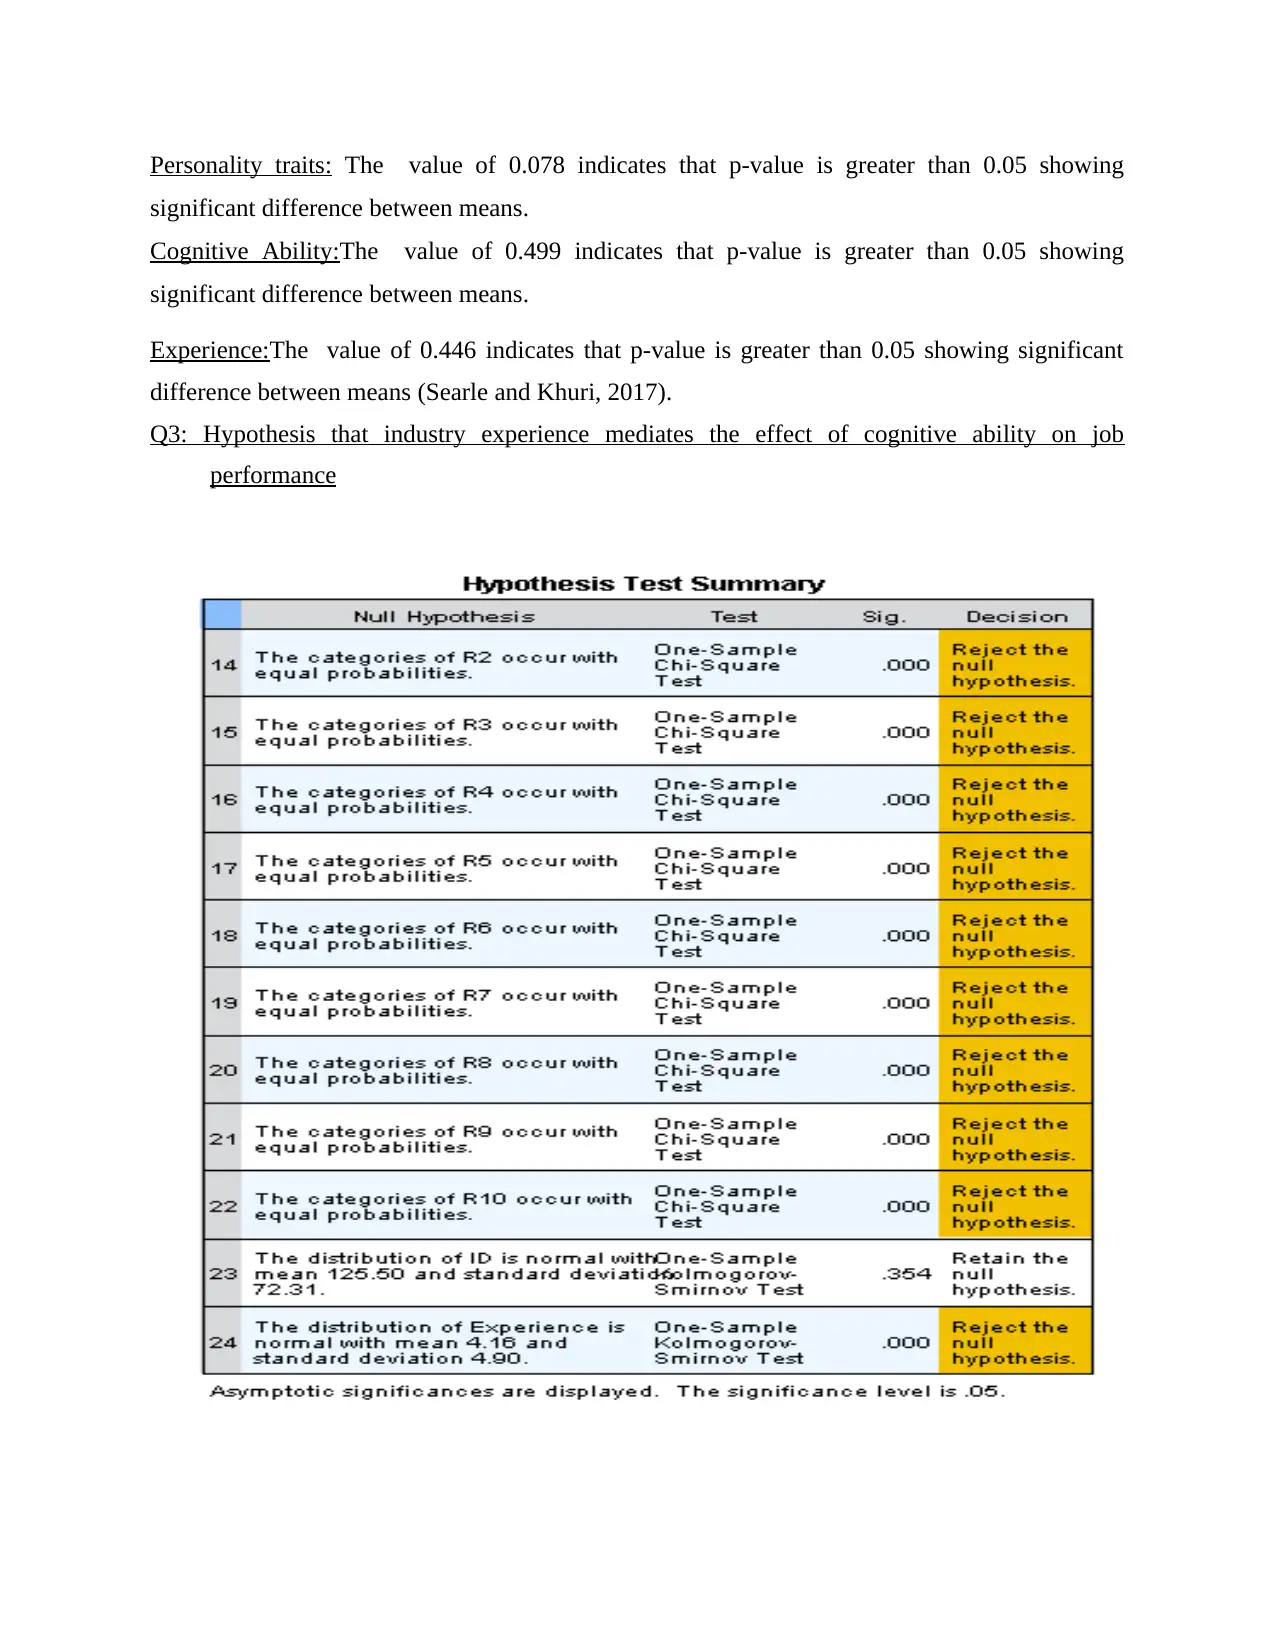
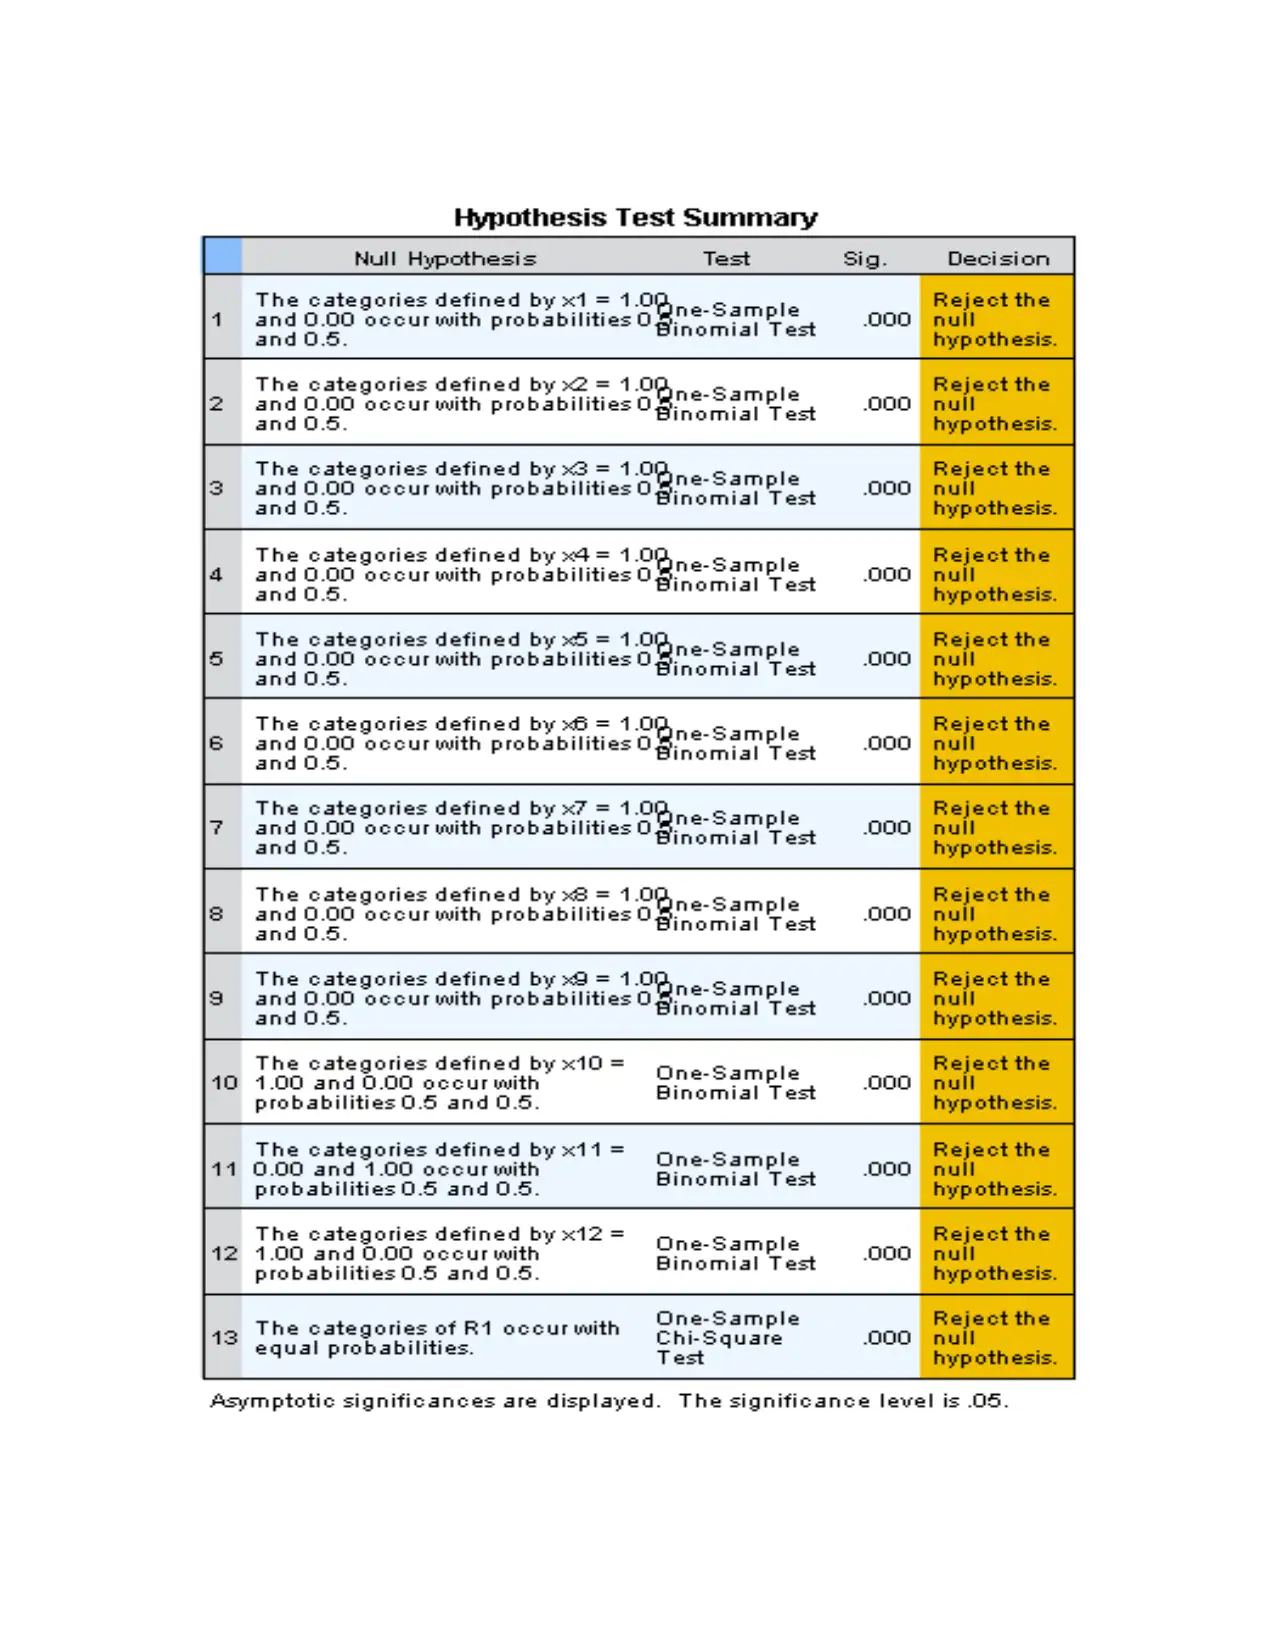
Q3: Hypothesis that industry experience mediates the effect of cognitive ability on job
performance
significant difference between means.
Cognitive Ability:The value of 0.499 indicates that p-value is greater than 0.05 showing
significant difference between means.
Experience:The value of 0.446 indicates that p-value is greater than 0.05 showing significant
difference between means (Searle and Khuri, 2017).
Q3: Hypothesis that industry experience mediates the effect of cognitive ability on job
performance
⊘ This is a preview!⊘
Do you want full access?
Subscribe today to unlock all pages.
Trusted by 1+ million students worldwide
Paraphrase This Document
Need a fresh take? Get an instant paraphrase of this document with our AI Paraphraser
Q4: Other factors, aside from statistical support in the regression model
One way ANOVA test calculates significant values for factors, apart from statistical
support in the regression model that are needed to make a compelling case for mediation. The
factors having p-values more than 0.05 we cannot conclude significant difference exists. The
factors with p-value less than 0.05 rejects null hypothesis taken for the research.
Q5: Hypothesis that industry experience moderates the effect of cognitive ability on job
performance
Under question 3, it has been derived that the research undertaken is taken on the
basis of correct assumptions rejecting the null hypothesis and accepting the hypothesis taken by
the research to collect the data.
REFERENCES
Books and journals
DeSantis, C.E. And et. Al, 2014. Cancer treatment and survivorship statistics, 2014. CA: a
cancer journal for clinicians. 64(4). pp.252-271.
Triola, M. F., 2013. Elementary statistics using Excel. Pearson.
DeSantis, C., Ma, J., Bryan, L. and Jemal, A., 2014. Breast cancer statistics, 2013. CA: a cancer
journal for clinicians. 64(1). pp.52-62.
Blackwell, D. L., Lucas, J. W. and Clarke, T. C., 2014. Summary health statistics for US adults:
national health interview survey, 2012. Vital and health statistics. Series 10, Data from
the National Health Survey, (260), pp.1-161.
Searle, S. R. and Khuri, A. I., 2017. Matrix algebra useful for statistics. John Wiley & Sons.
⊘ This is a preview!⊘
Do you want full access?
Subscribe today to unlock all pages.
Trusted by 1+ million students worldwide
APPENDIX
Big five personality traits:
(a): Big
five
traits
a1 a2 a3 a4 a5 c1 c
2
c3 c4 c5 e1 e2 e3 e4 e5 n1 n2 n3 n4 n5 o1 o2 o3 o4 o
4
Co
rre
lati
on
a1 1.0
00
-.0
92
-.2
87
.18
5
.12
0
.22
4
.00
5
.07
7
.14
8
.11
9
.04
3
.21
9
-.0
93
.14
0
.18
9
-.0
22
.14
5
-.1
47
.11
3
-.0
55
.08
4
-.0
37
.05
5
.09
2
-.0
77
a2 -.0
92
1.0
00
.31
5
-.2
81
-.0
58
-.07
2
-.0
75
-.0
43
.00
3
.00
2
.10
9
-.1
64
.02
9
-.0
54
.10
0
.19
4
-.1
43
.08
8
-.1
70
.18
7
.05
7
-.0
16
-.1
17
.22
0
-.0
66
a3 -.2
87
.31
5
1.0
00
-.1
88
-.0
24
-.18
2
-.1
49
-.0
61
-.0
05
-.1
07
.00
8
-.2
94
.04
0
-.0
25
-.0
23
.12
5
-.1
35
.05
3
-.1
78
.05
9
-.0
49
.06
9
-.1
12
.13
7
-.0
30
a4 .18
5
-.2
81
-.1
88
1.0
00
.11
2
.06
6
-.0
33
-.0
43
.04
6
.11
9
-.0
79
.17
6
-.0
83
.03
2
-.0
06
-.2
70
.21
5
-.1
03
.17
0
-.0
67
.03
6
-.0
30
-.0
44
-.1
69
-.0
70
a5 .12
0
-.0
58
-.0
24
.11
2
1.0
00
.14
9
.01
2
.07
7
.16
3
.06
7
-.2
02
.19
6
-.1
98
.23
9
.20
2
-.1
64
.23
3
-.1
54
.19
3
-.1
70
.23
0
-.0
87
-.2
31
.19
3
-.1
97
c1 .22
4
-.0
72
-.1
82
.06
6
.14
9
1.0
00
.26
7
.22
5
.18
1
.16
9
-.1
33
.25
0
-.1
53
.27
4
.25
4
-.1
95
.28
0
-.3
56
.37
0
-.1
80
.08
9
-.0
63
-.1
17
.00
2
-.1
81
c2 .00
5
-.0
75
-.1
49
-.0
33
.01
2
.26
7
1.0
00
.28
8
.22
1
.16
4
-.1
75
.12
5
-.1
14
.10
7
.19
3
-.1
08
-.0
14
-.0
64
.08
8
-.0
43
.18
6
-.0
90
-.0
74
-.0
66
-.0
59
c3 .07
7
-.0
43
-.0
61
-.0
43
.07
7
.22
5
.28
8
1.0
00
.18
4
.02
7
-.1
37
.18
6
-.1
66
.26
7
.19
6
-.0
68
.18
2
-.1
33
.04
6
-.1
16
.07
8
-.1
14
-.0
98
.05
5
-.1
31
c4 .14
8
.00
3
-.0
05
.04
6
.16
3
.18
1
.22
1
.18
4
1.0
00
.50
8
-.1
29
.08
7
-.1
61
.10
4
.15
9
-.1
02
.04
6
.00
3
.06
3
-.0
27
.06
4
-.0
22
-.1
43
.05
6
.00
8
c5 .11
9
.00
2
-.1
07
.11
9
.06
7
.16
9
.16
4
.02
7
.50
8
1.0
00
.02
8
.03
1
-.0
51
.03
8
-.0
05
-.1
03
.02
9
-.0
87
.10
9
.07
0
.06
7
-.0
05
-.0
26
.07
1
.00
5
e1 .04
3
.10
9
.00
8
-.0
79
-.2
02
-.13
3
-.1
75
-.1
37
-.1
29
.02
8
1.0
00
-.2
95
.31
9
-.4
09
-.3
36
.19
8
-.2
10
.20
4
-.2
32
.20
6
-.2
20
.11
8
.34
5
-.1
48
.15
2
e2 .21
9
-.1
64
-.2
94
.17
6
.19
6
.25
0
.12
5
.18
6
.08
7
.03
1
-.2
95
1.0
00
-.2
56
.29
5
.20
9
-.2
20
.31
5
-.3
71
.30
5
-.3
10
.17
8
-.1
42
-.1
05
.09
3
-.1
92
e3 -.0
93
.02
9
.04
0
-.0
83
-.1
98
-.15
3
-.1
14
-.1
66
-.1
61
-.0
51
.31
9
-.2
56
1.0
00
-.4
51
-.3
32
.10
7
-.1
42
.13
6
-.1
43
.15
6
-.1
51
.12
0
.31
5
-.1
32
.16
3
e4 .14
0
-.0
54
-.0
25
.03
2
.23
9
.27
4
.10
7
.26
7
.10
4
.03
8
-.4
09
.29
5
-.4
51
1.0
00
.36
5
-.1
31
.28
6
-.2
54
.23
3
-.1
82
.11
9
-.1
37
-.2
25
.20
5
-.2
32
e5 .18
9
.10
0
-.0
23
-.0
06
.20
2
.25
4
.19
3
.19
6
.15
9
-.0
05
-.3
36
.20
9
-.3
32
.36
5
1.0
00
-.1
35
.17
4
-.2
41
.08
9
-.1
78
.18
1
-.3
00
-.2
71
.24
5
-.3
28
Paraphrase This Document
Need a fresh take? Get an instant paraphrase of this document with our AI Paraphraser
n1 -.0
22
.19
4
.12
5
-.2
70
-.1
64
-.19
5
-.1
08
-.0
68
-.1
02
-.1
03
.19
8
-.2
20
.10
7
-.1
31
-.1
35
1.0
00
-.4
25
.32
3
-.3
22
.30
3
.06
2
-.0
14
.08
0
.03
7
.12
0
n2 .14
5
-.1
43
-.1
35
.21
5
.23
3
.28
0
-.0
14
.18
2
.04
6
.02
9
-.2
10
.31
5
-.1
42
.28
6
.17
4
-.4
25
1.0
00
-.4
95
.37
7
-.3
67
.05
3
-.1
31
-.0
03
.02
1
-.1
01
n3 -.1
47
.08
8
.05
3
-.1
03
-.1
54
-.35
6
-.0
64
-.1
33
.00
3
-.0
87
.20
4
-.3
71
.13
6
-.2
54
-.2
41
.32
3
-.4
95
1.0
00
-.4
44
.30
5
-.1
32
.19
2
.02
9
-.0
49
.20
8
n4 .11
3
-.1
70
-.1
78
.17
0
.19
3
.37
0
.08
8
.04
6
.06
3
.10
9
-.2
32
.30
5
-.1
43
.23
3
.08
9
-.3
22
.37
7
-.4
44
1.0
00
-.2
85
.03
3
-.0
85
-.1
08
-.0
10
-.0
83
n5 -.0
55
.18
7
.05
9
-.0
67
-.1
70
-.18
0
-.0
43
-.1
16
-.0
27
.07
0
.20
6
-.3
10
.15
6
-.1
82
-.1
78
.30
3
-.3
67
.30
5
-.2
85
1.0
00
-.0
72
.06
9
-.0
12
-.0
19
.11
9
o1 .08
4
.05
7
-.0
49
.03
6
.23
0
.08
9
.18
6
.07
8
.06
4
.06
7
-.2
20
.17
8
-.1
51
.11
9
.18
1
.06
2
.05
3
-.1
32
.03
3
-.0
72
1.0
00
-.1
90
-.1
80
.21
9
-.2
25
o2 -.0
37
-.0
16
.06
9
-.0
30
-.0
87
-.06
3
-.0
90
-.1
14
-.0
22
-.0
05
.11
8
-.1
42
.12
0
-.1
37
-.3
00
-.0
14
-.1
31
.19
2
-.0
85
.06
9
-.1
90
1.0
00
.11
3
-.1
62
.14
1
o3 .05
5
-.1
17
-.1
12
-.0
44
-.2
31
-.11
7
-.0
74
-.0
98
-.1
43
-.0
26
.34
5
-.1
05
.31
5
-.2
25
-.2
71
.08
0
-.0
03
.02
9
-.1
08
-.0
12
-.1
80
.11
3
1.0
00
-.1
68
.27
6
o4 .09
2
.22
0
.13
7
-.1
69
.19
3
.00
2
-.0
66
.05
5
.05
6
.07
1
-.1
48
.09
3
-.1
32
.20
5
.24
5
.03
7
.02
1
-.0
49
-.0
10
-.0
19
.21
9
-.1
62
-.1
68
1.0
00
-.2
26
o4 -.0
77
-.0
66
-.0
30
-.0
70
-.1
97
-.18
1
-.0
59
-.1
31
.00
8
.00
5
.15
2
-.1
92
.16
3
-.2
32
-.3
28
.12
0
-.1
01
.20
8
-.0
83
.11
9
-.2
25
.14
1
.27
6
-.2
26
1.0
00
Total
Variance
Explained
22
.19
4
.12
5
-.2
70
-.1
64
-.19
5
-.1
08
-.0
68
-.1
02
-.1
03
.19
8
-.2
20
.10
7
-.1
31
-.1
35
1.0
00
-.4
25
.32
3
-.3
22
.30
3
.06
2
-.0
14
.08
0
.03
7
.12
0
n2 .14
5
-.1
43
-.1
35
.21
5
.23
3
.28
0
-.0
14
.18
2
.04
6
.02
9
-.2
10
.31
5
-.1
42
.28
6
.17
4
-.4
25
1.0
00
-.4
95
.37
7
-.3
67
.05
3
-.1
31
-.0
03
.02
1
-.1
01
n3 -.1
47
.08
8
.05
3
-.1
03
-.1
54
-.35
6
-.0
64
-.1
33
.00
3
-.0
87
.20
4
-.3
71
.13
6
-.2
54
-.2
41
.32
3
-.4
95
1.0
00
-.4
44
.30
5
-.1
32
.19
2
.02
9
-.0
49
.20
8
n4 .11
3
-.1
70
-.1
78
.17
0
.19
3
.37
0
.08
8
.04
6
.06
3
.10
9
-.2
32
.30
5
-.1
43
.23
3
.08
9
-.3
22
.37
7
-.4
44
1.0
00
-.2
85
.03
3
-.0
85
-.1
08
-.0
10
-.0
83
n5 -.0
55
.18
7
.05
9
-.0
67
-.1
70
-.18
0
-.0
43
-.1
16
-.0
27
.07
0
.20
6
-.3
10
.15
6
-.1
82
-.1
78
.30
3
-.3
67
.30
5
-.2
85
1.0
00
-.0
72
.06
9
-.0
12
-.0
19
.11
9
o1 .08
4
.05
7
-.0
49
.03
6
.23
0
.08
9
.18
6
.07
8
.06
4
.06
7
-.2
20
.17
8
-.1
51
.11
9
.18
1
.06
2
.05
3
-.1
32
.03
3
-.0
72
1.0
00
-.1
90
-.1
80
.21
9
-.2
25
o2 -.0
37
-.0
16
.06
9
-.0
30
-.0
87
-.06
3
-.0
90
-.1
14
-.0
22
-.0
05
.11
8
-.1
42
.12
0
-.1
37
-.3
00
-.0
14
-.1
31
.19
2
-.0
85
.06
9
-.1
90
1.0
00
.11
3
-.1
62
.14
1
o3 .05
5
-.1
17
-.1
12
-.0
44
-.2
31
-.11
7
-.0
74
-.0
98
-.1
43
-.0
26
.34
5
-.1
05
.31
5
-.2
25
-.2
71
.08
0
-.0
03
.02
9
-.1
08
-.0
12
-.1
80
.11
3
1.0
00
-.1
68
.27
6
o4 .09
2
.22
0
.13
7
-.1
69
.19
3
.00
2
-.0
66
.05
5
.05
6
.07
1
-.1
48
.09
3
-.1
32
.20
5
.24
5
.03
7
.02
1
-.0
49
-.0
10
-.0
19
.21
9
-.1
62
-.1
68
1.0
00
-.2
26
o4 -.0
77
-.0
66
-.0
30
-.0
70
-.1
97
-.18
1
-.0
59
-.1
31
.00
8
.00
5
.15
2
-.1
92
.16
3
-.2
32
-.3
28
.12
0
-.1
01
.20
8
-.0
83
.11
9
-.2
25
.14
1
.27
6
-.2
26
1.0
00
Total
Variance
Explained
Componen
t
Initial Eigenvalues Extraction Sums of Squared Loadings R
o
t
a
t
i
o
n
S
u
m
s
o
f
S
q
u
a
r
e
d
L
o
a
d
i
n
g
s
Total % of
Variance
Cumulative
%
Total % of
Variance
Cumulative
%
Total % of
Variance
Cumulative
%
1 4.626 18.505 18.505 4.626 18.505 18.505 3.002 12.009 12.009
2 2.351 9.404 27.908 2.351 9.404 27.908 2.508 10.030 22.040
3 1.727 6.907 34.815 1.727 6.907 34.815 1.808 7.231 29.271
4 1.333 5.334 40.149 1.333 5.334 40.149 1.770 7.082 36.353
5 1.307 5.227 45.376 1.307 5.227 45.376 1.689 6.756 43.109
6 1.280 5.118 50.494 1.280 5.118 50.494 1.510 6.042 49.151
t
Initial Eigenvalues Extraction Sums of Squared Loadings R
o
t
a
t
i
o
n
S
u
m
s
o
f
S
q
u
a
r
e
d
L
o
a
d
i
n
g
s
Total % of
Variance
Cumulative
%
Total % of
Variance
Cumulative
%
Total % of
Variance
Cumulative
%
1 4.626 18.505 18.505 4.626 18.505 18.505 3.002 12.009 12.009
2 2.351 9.404 27.908 2.351 9.404 27.908 2.508 10.030 22.040
3 1.727 6.907 34.815 1.727 6.907 34.815 1.808 7.231 29.271
4 1.333 5.334 40.149 1.333 5.334 40.149 1.770 7.082 36.353
5 1.307 5.227 45.376 1.307 5.227 45.376 1.689 6.756 43.109
6 1.280 5.118 50.494 1.280 5.118 50.494 1.510 6.042 49.151
⊘ This is a preview!⊘
Do you want full access?
Subscribe today to unlock all pages.
Trusted by 1+ million students worldwide
1 out of 44


Your All-in-One AI-Powered Toolkit for Academic Success.
+13062052269
info@desklib.com
Available 24*7 on WhatsApp / Email
![[object Object]](/_next/static/media/star-bottom.7253800d.svg)
Unlock your academic potential
Copyright © 2020–2026 A2Z Services. All Rights Reserved. Developed and managed by ZUCOL.