COIT20248 - Hospital Management System: Analysis and Design Project
VerifiedAdded on 2023/03/31
|20
|3117
|271
Project
AI Summary
This project report details the system analysis and design of a Hospital Management System (HMS). It covers critical use cases such as registration/login, appointment scheduling, payment processing, and appointment briefing. The report includes a context-level diagram and a Level 0 Data Flow Diagram (DFD) to illustrate data flow and system processes. An Entity Relationship Diagram (ERD) outlines the database structure, including entities like Patient, Appointment, Doctor, Qualification, and Payment, along with their attributes and relationships. A CRUD diagram is presented. Furthermore, the project includes a prototype diagram showcasing the user interface for patient appointment booking and an architecture diagram providing a high-level representation of the system's deployment environment. The report concludes with details of individual group member contributions and a summary of the project's benefits.

Running head: HOSPITAL MANAGEMENT SYSTEM DESIGN
Hospital Management System Design
Name of the Student
Name of the University
Author’s note:
Hospital Management System Design
Name of the Student
Name of the University
Author’s note:
Paraphrase This Document
Need a fresh take? Get an instant paraphrase of this document with our AI Paraphraser
1HOSPITAL MANAGEMENT SYSTEM DESIGN
Table of Contents
Introduction:....................................................................................................................................2
Critical Use Cases:...........................................................................................................................2
Context Level Diagram:..................................................................................................................3
Level 0 DFD:...................................................................................................................................5
Draw ERD:......................................................................................................................................8
CRUD Diagram:............................................................................................................................10
Prototype and Architecture Diagram:............................................................................................11
Details of Individual Group Members:..........................................................................................15
Conclusion:....................................................................................................................................15
Bibliography:.................................................................................................................................17

2HOSPITAL MANAGEMENT SYSTEM DESIGN
Introduction:
The information system is defined as the application which assists in handling and
evaluating data. The information system has database that is used for recording data. The system
can retrieve data from the database for completing various user requests or process it for
generating information. The information system is developed with the purpose of converting raw
data into essential information and knowledge that can assist the user and management take
various decisions. Different types of information system are available such as executive
information system, management information system, decision support system and transaction
processing system. The hospital management system is a management information system that is
deployed in a hospital’s environment. Information systems depends on the users and various
input devices to get data from real world. The systems also integrate user management which
serves as the basis of authentication and authorization.
The report consists of the system analysis and design of driver assistance application.
This report will represent the critical use case of the application. These critical use cases are the
core interaction of the application. The context level diagram will provide the basic foundation
of the system. The idea behind the context level diagram will be elaborated in the level 0
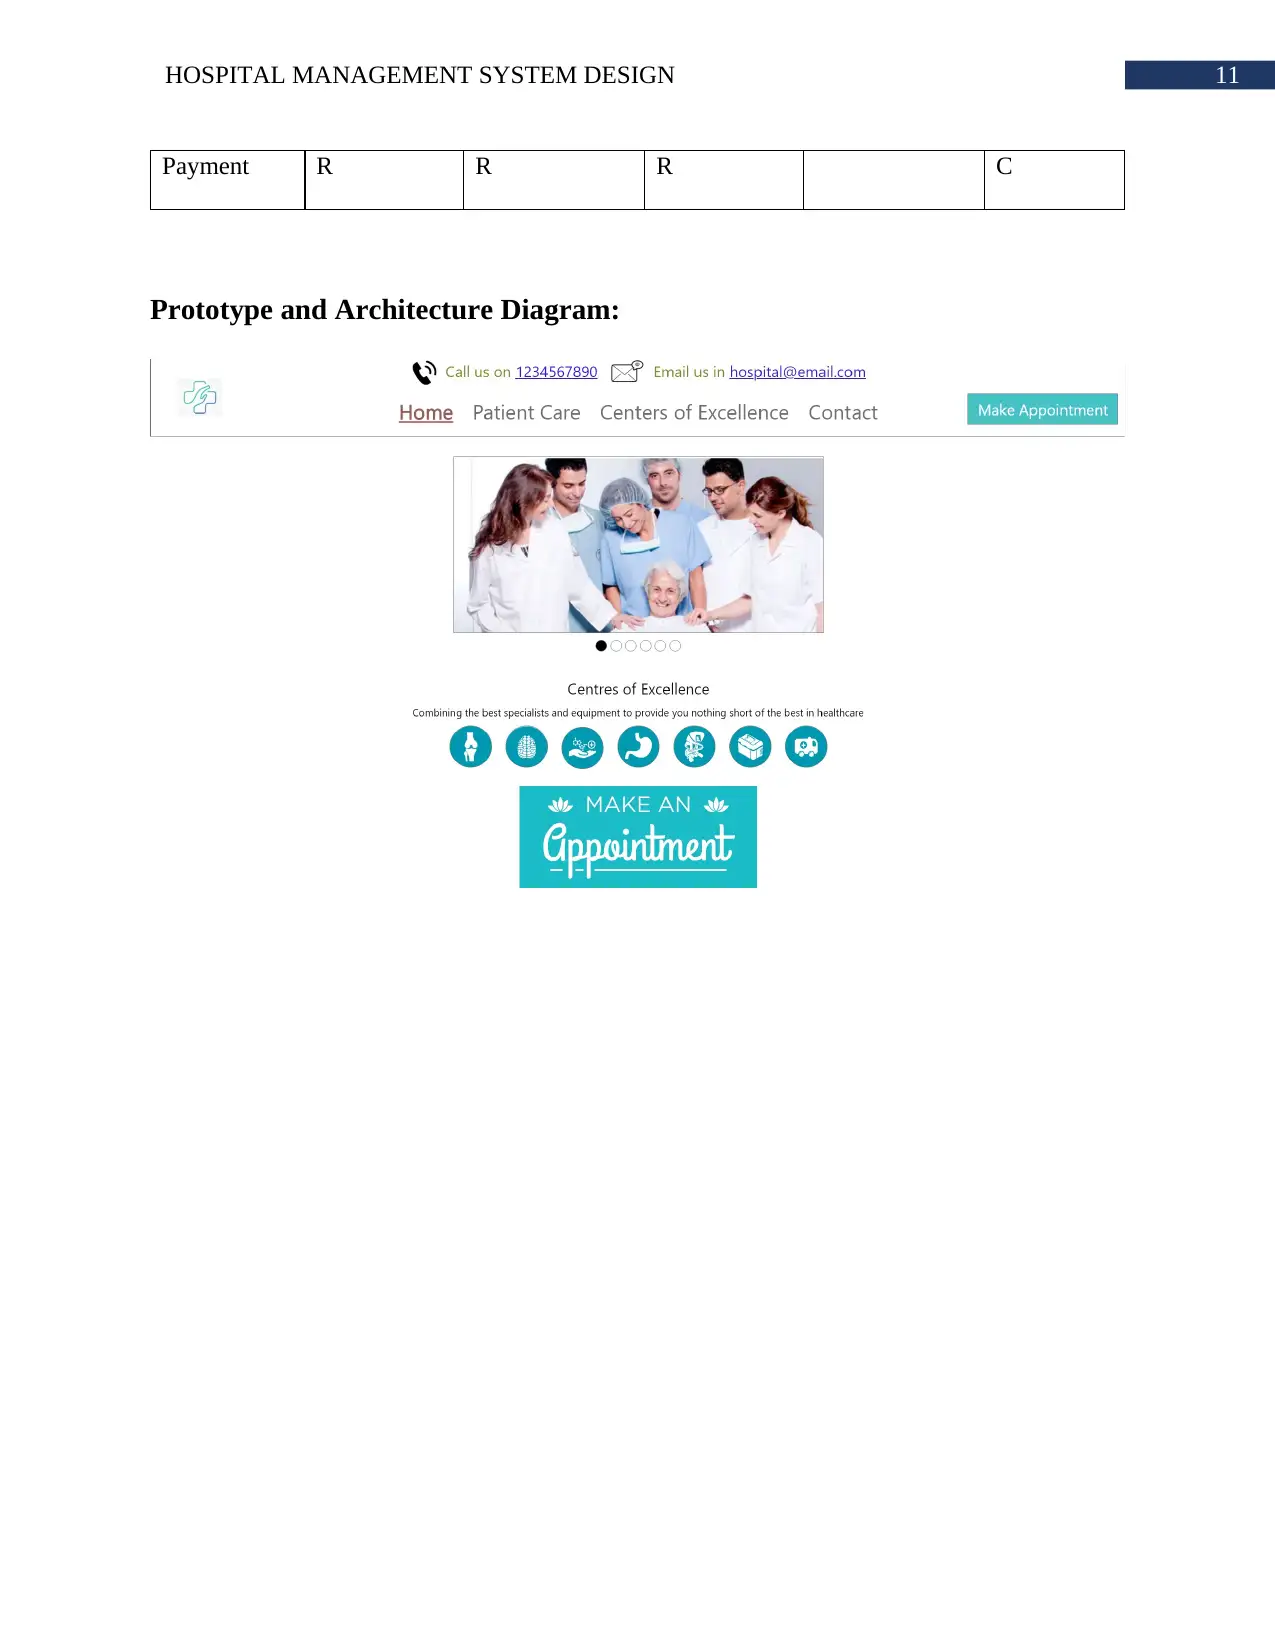
diagram. The ERD will show the database structure. A prototype diagram will be implemented to
show the user interface of application which the patient will be using to book appointment. The
architecture of the application will provide a high level representation of the system. The
environment of deployment will also be shared through the architecture.
Critical Use Cases:
The critical use cases of the Hospital Management System are as following.
Introduction:
The information system is defined as the application which assists in handling and
evaluating data. The information system has database that is used for recording data. The system
can retrieve data from the database for completing various user requests or process it for
generating information. The information system is developed with the purpose of converting raw
data into essential information and knowledge that can assist the user and management take
various decisions. Different types of information system are available such as executive
information system, management information system, decision support system and transaction
processing system. The hospital management system is a management information system that is
deployed in a hospital’s environment. Information systems depends on the users and various
input devices to get data from real world. The systems also integrate user management which
serves as the basis of authentication and authorization.
The report consists of the system analysis and design of driver assistance application.
This report will represent the critical use case of the application. These critical use cases are the
core interaction of the application. The context level diagram will provide the basic foundation
of the system. The idea behind the context level diagram will be elaborated in the level 0
diagram. The ERD will show the database structure. A prototype diagram will be implemented to
show the user interface of application which the patient will be using to book appointment. The
architecture of the application will provide a high level representation of the system. The
environment of deployment will also be shared through the architecture.
Critical Use Cases:
The critical use cases of the Hospital Management System are as following.
⊘ This is a preview!⊘
Do you want full access?
Subscribe today to unlock all pages.
Trusted by 1+ million students worldwide
3HOSPITAL MANAGEMENT SYSTEM DESIGN
i. Registration/Login: Each user will be registered into the system. The system will
not allow any non-authenticated user. The registration will have two categories
such as staff and customer registration. The customer will use the application to
submit the registration form. The same email and password used in the
registration will be used for login.
ii. Schedule Appointment: The patient can schedule appointment. The patient will
use the system to submit the appointment form. The patient will provide email,
date of appointment along with time, preferred doctor and details of illness. The
system will store the request and update the information in system.
iii. Payment: The patient will make payment for the treatment they got from the
hospital. Based on the illness, the system will categorize the appointment. Based
on specialization of doctor, the system will apply charge to the appointment. The
patient can pay the charge through digital wallet or card.
iv. Appointment Briefing: After the appointment is over, the doctor will update the
actual illness of patient, given medicines and other treatment related information.
To do this, the doctor will get an interface terminal.
Context Level Diagram:
Data flow diagram (DFD) represents the flow of data or process in an information
system. This is a simplified graphical representation of the system that provides a detailed
structure of the system and the data flows from the entities and the processes used. The data flow
diagram does not contain any loops or decision rules. There are basic symbols that are used to
represent the data flows, processes and the sources. Basic symbol to represent a process is a
Paraphrase This Document
Need a fresh take? Get an instant paraphrase of this document with our AI Paraphraser
4HOSPITAL MANAGEMENT SYSTEM DESIGN
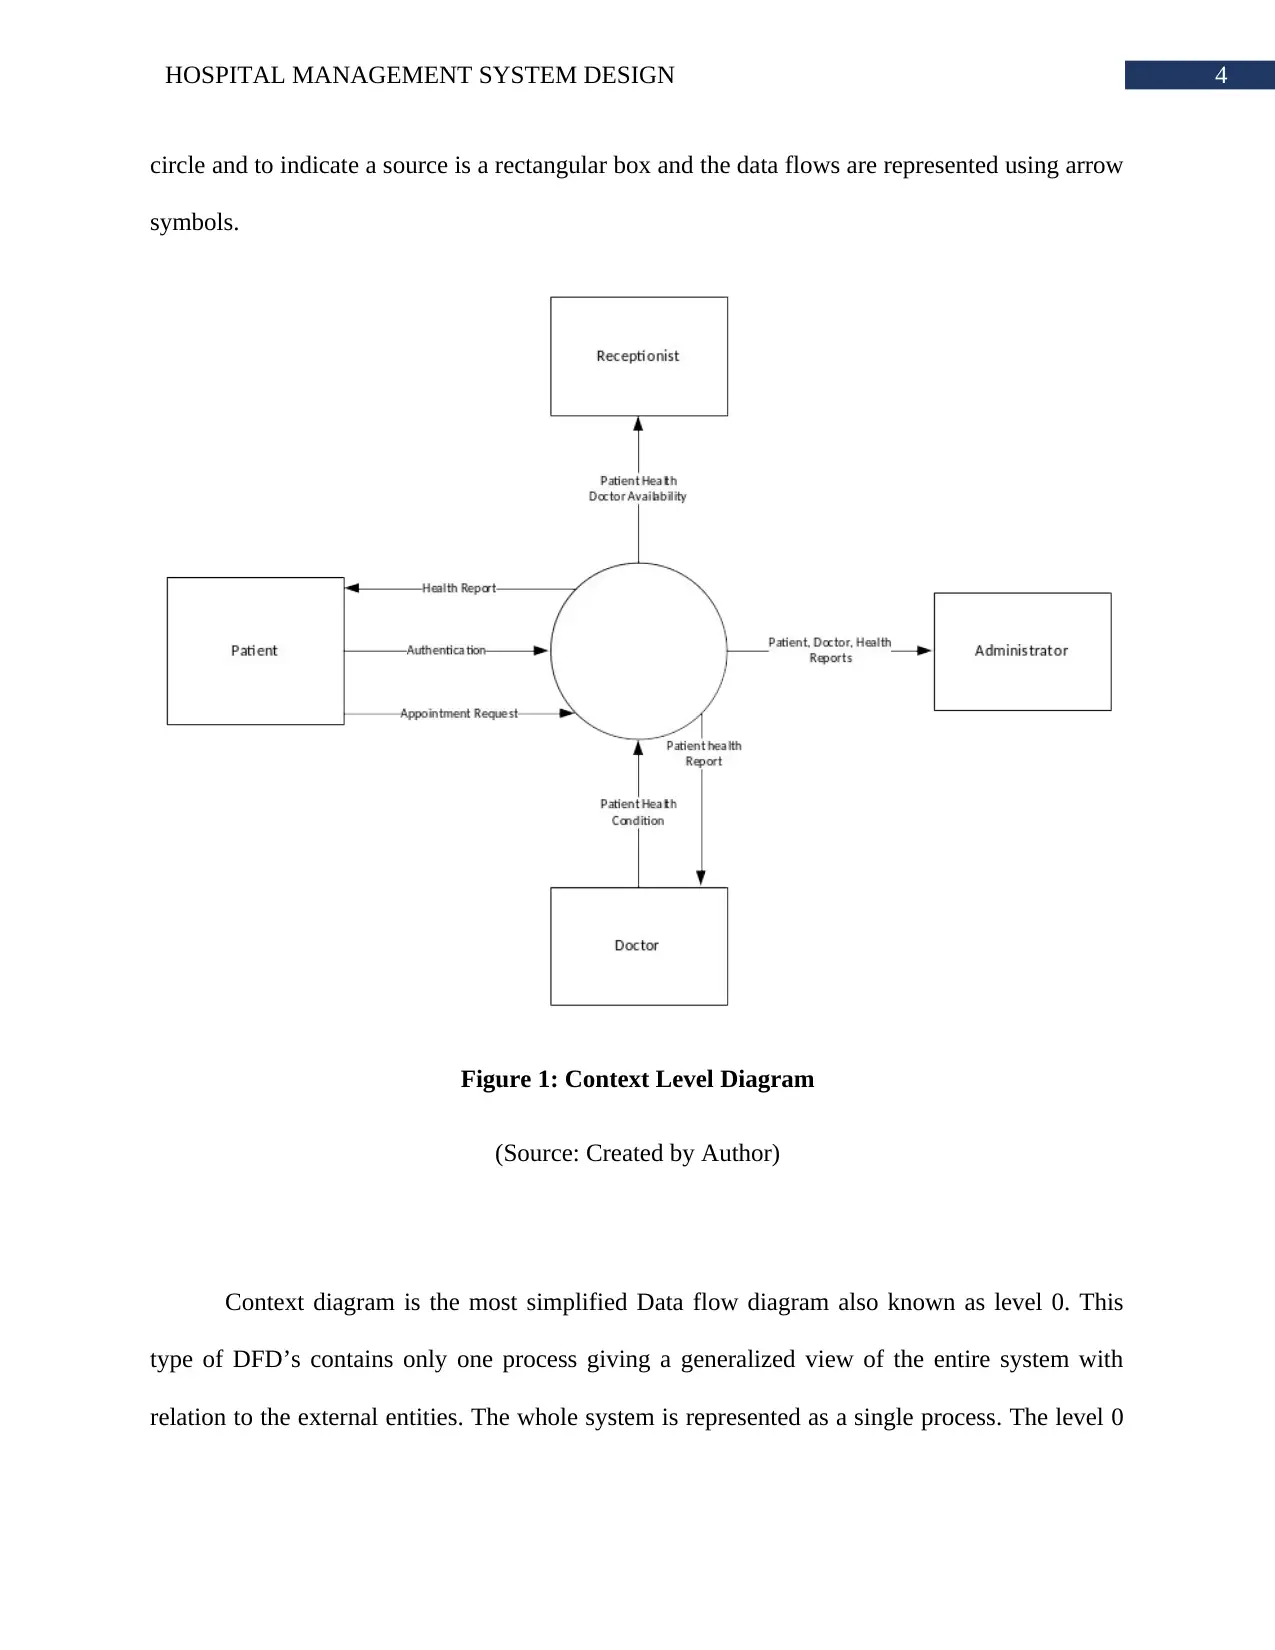
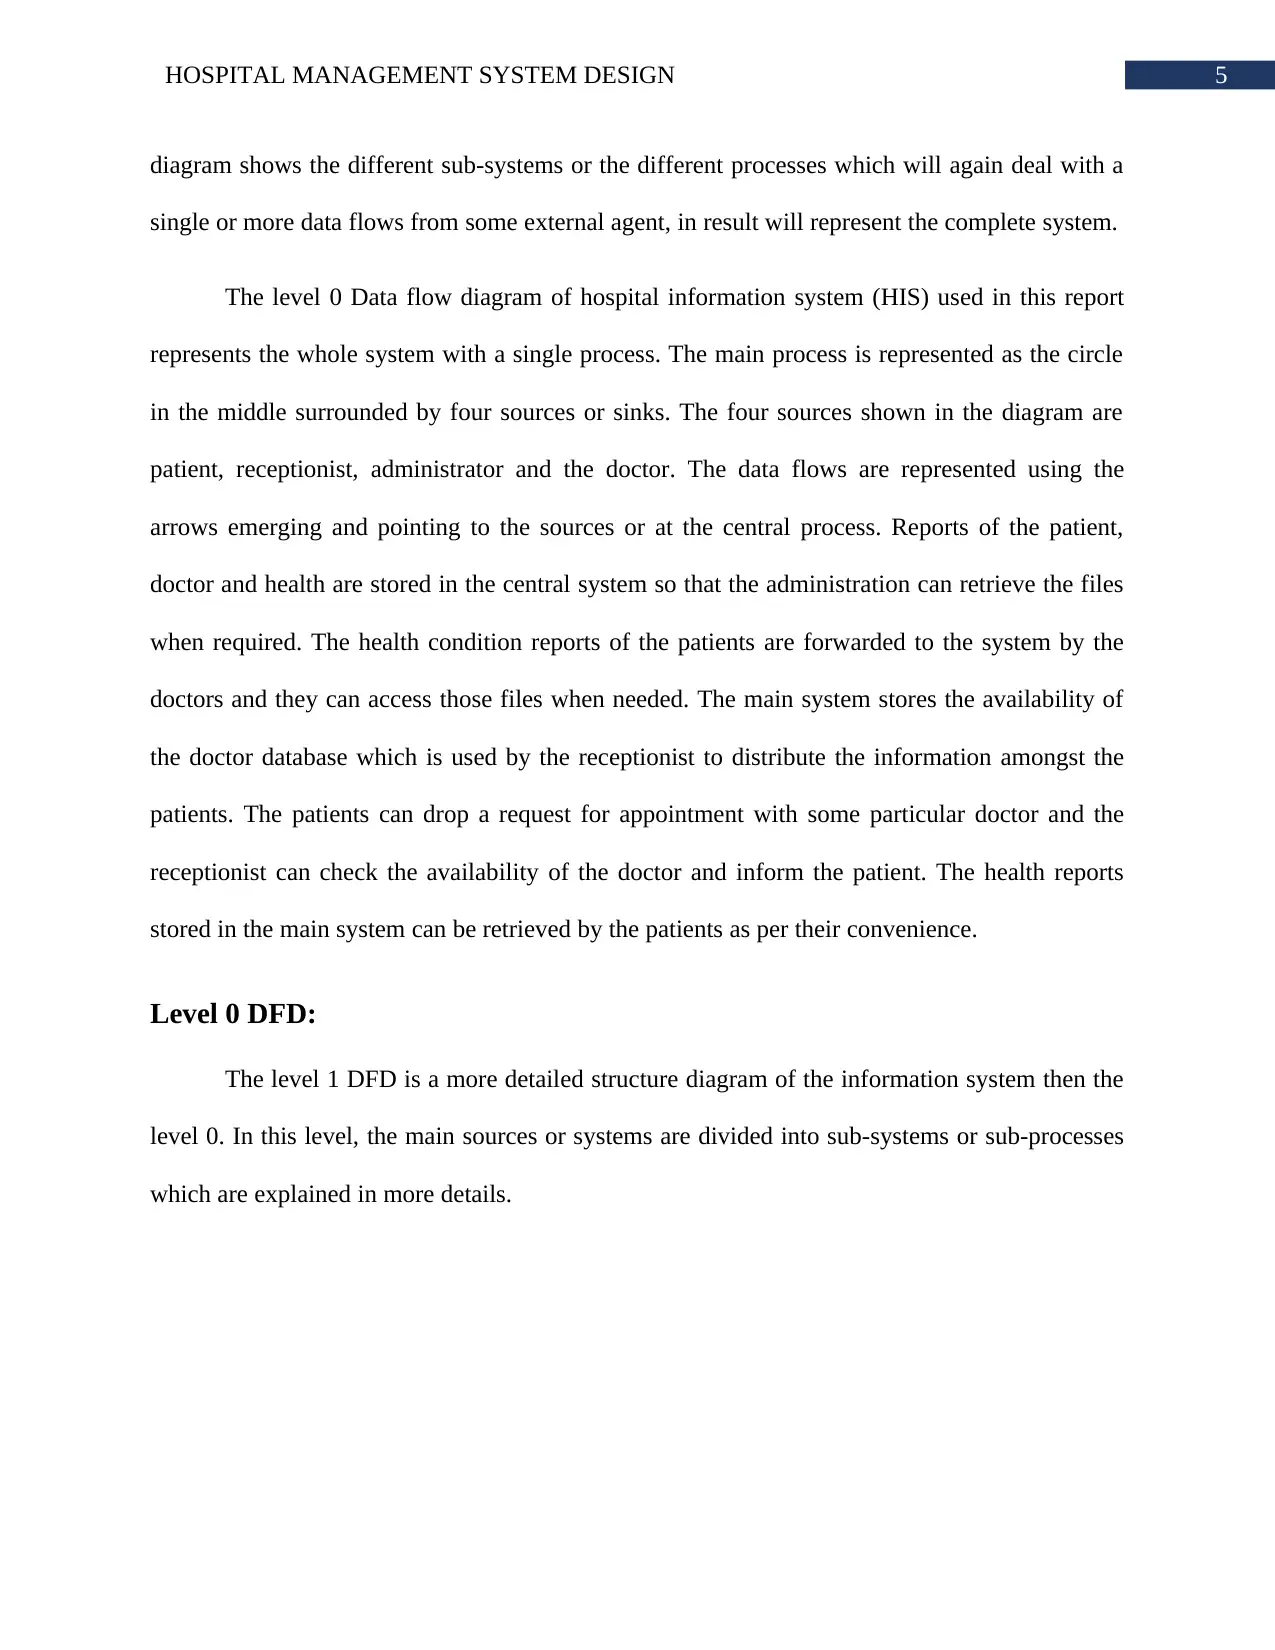
circle and to indicate a source is a rectangular box and the data flows are represented using arrow
symbols.
Figure 1: Context Level Diagram
(Source: Created by Author)
Context diagram is the most simplified Data flow diagram also known as level 0. This
type of DFD’s contains only one process giving a generalized view of the entire system with
relation to the external entities. The whole system is represented as a single process. The level 0
5HOSPITAL MANAGEMENT SYSTEM DESIGN
diagram shows the different sub-systems or the different processes which will again deal with a
single or more data flows from some external agent, in result will represent the complete system.
The level 0 Data flow diagram of hospital information system (HIS) used in this report
represents the whole system with a single process. The main process is represented as the circle
in the middle surrounded by four sources or sinks. The four sources shown in the diagram are
patient, receptionist, administrator and the doctor. The data flows are represented using the
arrows emerging and pointing to the sources or at the central process. Reports of the patient,
doctor and health are stored in the central system so that the administration can retrieve the files
when required. The health condition reports of the patients are forwarded to the system by the
doctors and they can access those files when needed. The main system stores the availability of
the doctor database which is used by the receptionist to distribute the information amongst the
patients. The patients can drop a request for appointment with some particular doctor and the
receptionist can check the availability of the doctor and inform the patient. The health reports
stored in the main system can be retrieved by the patients as per their convenience.
Level 0 DFD:
The level 1 DFD is a more detailed structure diagram of the information system then the
level 0. In this level, the main sources or systems are divided into sub-systems or sub-processes
which are explained in more details.
⊘ This is a preview!⊘
Do you want full access?
Subscribe today to unlock all pages.
Trusted by 1+ million students worldwide
6HOSPITAL MANAGEMENT SYSTEM DESIGN
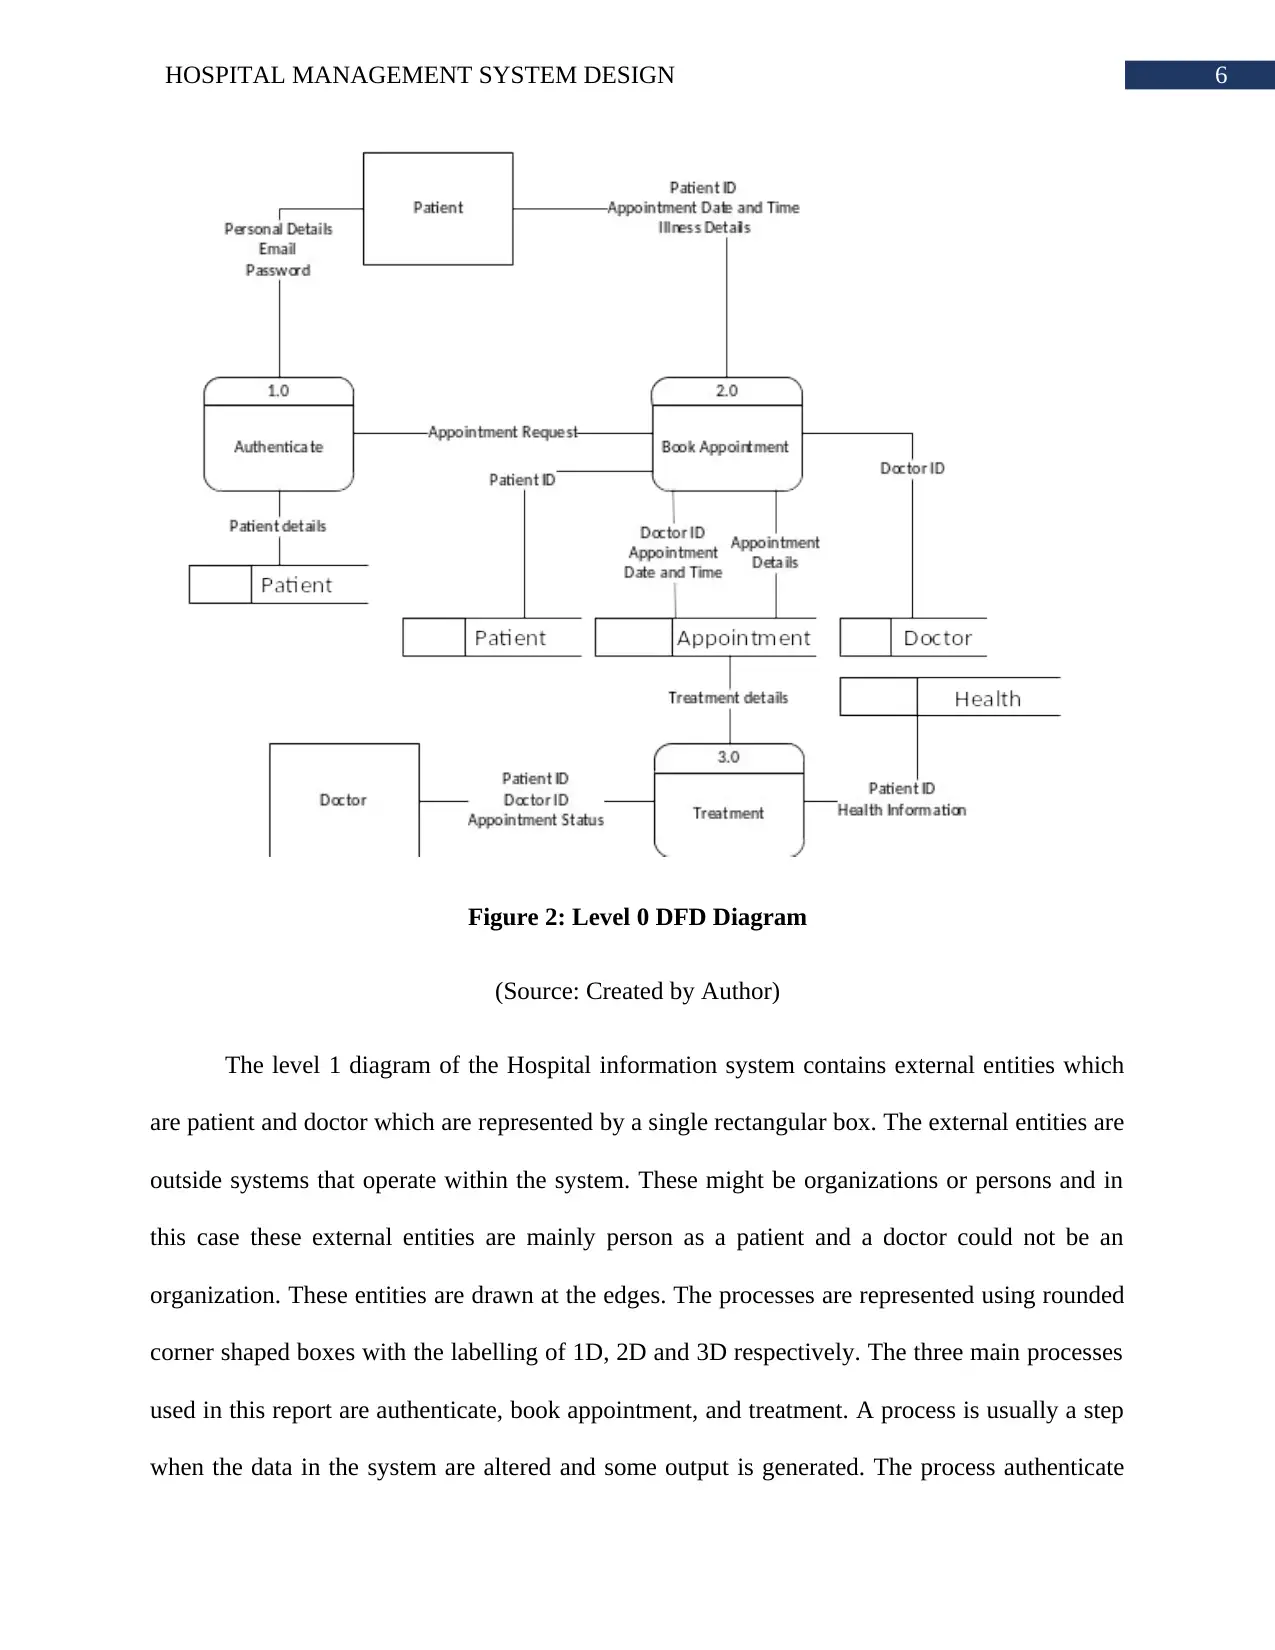
Figure 2: Level 0 DFD Diagram
(Source: Created by Author)
The level 1 diagram of the Hospital information system contains external entities which
are patient and doctor which are represented by a single rectangular box. The external entities are
outside systems that operate within the system. These might be organizations or persons and in
this case these external entities are mainly person as a patient and a doctor could not be an
organization. These entities are drawn at the edges. The processes are represented using rounded
corner shaped boxes with the labelling of 1D, 2D and 3D respectively. The three main processes
used in this report are authenticate, book appointment, and treatment. A process is usually a step
when the data in the system are altered and some output is generated. The process authenticate
Paraphrase This Document
Need a fresh take? Get an instant paraphrase of this document with our AI Paraphraser

7HOSPITAL MANAGEMENT SYSTEM DESIGN
helps a patient to authenticate their identity and log in to the hospital system by providing their
personal details like email and password. Every patient is assigned with a unique patient ID also
known as UHID (Unique health identifier) to log in to the system and check their appointment
details. Book appointment is a process to book an appointment with a doctor.
There are three data stores used in this diagram which are patient, appointment, doctor
and health. The data stores are represented using a divided rectangular box. These data stores
represent the files or information about the entities which are patient, appointment, doctor and
health stored in the hospital information system. While booking an appointment the repositories
of patient, appointment and doctor are used. The lines represents the data flows. The treatment
process uses the appointment database and health repositories. The doctor retrieves the patient
ID, Doctor ID and the appointment status using the treatment process and this data is retrieved
from the appointment directories and health data stores. After the process of authentication an
appointment request is forwarded to the book appointment process to book an appointment.
8HOSPITAL MANAGEMENT SYSTEM DESIGN
Draw ERD:
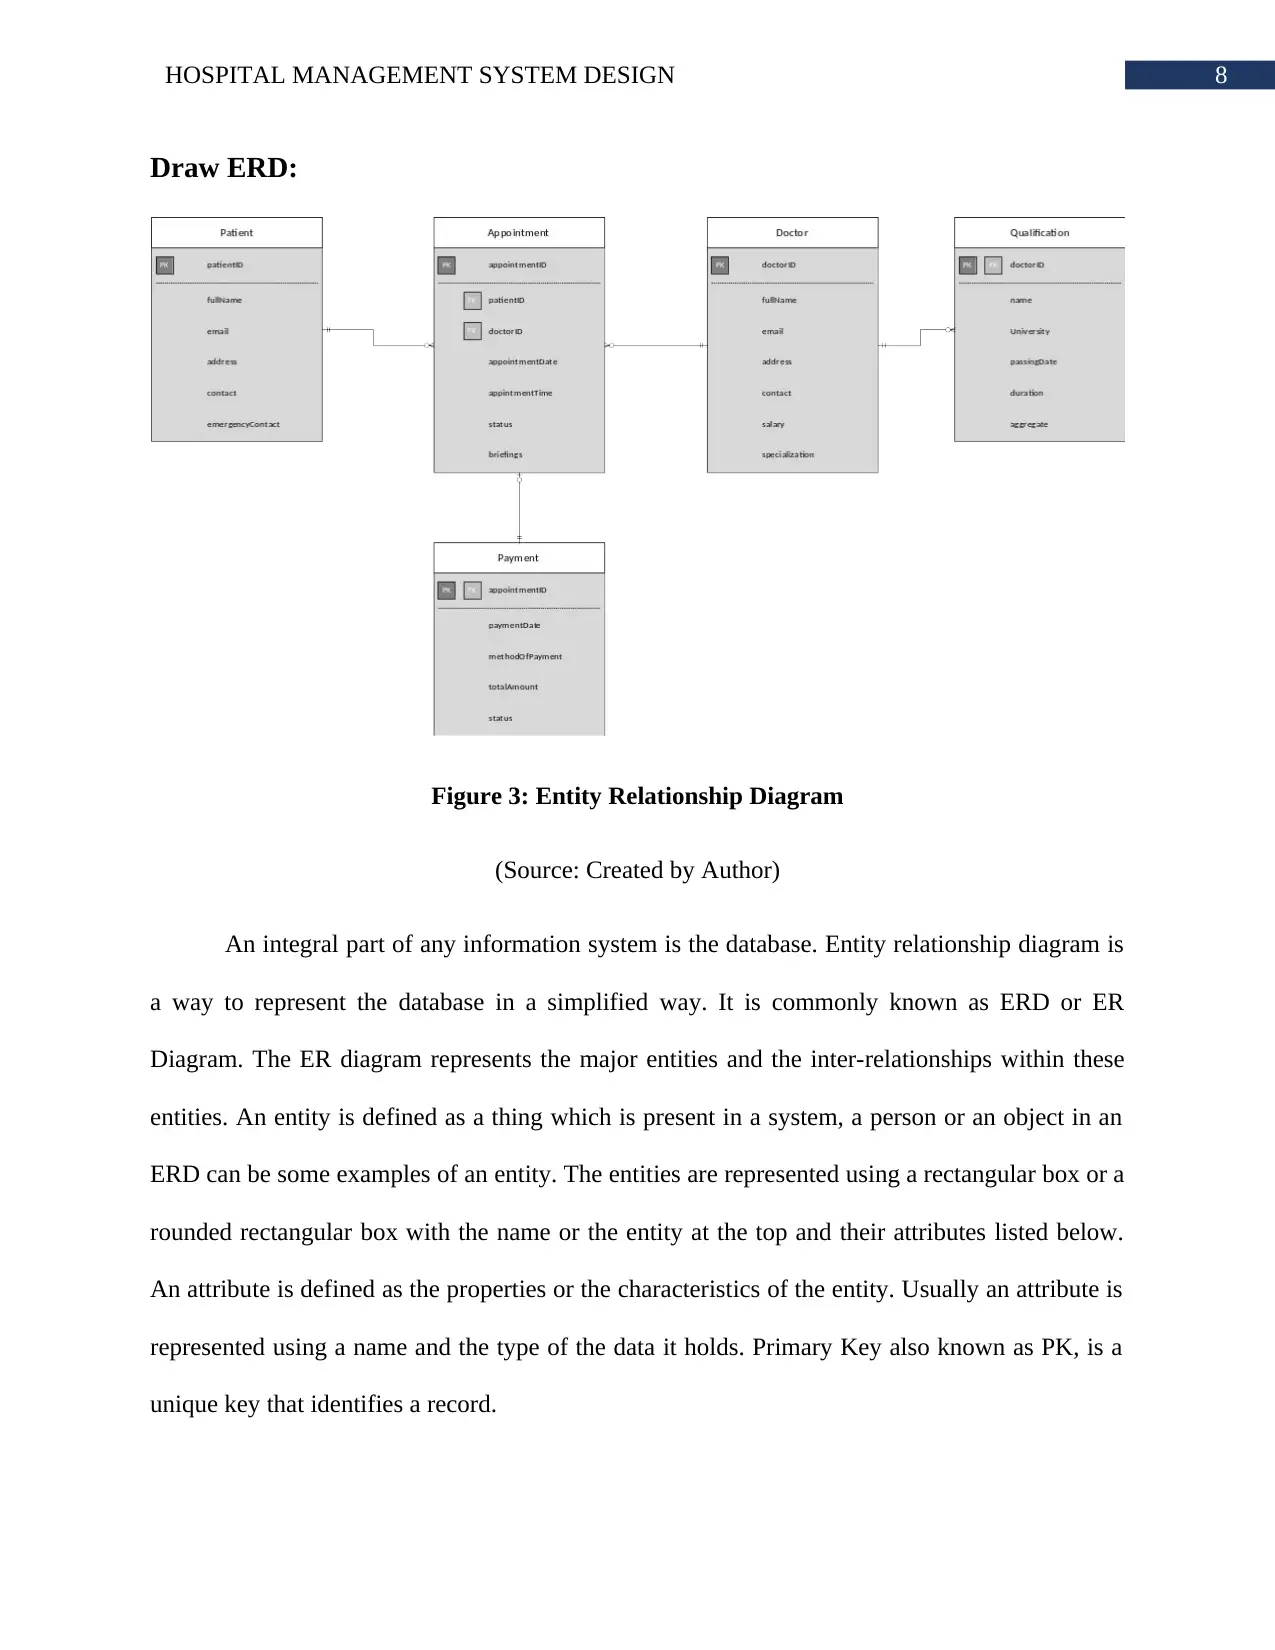
Figure 3: Entity Relationship Diagram
(Source: Created by Author)
An integral part of any information system is the database. Entity relationship diagram is
a way to represent the database in a simplified way. It is commonly known as ERD or ER
Diagram. The ER diagram represents the major entities and the inter-relationships within these
entities. An entity is defined as a thing which is present in a system, a person or an object in an
ERD can be some examples of an entity. The entities are represented using a rectangular box or a
rounded rectangular box with the name or the entity at the top and their attributes listed below.
An attribute is defined as the properties or the characteristics of the entity. Usually an attribute is
represented using a name and the type of the data it holds. Primary Key also known as PK, is a
unique key that identifies a record.
Draw ERD:
Figure 3: Entity Relationship Diagram
(Source: Created by Author)
An integral part of any information system is the database. Entity relationship diagram is
a way to represent the database in a simplified way. It is commonly known as ERD or ER
Diagram. The ER diagram represents the major entities and the inter-relationships within these
entities. An entity is defined as a thing which is present in a system, a person or an object in an
ERD can be some examples of an entity. The entities are represented using a rectangular box or a
rounded rectangular box with the name or the entity at the top and their attributes listed below.
An attribute is defined as the properties or the characteristics of the entity. Usually an attribute is
represented using a name and the type of the data it holds. Primary Key also known as PK, is a
unique key that identifies a record.
⊘ This is a preview!⊘
Do you want full access?
Subscribe today to unlock all pages.
Trusted by 1+ million students worldwide
9HOSPITAL MANAGEMENT SYSTEM DESIGN
There is only one primary key for each entry in the database. Foreign key also known as
FK, is basically used to for referencing a primary key. Foreign keys are not unique like primary
key and there can be multiple records that share the same foreign key. Relationship shows the
relationship between two entities and these relationships are shown using a connector.
Cardinality shows the occurrence of one entity which might be associated with other entities.
There are three type of cardinal relationships namely one-to-one, one-to-many and many-to-
many. Cardinality is represented by a crow’s foot symbol. One-to-one relationship is usually
used to split an entity into two parts to provide more information about that entity. One-to-many
cardinality is used to show a link between two entities.
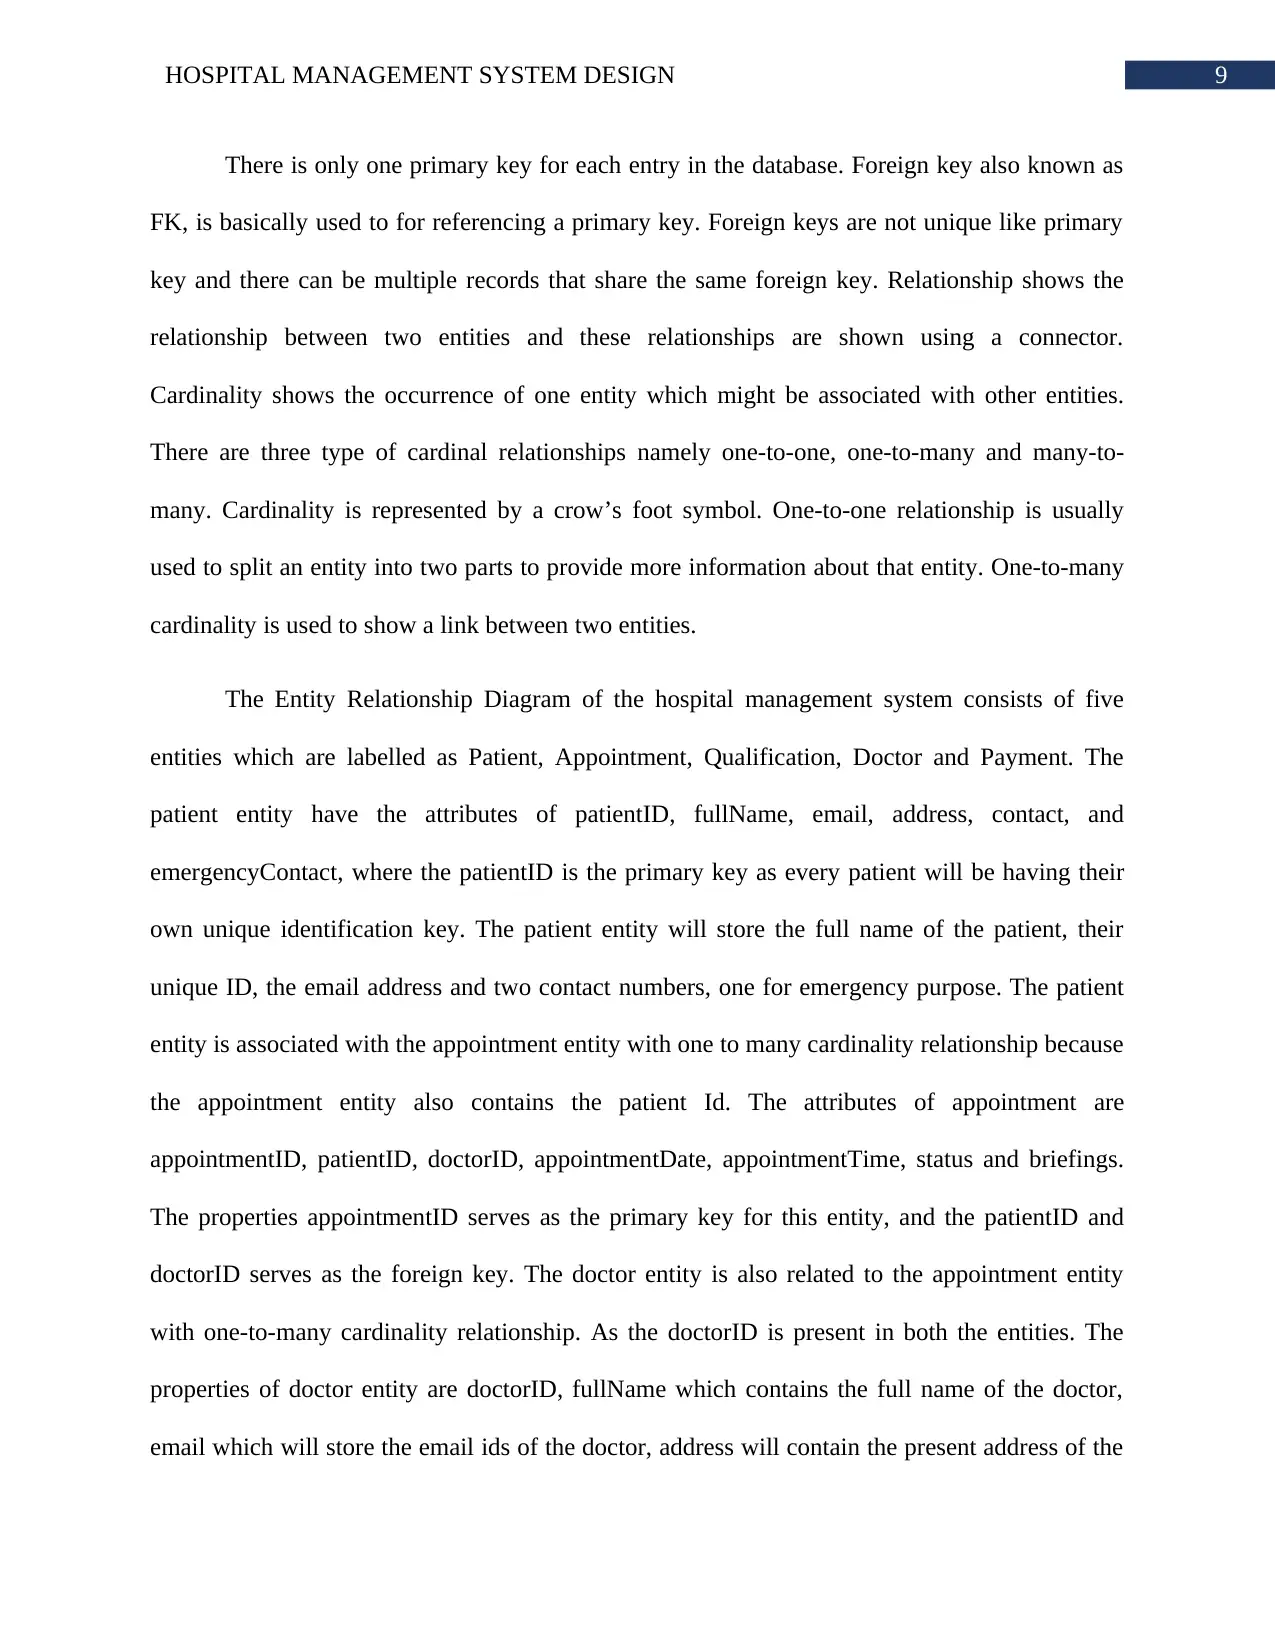
The Entity Relationship Diagram of the hospital management system consists of five
entities which are labelled as Patient, Appointment, Qualification, Doctor and Payment. The
patient entity have the attributes of patientID, fullName, email, address, contact, and
emergencyContact, where the patientID is the primary key as every patient will be having their
own unique identification key. The patient entity will store the full name of the patient, their
unique ID, the email address and two contact numbers, one for emergency purpose. The patient
entity is associated with the appointment entity with one to many cardinality relationship because
the appointment entity also contains the patient Id. The attributes of appointment are
appointmentID, patientID, doctorID, appointmentDate, appointmentTime, status and briefings.
The properties appointmentID serves as the primary key for this entity, and the patientID and
doctorID serves as the foreign key. The doctor entity is also related to the appointment entity
with one-to-many cardinality relationship. As the doctorID is present in both the entities. The
properties of doctor entity are doctorID, fullName which contains the full name of the doctor,
email which will store the email ids of the doctor, address will contain the present address of the
There is only one primary key for each entry in the database. Foreign key also known as
FK, is basically used to for referencing a primary key. Foreign keys are not unique like primary
key and there can be multiple records that share the same foreign key. Relationship shows the
relationship between two entities and these relationships are shown using a connector.
Cardinality shows the occurrence of one entity which might be associated with other entities.
There are three type of cardinal relationships namely one-to-one, one-to-many and many-to-
many. Cardinality is represented by a crow’s foot symbol. One-to-one relationship is usually
used to split an entity into two parts to provide more information about that entity. One-to-many
cardinality is used to show a link between two entities.
The Entity Relationship Diagram of the hospital management system consists of five
entities which are labelled as Patient, Appointment, Qualification, Doctor and Payment. The
patient entity have the attributes of patientID, fullName, email, address, contact, and
emergencyContact, where the patientID is the primary key as every patient will be having their
own unique identification key. The patient entity will store the full name of the patient, their
unique ID, the email address and two contact numbers, one for emergency purpose. The patient
entity is associated with the appointment entity with one to many cardinality relationship because
the appointment entity also contains the patient Id. The attributes of appointment are
appointmentID, patientID, doctorID, appointmentDate, appointmentTime, status and briefings.
The properties appointmentID serves as the primary key for this entity, and the patientID and
doctorID serves as the foreign key. The doctor entity is also related to the appointment entity
with one-to-many cardinality relationship. As the doctorID is present in both the entities. The
properties of doctor entity are doctorID, fullName which contains the full name of the doctor,
email which will store the email ids of the doctor, address will contain the present address of the
Paraphrase This Document
Need a fresh take? Get an instant paraphrase of this document with our AI Paraphraser
10HOSPITAL MANAGEMENT SYSTEM DESIGN
doctor, contact contains the contact number of the doctor and the salary and specialization
attributes will contain the salary and the specialization of the doctor respectively. The
qualification entity is again related to the doctor entity with one-to-many cardinal relation. The
qualification entity is used to store the qualification details of the doctor.
The main components of the qualification entity are doctorID which acts as the primary
key and the foreign key as well in this case, name which stores the name of the doctor,
University attribute stores the name of the university the doctor graduated from, pasingDate
stores the year of graduation of the doctor, duration contain the time for which the doctor was in
University and lastly the aggregate contains the aggregate score of the doctor. In the payment
entity the appointmentID serves both for the primary key and the foreign key and is related to the
appointment entity with one-to-many cardinal relation. The payment entity contains the
components paymentDate, methodOfPayment, totalAmount and status. The payment entity will
basically contain the details of the payment made by the patient. It will contain the details of the
date the payment was made, mode of the payment, the total amount paid and the payment status.
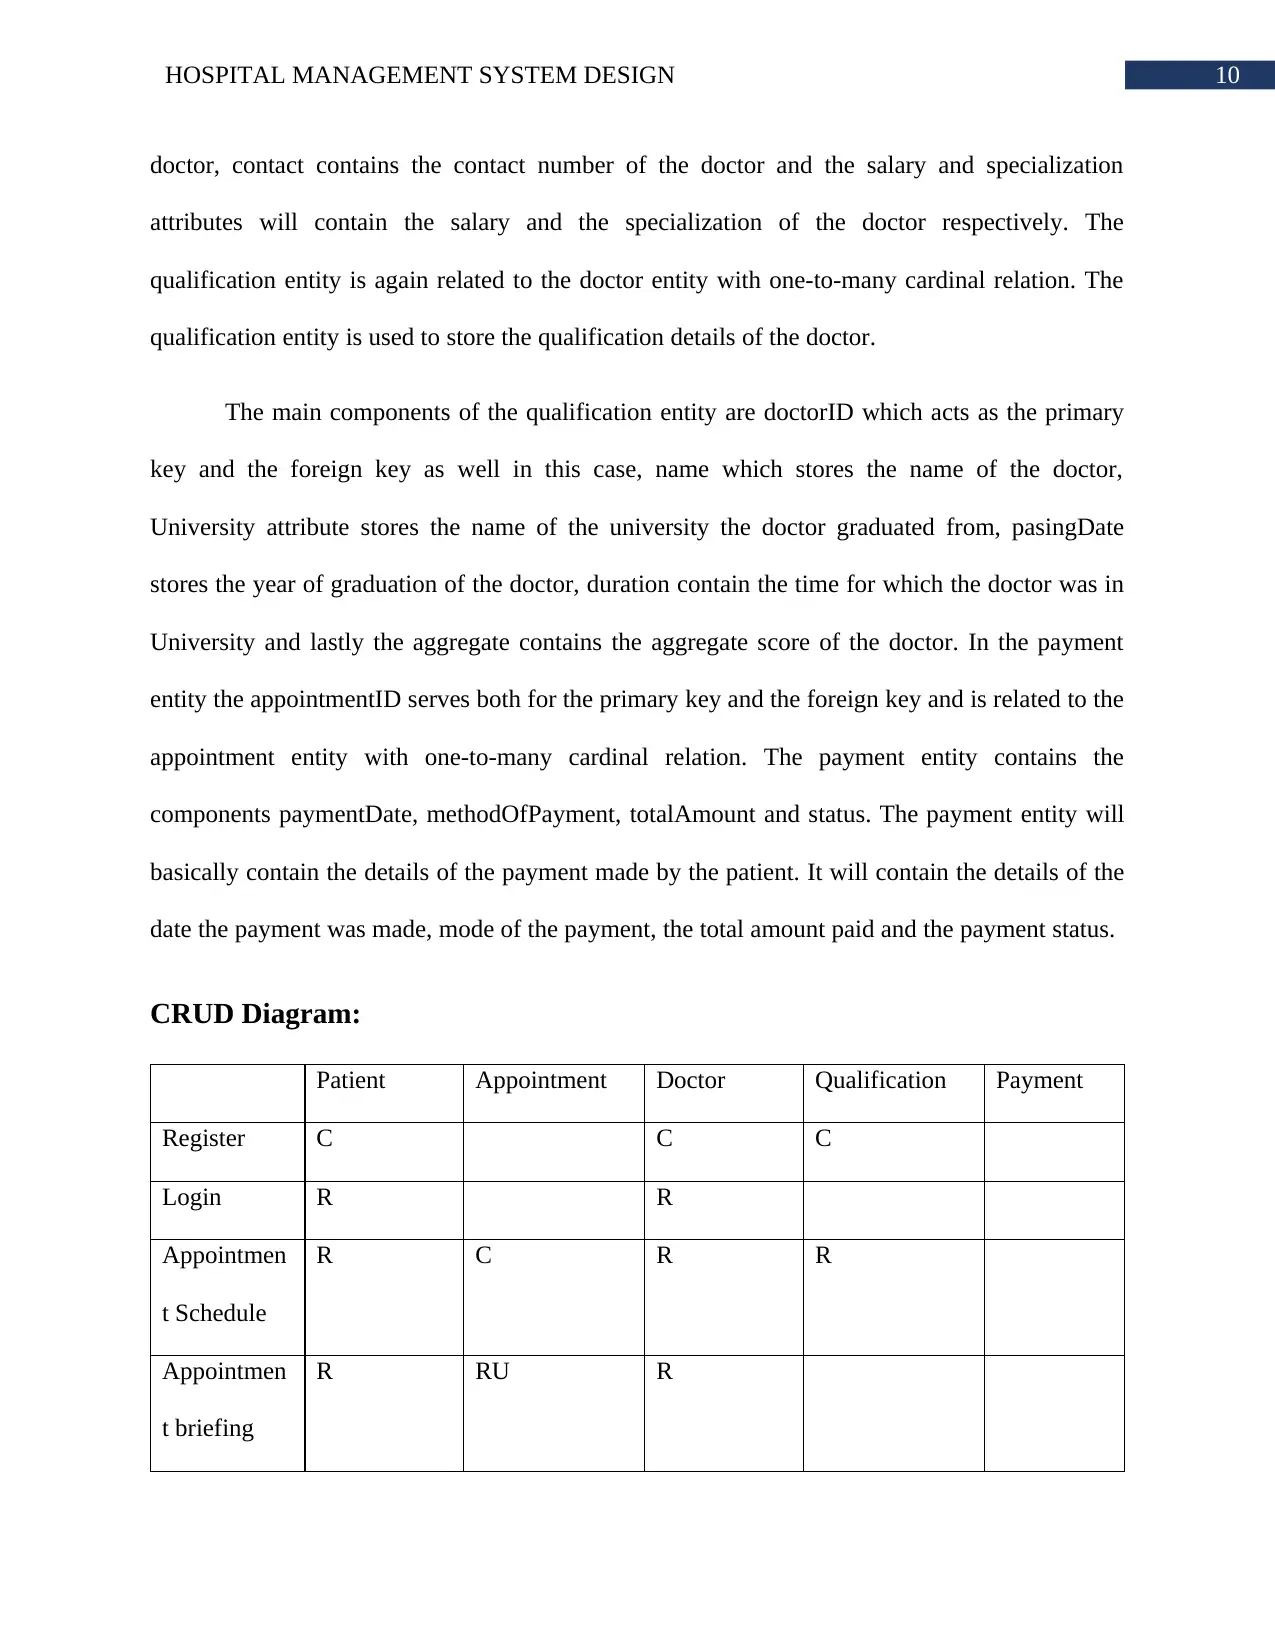
CRUD Diagram:
Patient Appointment Doctor Qualification Payment
Register C C C
Login R R
Appointmen
t Schedule
R C R R
Appointmen
t briefing
R RU R
doctor, contact contains the contact number of the doctor and the salary and specialization
attributes will contain the salary and the specialization of the doctor respectively. The
qualification entity is again related to the doctor entity with one-to-many cardinal relation. The
qualification entity is used to store the qualification details of the doctor.
The main components of the qualification entity are doctorID which acts as the primary
key and the foreign key as well in this case, name which stores the name of the doctor,
University attribute stores the name of the university the doctor graduated from, pasingDate
stores the year of graduation of the doctor, duration contain the time for which the doctor was in
University and lastly the aggregate contains the aggregate score of the doctor. In the payment
entity the appointmentID serves both for the primary key and the foreign key and is related to the
appointment entity with one-to-many cardinal relation. The payment entity contains the
components paymentDate, methodOfPayment, totalAmount and status. The payment entity will
basically contain the details of the payment made by the patient. It will contain the details of the
date the payment was made, mode of the payment, the total amount paid and the payment status.
CRUD Diagram:
Patient Appointment Doctor Qualification Payment
Register C C C
Login R R
Appointmen
t Schedule
R C R R
Appointmen
t briefing
R RU R
11HOSPITAL MANAGEMENT SYSTEM DESIGN
Payment R R R C
Prototype and Architecture Diagram:
Payment R R R C
Prototype and Architecture Diagram:
⊘ This is a preview!⊘
Do you want full access?
Subscribe today to unlock all pages.
Trusted by 1+ million students worldwide
1 out of 20
Related Documents


Your All-in-One AI-Powered Toolkit for Academic Success.
+13062052269
info@desklib.com
Available 24*7 on WhatsApp / Email
![[object Object]](/_next/static/media/star-bottom.7253800d.svg)
Unlock your academic potential
Copyright © 2020–2026 A2Z Services. All Rights Reserved. Developed and managed by ZUCOL.