Comparative Financial Performance Analysis: Woolworths vs. Coles Group
VerifiedAdded on 2022/08/15
|16
|3822
|20
Report
AI Summary
This report conducts a financial performance analysis of Woolworths and Coles Group Limited, examining data from the past five years. The analysis utilizes financial ratios such as leverage, liquidity, profitability, cash flow, and asset utilization to assess each company's performance and identify trends. The report reveals that while Woolworths demonstrates greater efficiency in asset utilization and cash flow, Coles Group exhibits superior performance in leverage, liquidity, and profitability ratios. Ultimately, the analysis suggests that Coles Group demonstrates a higher overall financial performance compared to Woolworths during the examined period. The report provides an in-depth comparative study of the two major players in the Australian retail sector, offering valuable insights into their financial health and strategic positioning.
Running head: INVESTMENT ANALYSIS AND PORTFOLIO MANAGEMENT
Investment Analysis and Portfolio Management
Name of the Student:
Name of the University:
Author Note
Investment Analysis and Portfolio Management
Name of the Student:
Name of the University:
Author Note
Paraphrase This Document
Need a fresh take? Get an instant paraphrase of this document with our AI Paraphraser
1INVESTMENT ANALYSIS AND PORTFOLIO MANAGEMENT
Executive Summary:
The report conducts financial performance on Woolworths and Coles Group Limited for the
past 5-year data. The report uses financial ratios such as leverage, liquidity, profitability, cash
flow and asset utilization has been used for calculating the financial performance and
determining the trend. In addition, further analysis states that the performance of Woolworths
in more appropriate in comparison to Coles limited on asset efficiency and cash flow ratios.
However, the performance of Cole’s group is higher in Leverage ratio, liquidity ratio and
profitability ratios. Thus, the analysis states that the performance of Coles in higher in
comparison to Woolworths.
2INVESTMENT ANALYSIS AND PORTFOLIO MANAGEMENT
Table of Contents
Introduction:...............................................................................................................................3
Identification of the issues:........................................................................................................3
Financial analysis: (Comparative analysis of each firm’s financial performance)....................4
Leverage ratio:.......................................................................................................................4
Asset utilization:.....................................................................................................................5
Liquidity:................................................................................................................................7
Profitability:...........................................................................................................................8
Cash flow:..............................................................................................................................9
Recommendation:....................................................................................................................11
Conclusions:.............................................................................................................................12
References and Bibliography:..................................................................................................13
⊘ This is a preview!⊘
Do you want full access?
Subscribe today to unlock all pages.
Trusted by 1+ million students worldwide
3INVESTMENT ANALYSIS AND PORTFOLIO MANAGEMENT
Introduction:
The assessment mainly analyse the financial performance of Woolworths and Coles
Group Limited for the past 5-year data. This information would eventually help in
determining the current capability of the organisation to achieve targeted benefits and become
the industry leader in Australia. The financial ratios such as leverage, liquidity, profitability,
cash flow and asset utilization has been used for calculating the financial performance and
determining the trend in its overall performance. In addition, appropriate discussion has been
made on the current attributes of the both the organisation and the relevant analysis that needs
to be conducted for understanding its performance.
Identification of the issues:
The main problems in hand are to detect, which organisation among Woolworths and
Coles Group has the highest performance level as per the financial ratios. In addition, the
financial ratios such as leverage, liquidity, profitability, cash flow and asset utilization is
mainly used for understanding the condition of both the companies, while detecting the best
performer. Moreover, the retail sector analysis mainly provides information regarding the
duopoly, which is present within the industry, as both Coles and Woolworths mainly account
for nearly 80% of the total retail sector of Australia.
Woolworth is considered to be one of the largest super market brands in Australia,
whose operations are spread all over the country. The company was founded during 1924,
where the management had made calculating decisions to improve their performance and
support the company growth in the Australian market. Further analysis portrays that the
operations of Woolworths focuses on groceries, while other operations are also supported by
the company, which are household products, selling magazines, DVDs, health products, pet
supplies, baby supplies, beauty products, and stationery (Woolworthsgroup.com.au, 2020).
Paraphrase This Document
Need a fresh take? Get an instant paraphrase of this document with our AI Paraphraser
4INVESTMENT ANALYSIS AND PORTFOLIO MANAGEMENT
Cole’s group limited is considered to be the second largest retailer in Australia after
its competitor Woolworths. The Coles group was founded in 1914, as the management has
taken appropriate steps for its survival in the past financial years. The company has been
conducting operations under the Western Australian conglomerate Wesfarmers for the
duration of 2007 to 2018 (Colesgroup.com.au, 2019). The company has been enlisted in the
Australian exchange while making the organization the second largest in Australian retail
sector after the Woolworths.
Financial analysis: (Comparative analysis of each firm’s financial performance)
Leverage ratio:
Particulars 2019 2018 2017 2016 2015 2019 2018 2017 2016 2015
EBIT 2,353.00 2,548.00 2,326.00 1,494.90 3,322.50 2,974.00 2,344.00 4,402.00 1,346.00 3,759.00
Interest expense 126.00 154.00 193.60 245.60 254.80 175.00 210.00 264.00 308.00 315.00
Asset 23,491.00 23,391.00 22,915.80 23,502.20 25,336.80 18,333.00 36,933.00 40,115.00 40,783.00 40,402.00
Equity 10,669.00 10,849.00 9,876.10 8,781.90 11,132.00 9,971.00 22,754.00 23,941.00 22,949.00 24,781.00
Debt 1,599.00 1,222.00 1,431.90 2,513.10 3,067.30 2,500.00 3,933.00 5,413.00 7,303.00 6,209.00
Levarage ratios 2019 2018 2017 2016 2015 2019 2018 2017 2016 2015
Interest burden 0.95 0.94 0.92 0.84 0.92 0.94 0.91 0.94 0.77 0.92
Interest coverage 18.67 16.55 12.01 6.09 13.04 16.99 11.16 16.67 4.37 11.93
Leverage 2.20 2.16 2.32 2.68 2.28 1.84 1.62 1.68 1.78 1.63
Compound leverage factor 2.08 2.03 2.13 2.24 2.10 1.73 1.48 1.58 1.37 1.49
COLES GROUP LIMITEDWOOLWORTHS GROUP LIMITED
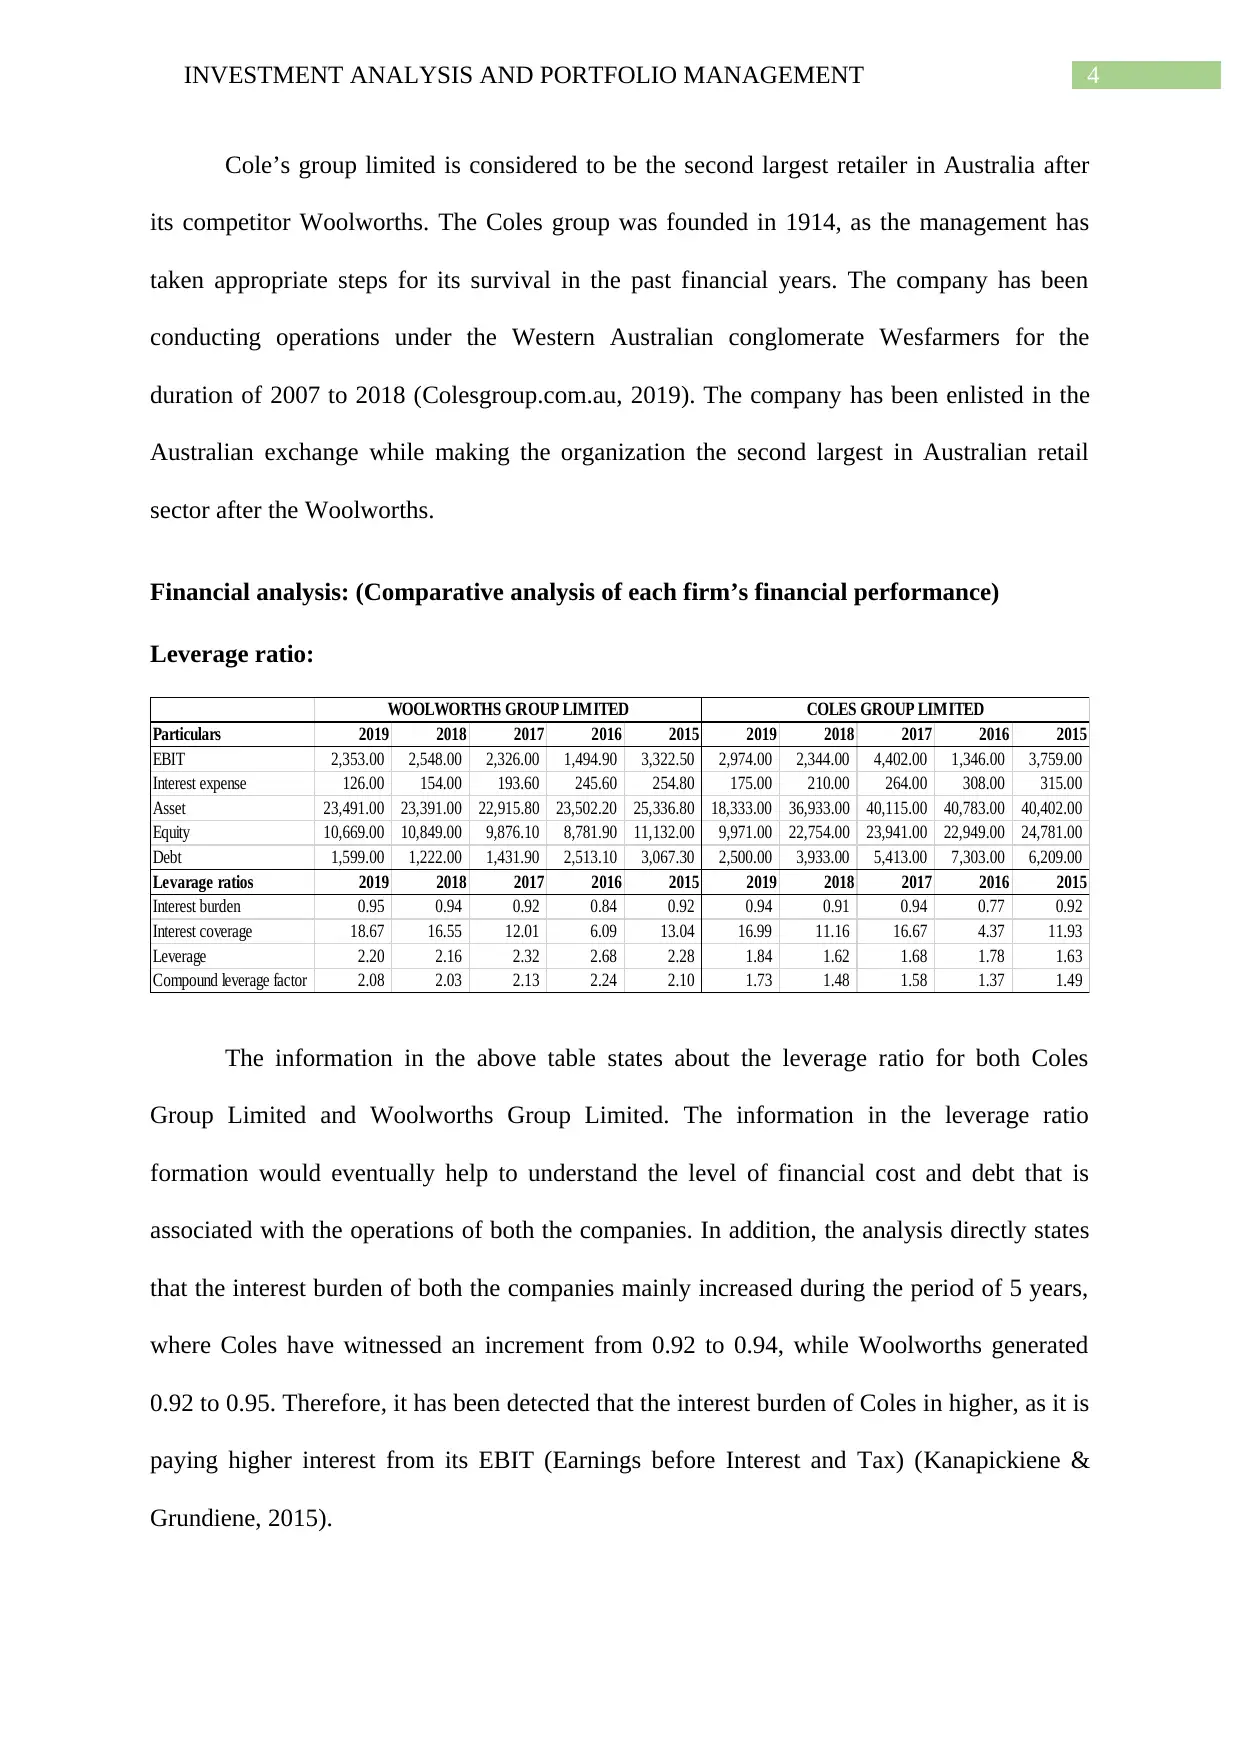
The information in the above table states about the leverage ratio for both Coles
Group Limited and Woolworths Group Limited. The information in the leverage ratio
formation would eventually help to understand the level of financial cost and debt that is
associated with the operations of both the companies. In addition, the analysis directly states
that the interest burden of both the companies mainly increased during the period of 5 years,
where Coles have witnessed an increment from 0.92 to 0.94, while Woolworths generated
0.92 to 0.95. Therefore, it has been detected that the interest burden of Coles in higher, as it is
paying higher interest from its EBIT (Earnings before Interest and Tax) (Kanapickiene &
Grundiene, 2015).
Cole’s group limited is considered to be the second largest retailer in Australia after
its competitor Woolworths. The Coles group was founded in 1914, as the management has
taken appropriate steps for its survival in the past financial years. The company has been
conducting operations under the Western Australian conglomerate Wesfarmers for the
duration of 2007 to 2018 (Colesgroup.com.au, 2019). The company has been enlisted in the
Australian exchange while making the organization the second largest in Australian retail
sector after the Woolworths.
Financial analysis: (Comparative analysis of each firm’s financial performance)
Leverage ratio:
Particulars 2019 2018 2017 2016 2015 2019 2018 2017 2016 2015
EBIT 2,353.00 2,548.00 2,326.00 1,494.90 3,322.50 2,974.00 2,344.00 4,402.00 1,346.00 3,759.00
Interest expense 126.00 154.00 193.60 245.60 254.80 175.00 210.00 264.00 308.00 315.00
Asset 23,491.00 23,391.00 22,915.80 23,502.20 25,336.80 18,333.00 36,933.00 40,115.00 40,783.00 40,402.00
Equity 10,669.00 10,849.00 9,876.10 8,781.90 11,132.00 9,971.00 22,754.00 23,941.00 22,949.00 24,781.00
Debt 1,599.00 1,222.00 1,431.90 2,513.10 3,067.30 2,500.00 3,933.00 5,413.00 7,303.00 6,209.00
Levarage ratios 2019 2018 2017 2016 2015 2019 2018 2017 2016 2015
Interest burden 0.95 0.94 0.92 0.84 0.92 0.94 0.91 0.94 0.77 0.92
Interest coverage 18.67 16.55 12.01 6.09 13.04 16.99 11.16 16.67 4.37 11.93
Leverage 2.20 2.16 2.32 2.68 2.28 1.84 1.62 1.68 1.78 1.63
Compound leverage factor 2.08 2.03 2.13 2.24 2.10 1.73 1.48 1.58 1.37 1.49
COLES GROUP LIMITEDWOOLWORTHS GROUP LIMITED
The information in the above table states about the leverage ratio for both Coles
Group Limited and Woolworths Group Limited. The information in the leverage ratio
formation would eventually help to understand the level of financial cost and debt that is
associated with the operations of both the companies. In addition, the analysis directly states
that the interest burden of both the companies mainly increased during the period of 5 years,
where Coles have witnessed an increment from 0.92 to 0.94, while Woolworths generated
0.92 to 0.95. Therefore, it has been detected that the interest burden of Coles in higher, as it is
paying higher interest from its EBIT (Earnings before Interest and Tax) (Kanapickiene &
Grundiene, 2015).
5INVESTMENT ANALYSIS AND PORTFOLIO MANAGEMENT
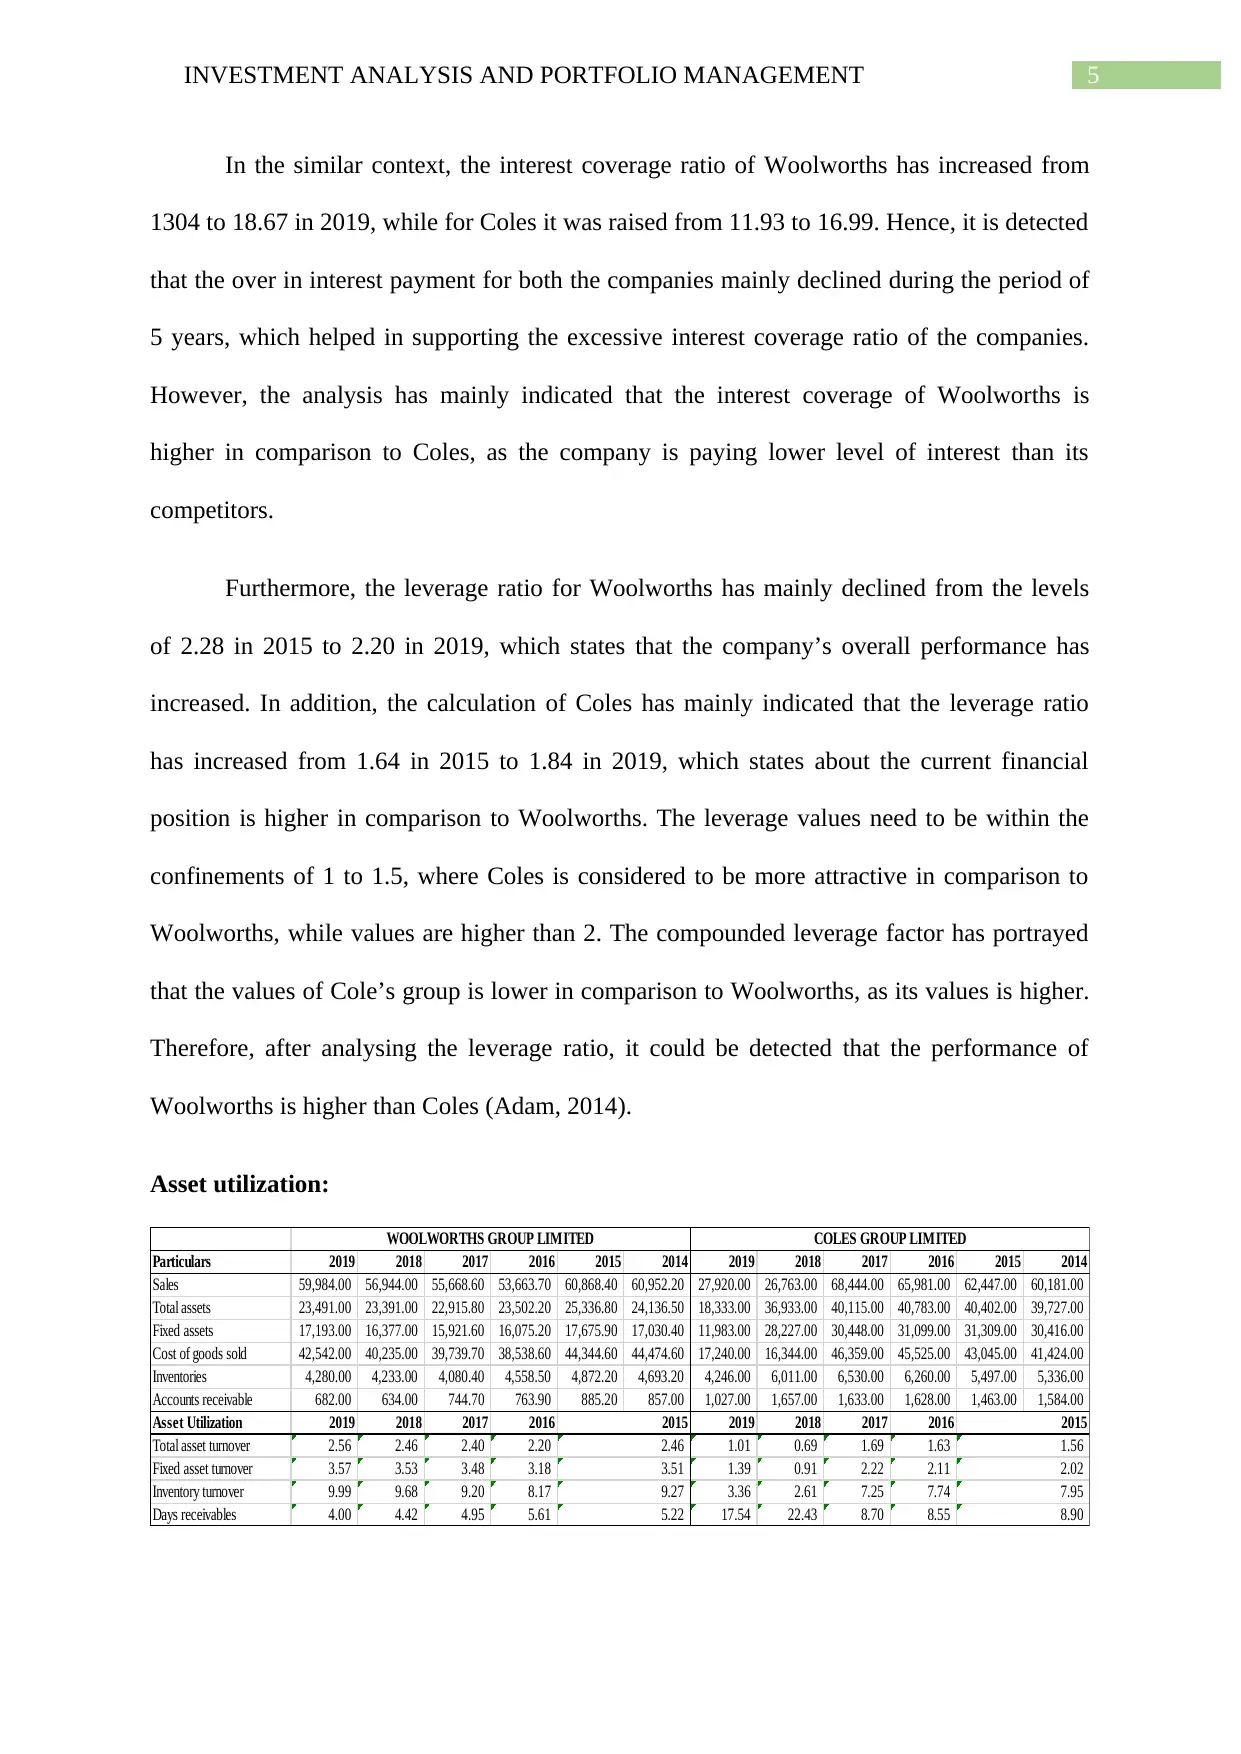
In the similar context, the interest coverage ratio of Woolworths has increased from
1304 to 18.67 in 2019, while for Coles it was raised from 11.93 to 16.99. Hence, it is detected
that the over in interest payment for both the companies mainly declined during the period of
5 years, which helped in supporting the excessive interest coverage ratio of the companies.
However, the analysis has mainly indicated that the interest coverage of Woolworths is
higher in comparison to Coles, as the company is paying lower level of interest than its
competitors.
Furthermore, the leverage ratio for Woolworths has mainly declined from the levels
of 2.28 in 2015 to 2.20 in 2019, which states that the company’s overall performance has
increased. In addition, the calculation of Coles has mainly indicated that the leverage ratio
has increased from 1.64 in 2015 to 1.84 in 2019, which states about the current financial
position is higher in comparison to Woolworths. The leverage values need to be within the
confinements of 1 to 1.5, where Coles is considered to be more attractive in comparison to
Woolworths, while values are higher than 2. The compounded leverage factor has portrayed
that the values of Cole’s group is lower in comparison to Woolworths, as its values is higher.
Therefore, after analysing the leverage ratio, it could be detected that the performance of
Woolworths is higher than Coles (Adam, 2014).
Asset utilization:
Particulars 2019 2018 2017 2016 2015 2014 2019 2018 2017 2016 2015 2014
Sales 59,984.00 56,944.00 55,668.60 53,663.70 60,868.40 60,952.20 27,920.00 26,763.00 68,444.00 65,981.00 62,447.00 60,181.00
Total assets 23,491.00 23,391.00 22,915.80 23,502.20 25,336.80 24,136.50 18,333.00 36,933.00 40,115.00 40,783.00 40,402.00 39,727.00
Fixed assets 17,193.00 16,377.00 15,921.60 16,075.20 17,675.90 17,030.40 11,983.00 28,227.00 30,448.00 31,099.00 31,309.00 30,416.00
Cost of goods sold 42,542.00 40,235.00 39,739.70 38,538.60 44,344.60 44,474.60 17,240.00 16,344.00 46,359.00 45,525.00 43,045.00 41,424.00
Inventories 4,280.00 4,233.00 4,080.40 4,558.50 4,872.20 4,693.20 4,246.00 6,011.00 6,530.00 6,260.00 5,497.00 5,336.00
Accounts receivable 682.00 634.00 744.70 763.90 885.20 857.00 1,027.00 1,657.00 1,633.00 1,628.00 1,463.00 1,584.00
Asset Utilization 2019 2018 2017 2016 2019 2018 2017 2016
Total asset turnover 2.56 2.46 2.40 2.20 1.01 0.69 1.69 1.63
Fixed asset turnover 3.57 3.53 3.48 3.18 1.39 0.91 2.22 2.11
Inventory turnover 9.99 9.68 9.20 8.17 3.36 2.61 7.25 7.74
Days receivables 4.00 4.42 4.95 5.61 17.54 22.43 8.70 8.55
WOOLWORTHS GROUP LIMITED
5.22 8.90
2.46 1.56
3.51 2.02
9.27 7.95
2015 2015
COLES GROUP LIMITED
⊘ This is a preview!⊘
Do you want full access?
Subscribe today to unlock all pages.
Trusted by 1+ million students worldwide
6INVESTMENT ANALYSIS AND PORTFOLIO MANAGEMENT
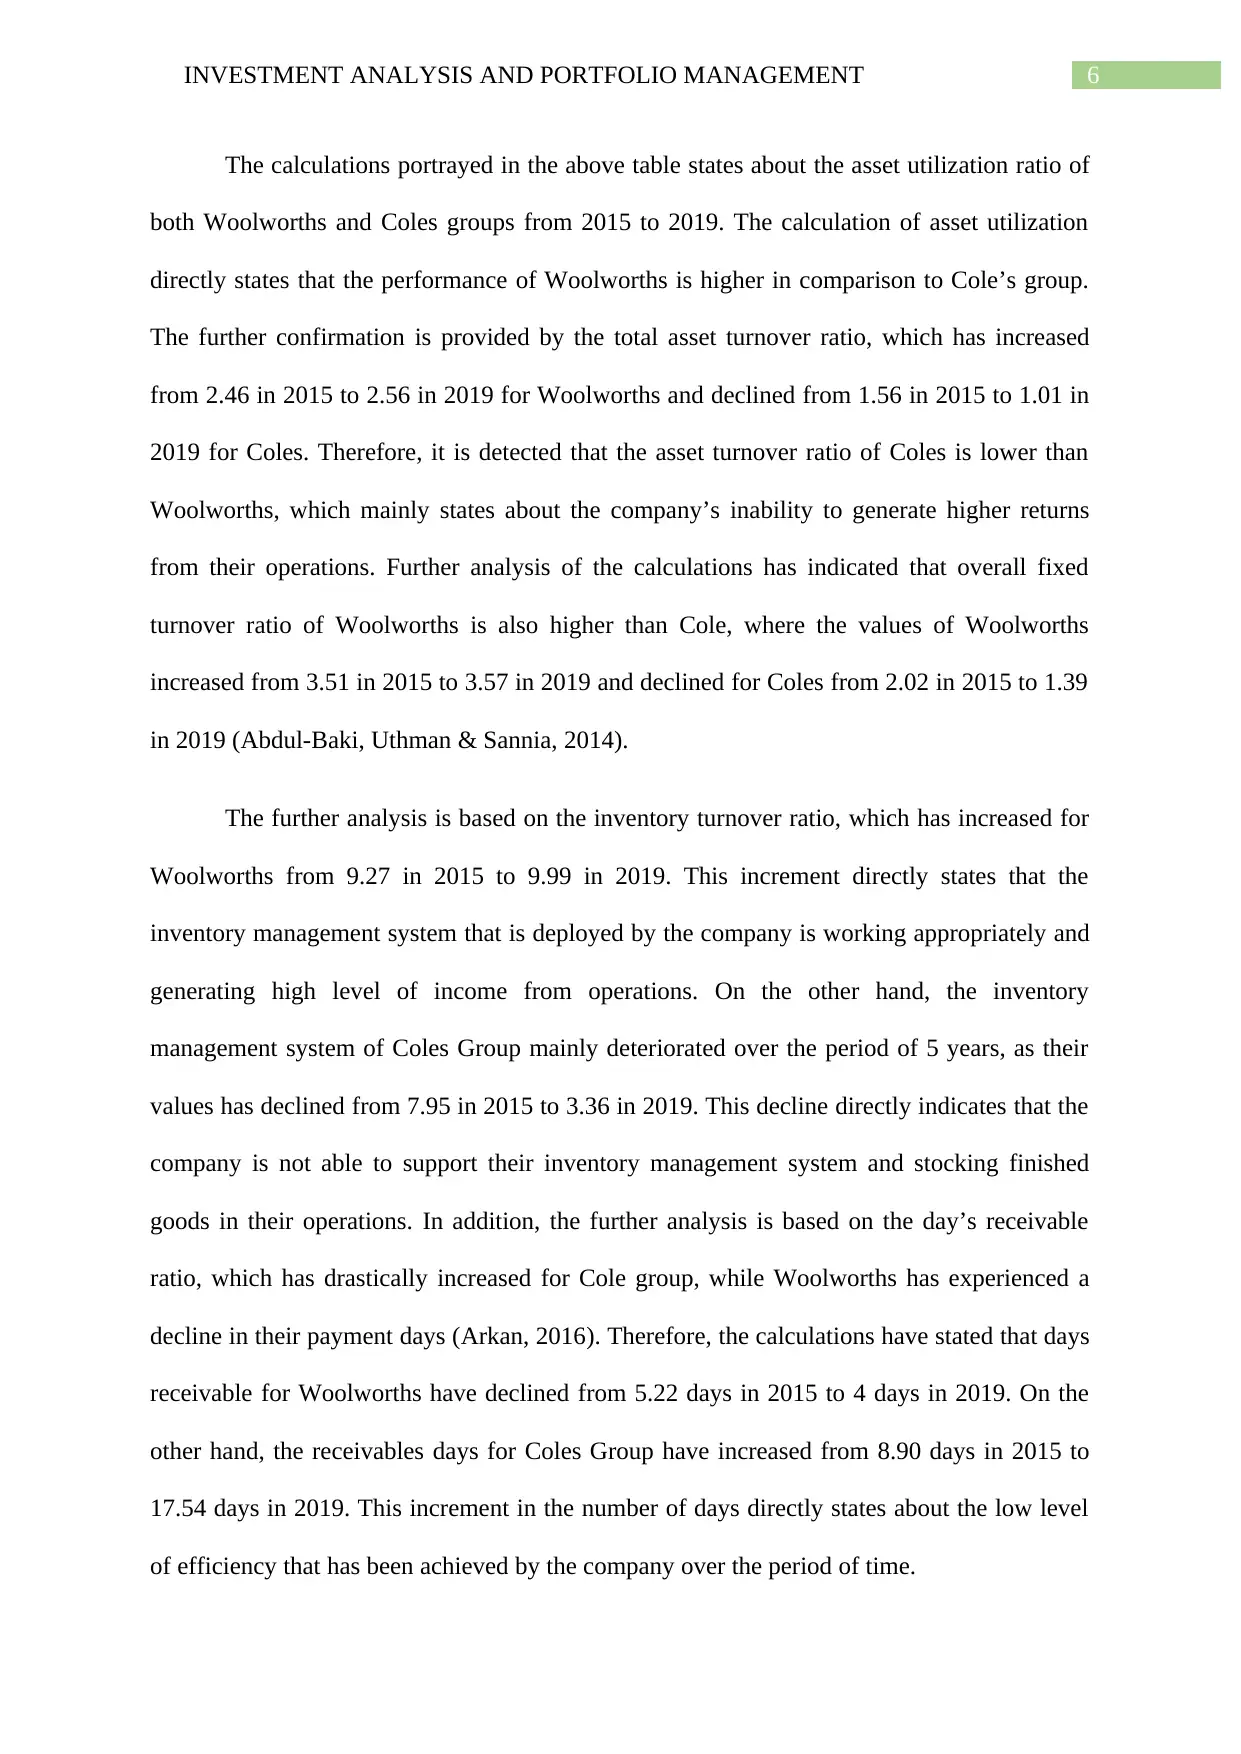
The calculations portrayed in the above table states about the asset utilization ratio of
both Woolworths and Coles groups from 2015 to 2019. The calculation of asset utilization
directly states that the performance of Woolworths is higher in comparison to Cole’s group.
The further confirmation is provided by the total asset turnover ratio, which has increased
from 2.46 in 2015 to 2.56 in 2019 for Woolworths and declined from 1.56 in 2015 to 1.01 in
2019 for Coles. Therefore, it is detected that the asset turnover ratio of Coles is lower than
Woolworths, which mainly states about the company’s inability to generate higher returns
from their operations. Further analysis of the calculations has indicated that overall fixed
turnover ratio of Woolworths is also higher than Cole, where the values of Woolworths
increased from 3.51 in 2015 to 3.57 in 2019 and declined for Coles from 2.02 in 2015 to 1.39
in 2019 (Abdul-Baki, Uthman & Sannia, 2014).
The further analysis is based on the inventory turnover ratio, which has increased for
Woolworths from 9.27 in 2015 to 9.99 in 2019. This increment directly states that the
inventory management system that is deployed by the company is working appropriately and
generating high level of income from operations. On the other hand, the inventory
management system of Coles Group mainly deteriorated over the period of 5 years, as their
values has declined from 7.95 in 2015 to 3.36 in 2019. This decline directly indicates that the
company is not able to support their inventory management system and stocking finished
goods in their operations. In addition, the further analysis is based on the day’s receivable
ratio, which has drastically increased for Cole group, while Woolworths has experienced a
decline in their payment days (Arkan, 2016). Therefore, the calculations have stated that days
receivable for Woolworths have declined from 5.22 days in 2015 to 4 days in 2019. On the
other hand, the receivables days for Coles Group have increased from 8.90 days in 2015 to
17.54 days in 2019. This increment in the number of days directly states about the low level
of efficiency that has been achieved by the company over the period of time.
Paraphrase This Document
Need a fresh take? Get an instant paraphrase of this document with our AI Paraphraser
7INVESTMENT ANALYSIS AND PORTFOLIO MANAGEMENT
Liquidity:
Particulars 2019 2018 2017 2016 2015 2019 2018 2017 2016 2015
Current assets 6,298.00 7,014.00 6,994.20 7,427.00 7,660.90 6,350.00 8,706.00 9,667.00 9,684.00 9,093.00
Current liabilities 8,620.00 9,029.00 8,824.20 8,992.70 9,168.60 5,216.00 10,025.00 10,417.00 10,424.00 8,229.00
Inventories 4,280.00 4,233.00 4,080.40 4,558.50 4,872.20 4,246.00 6,011.00 6,530.00 6,260.00 5,497.00
Cash 1,066.00 1,273.00 909.40 948.10 1,333.40 795.00 683.00 1,013.00 611.00 711.00
marketable securities 270.00 874.00 1,259.70 1,156.50 570.10 282.00 355.00 491.00 350.00 616.00
Liability ratios 2019 2018 2017 2016 2015 2019 2018 2017 2016 2015
Current ratio 0.73 0.78 0.79 0.83 0.84 1.22 0.87 0.93 0.93 1.10
Quick ratio 0.23 0.31 0.33 0.32 0.30 0.40 0.27 0.30 0.33 0.44
Cash ratio 0.15 0.24 0.25 0.23 0.21 0.21 0.10 0.14 0.09 0.16
COLES GROUP LIMITEDWOOLWORTHS GROUP LIMITED
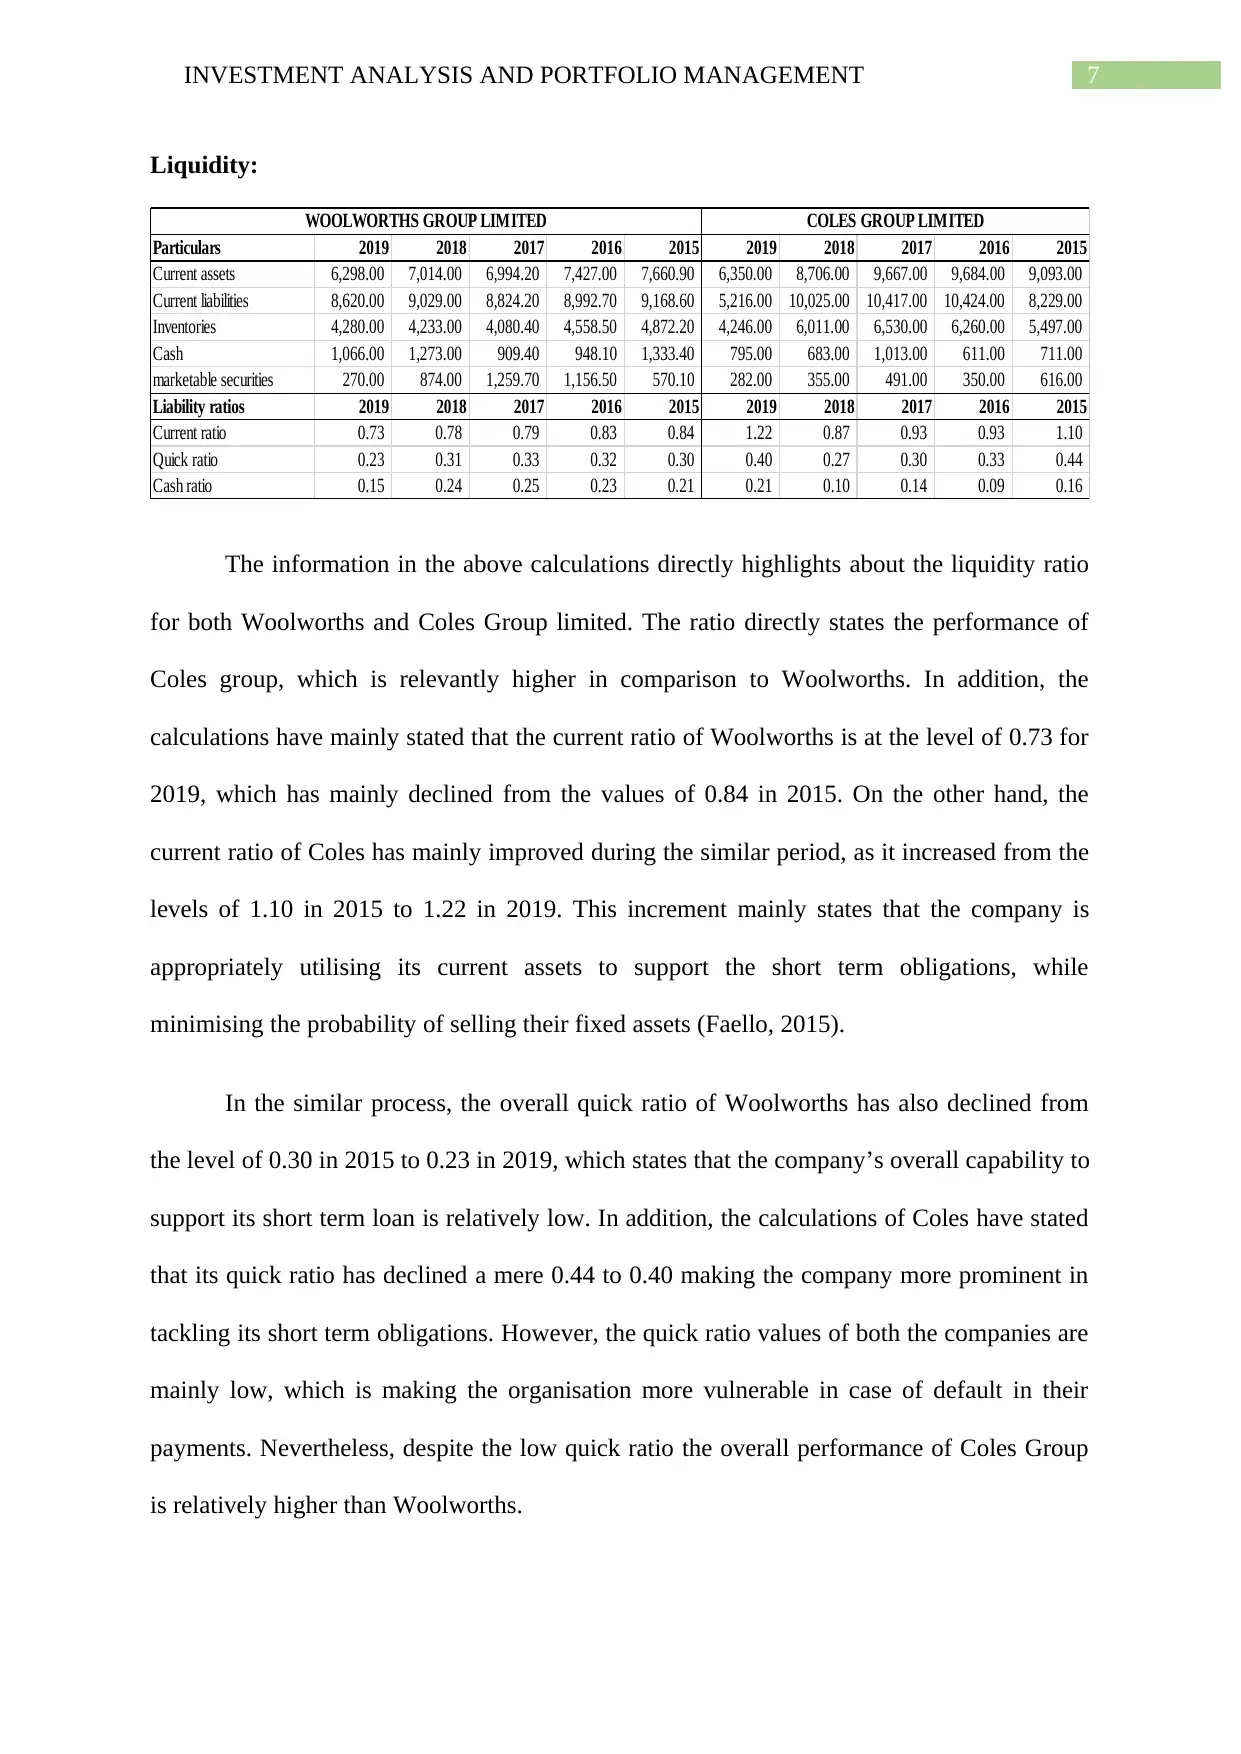
The information in the above calculations directly highlights about the liquidity ratio
for both Woolworths and Coles Group limited. The ratio directly states the performance of
Coles group, which is relevantly higher in comparison to Woolworths. In addition, the
calculations have mainly stated that the current ratio of Woolworths is at the level of 0.73 for
2019, which has mainly declined from the values of 0.84 in 2015. On the other hand, the
current ratio of Coles has mainly improved during the similar period, as it increased from the
levels of 1.10 in 2015 to 1.22 in 2019. This increment mainly states that the company is
appropriately utilising its current assets to support the short term obligations, while
minimising the probability of selling their fixed assets (Faello, 2015).
In the similar process, the overall quick ratio of Woolworths has also declined from
the level of 0.30 in 2015 to 0.23 in 2019, which states that the company’s overall capability to
support its short term loan is relatively low. In addition, the calculations of Coles have stated
that its quick ratio has declined a mere 0.44 to 0.40 making the company more prominent in
tackling its short term obligations. However, the quick ratio values of both the companies are
mainly low, which is making the organisation more vulnerable in case of default in their
payments. Nevertheless, despite the low quick ratio the overall performance of Coles Group
is relatively higher than Woolworths.
Liquidity:
Particulars 2019 2018 2017 2016 2015 2019 2018 2017 2016 2015
Current assets 6,298.00 7,014.00 6,994.20 7,427.00 7,660.90 6,350.00 8,706.00 9,667.00 9,684.00 9,093.00
Current liabilities 8,620.00 9,029.00 8,824.20 8,992.70 9,168.60 5,216.00 10,025.00 10,417.00 10,424.00 8,229.00
Inventories 4,280.00 4,233.00 4,080.40 4,558.50 4,872.20 4,246.00 6,011.00 6,530.00 6,260.00 5,497.00
Cash 1,066.00 1,273.00 909.40 948.10 1,333.40 795.00 683.00 1,013.00 611.00 711.00
marketable securities 270.00 874.00 1,259.70 1,156.50 570.10 282.00 355.00 491.00 350.00 616.00
Liability ratios 2019 2018 2017 2016 2015 2019 2018 2017 2016 2015
Current ratio 0.73 0.78 0.79 0.83 0.84 1.22 0.87 0.93 0.93 1.10
Quick ratio 0.23 0.31 0.33 0.32 0.30 0.40 0.27 0.30 0.33 0.44
Cash ratio 0.15 0.24 0.25 0.23 0.21 0.21 0.10 0.14 0.09 0.16
COLES GROUP LIMITEDWOOLWORTHS GROUP LIMITED
The information in the above calculations directly highlights about the liquidity ratio
for both Woolworths and Coles Group limited. The ratio directly states the performance of
Coles group, which is relevantly higher in comparison to Woolworths. In addition, the
calculations have mainly stated that the current ratio of Woolworths is at the level of 0.73 for
2019, which has mainly declined from the values of 0.84 in 2015. On the other hand, the
current ratio of Coles has mainly improved during the similar period, as it increased from the
levels of 1.10 in 2015 to 1.22 in 2019. This increment mainly states that the company is
appropriately utilising its current assets to support the short term obligations, while
minimising the probability of selling their fixed assets (Faello, 2015).
In the similar process, the overall quick ratio of Woolworths has also declined from
the level of 0.30 in 2015 to 0.23 in 2019, which states that the company’s overall capability to
support its short term loan is relatively low. In addition, the calculations of Coles have stated
that its quick ratio has declined a mere 0.44 to 0.40 making the company more prominent in
tackling its short term obligations. However, the quick ratio values of both the companies are
mainly low, which is making the organisation more vulnerable in case of default in their
payments. Nevertheless, despite the low quick ratio the overall performance of Coles Group
is relatively higher than Woolworths.
8INVESTMENT ANALYSIS AND PORTFOLIO MANAGEMENT
Further analysis is based on the cash ratios of both Woolworths and Coles Group for
the period of 5 years. This calculation directly evaluates the cash presence of the company in
comparison to its overall current liabilities. The analysis has directly stated that both the
companies’ cash presence is not appropriate to support their short term obligations. However,
the values of Cole’s group are relatively higher in comparisons to Woolworths, which make
the company more attractive for investors (Pech, Noguera & White, 2015). Thus, from the
analysis, it has been detected that the liquidity ratio of Coles is much higher in companion to
Woolworths, which is mainly allowing the organisation to support its short term obligations.
Profitability:
Particulars 2019 2018 2017 2016 2015 2014 2019 2018 2017 2016 2015 2014
EBIT 2,353.00 2,548.00 2,326.00 1,494.90 3,322.50 3,775.20 2,974.00 2,344.00 4,402.00 1,346.00 3,759.00 2,795.00
Total assets 23,491.00 23,391.00 22,915.80 23,502.20 25,336.80 24,136.50 18,333.00 36,933.00 40,115.00 40,783.00 40,402.00 39,727.00
Net income 2,759.00 1,795.00 1,593.40 (2,347.90) 2,137.40 2,458.40 1,940.00 1,409.00 2,873.00 407.00 2,440.00 1,510.00
Equity 10,669.00 10,849.00 9,876.10 8,781.90 11,132.00 10,525.40 9,971.00 22,754.00 23,941.00 22,949.00 24,781.00 25,987.00
Sales 59,984.00 56,944.00 55,668.60 53,663.70 60,868.40 60,952.20 27,920.00 26,763.00 68,444.00 65,981.00 62,447.00 60,181.00
Profitability ratios 2019 2018 2017 2016 2019 2018 2017 2016
Return on assets 10.04% 11.00% 10.02% 6.12% 10.76% 6.08% 10.88% 3.32%
Return on equity 25.64% 17.32% 17.08% -23.58% 11.86% 6.03% 12.25% 1.71%
Return on sales 3.92% 4.47% 4.18% 2.79% 10.65% 8.76% 6.43% 2.04%
COLES GROUP LIMITED
5.46% 6.02%
2015 2015
13.43% 9.38%
19.74% 9.61%
WOOLWORTHS GROUP LIMITED
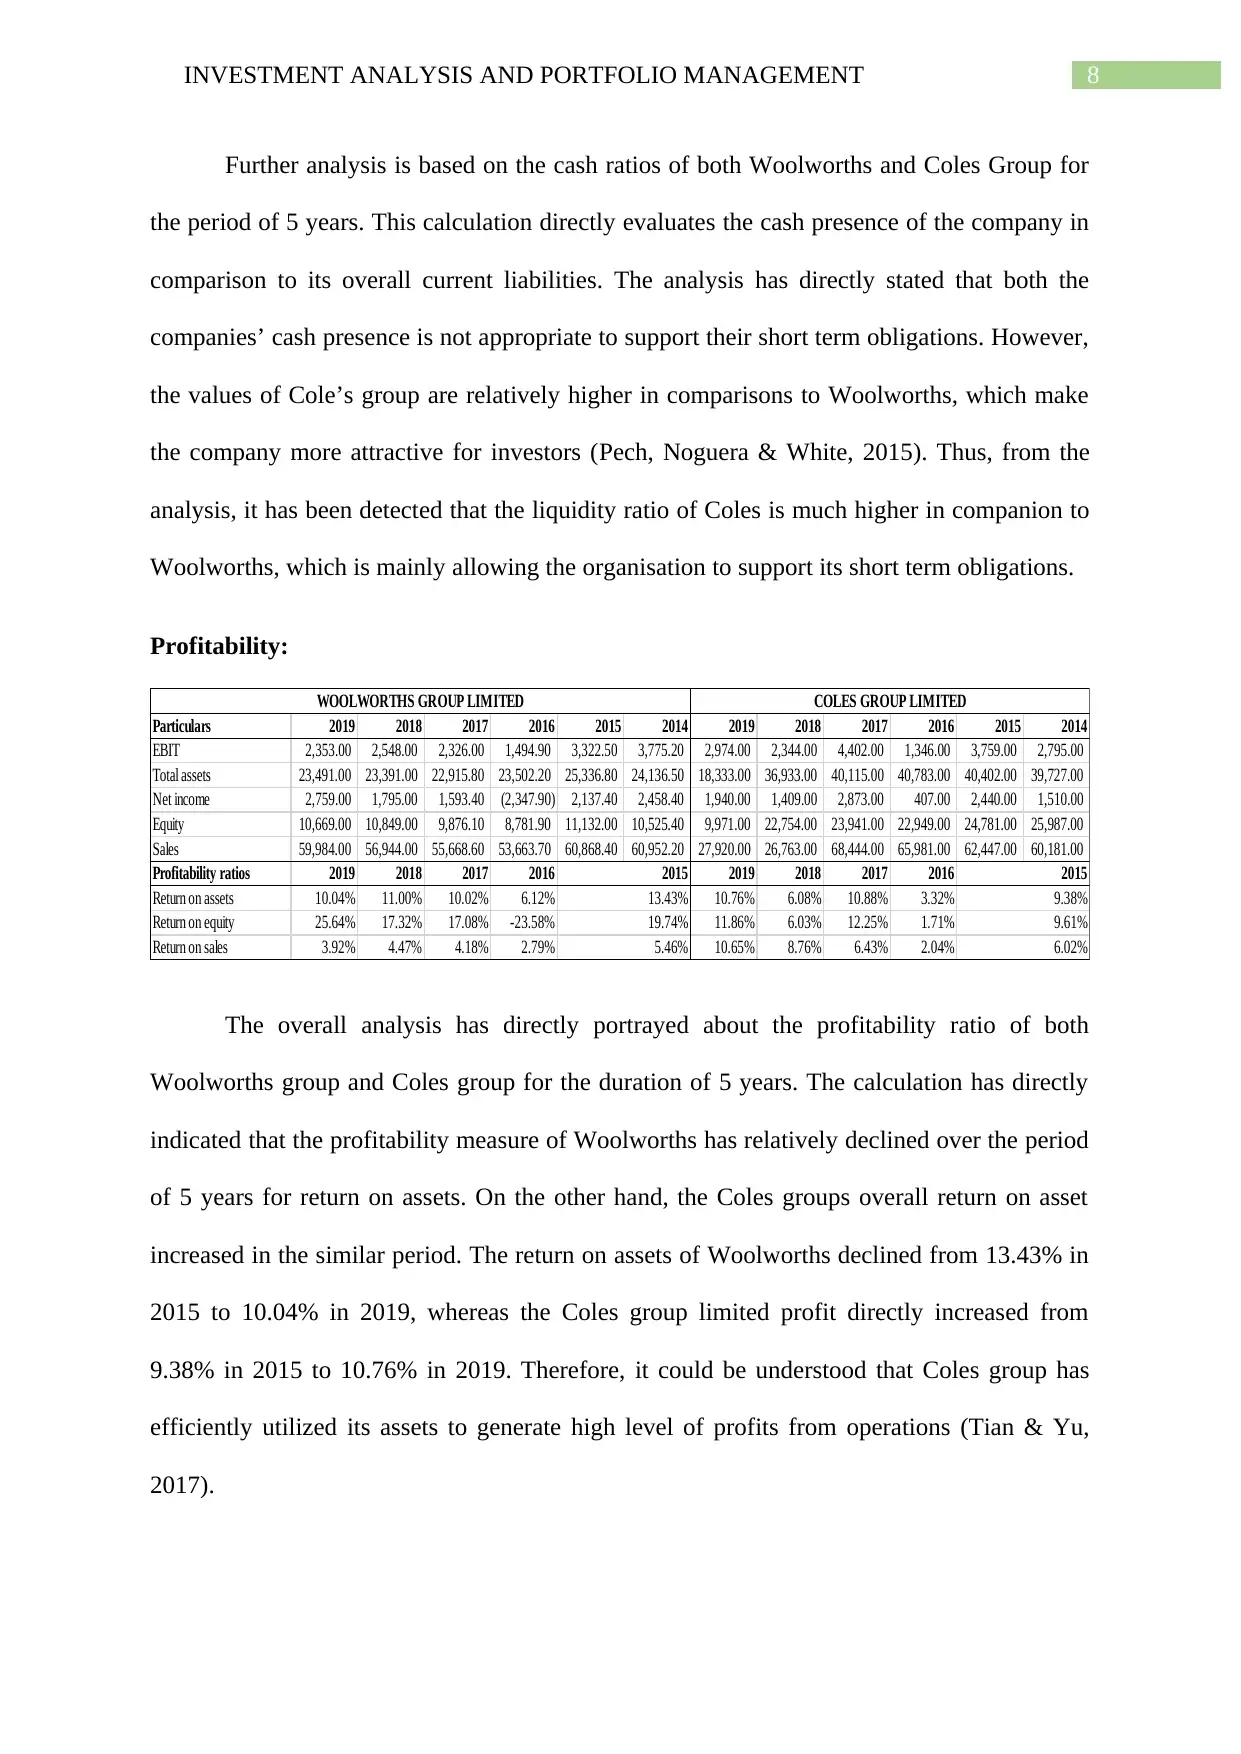
The overall analysis has directly portrayed about the profitability ratio of both
Woolworths group and Coles group for the duration of 5 years. The calculation has directly
indicated that the profitability measure of Woolworths has relatively declined over the period
of 5 years for return on assets. On the other hand, the Coles groups overall return on asset
increased in the similar period. The return on assets of Woolworths declined from 13.43% in
2015 to 10.04% in 2019, whereas the Coles group limited profit directly increased from
9.38% in 2015 to 10.76% in 2019. Therefore, it could be understood that Coles group has
efficiently utilized its assets to generate high level of profits from operations (Tian & Yu,
2017).
Further analysis is based on the cash ratios of both Woolworths and Coles Group for
the period of 5 years. This calculation directly evaluates the cash presence of the company in
comparison to its overall current liabilities. The analysis has directly stated that both the
companies’ cash presence is not appropriate to support their short term obligations. However,
the values of Cole’s group are relatively higher in comparisons to Woolworths, which make
the company more attractive for investors (Pech, Noguera & White, 2015). Thus, from the
analysis, it has been detected that the liquidity ratio of Coles is much higher in companion to
Woolworths, which is mainly allowing the organisation to support its short term obligations.
Profitability:
Particulars 2019 2018 2017 2016 2015 2014 2019 2018 2017 2016 2015 2014
EBIT 2,353.00 2,548.00 2,326.00 1,494.90 3,322.50 3,775.20 2,974.00 2,344.00 4,402.00 1,346.00 3,759.00 2,795.00
Total assets 23,491.00 23,391.00 22,915.80 23,502.20 25,336.80 24,136.50 18,333.00 36,933.00 40,115.00 40,783.00 40,402.00 39,727.00
Net income 2,759.00 1,795.00 1,593.40 (2,347.90) 2,137.40 2,458.40 1,940.00 1,409.00 2,873.00 407.00 2,440.00 1,510.00
Equity 10,669.00 10,849.00 9,876.10 8,781.90 11,132.00 10,525.40 9,971.00 22,754.00 23,941.00 22,949.00 24,781.00 25,987.00
Sales 59,984.00 56,944.00 55,668.60 53,663.70 60,868.40 60,952.20 27,920.00 26,763.00 68,444.00 65,981.00 62,447.00 60,181.00
Profitability ratios 2019 2018 2017 2016 2019 2018 2017 2016
Return on assets 10.04% 11.00% 10.02% 6.12% 10.76% 6.08% 10.88% 3.32%
Return on equity 25.64% 17.32% 17.08% -23.58% 11.86% 6.03% 12.25% 1.71%
Return on sales 3.92% 4.47% 4.18% 2.79% 10.65% 8.76% 6.43% 2.04%
COLES GROUP LIMITED
5.46% 6.02%
2015 2015
13.43% 9.38%
19.74% 9.61%
WOOLWORTHS GROUP LIMITED
The overall analysis has directly portrayed about the profitability ratio of both
Woolworths group and Coles group for the duration of 5 years. The calculation has directly
indicated that the profitability measure of Woolworths has relatively declined over the period
of 5 years for return on assets. On the other hand, the Coles groups overall return on asset
increased in the similar period. The return on assets of Woolworths declined from 13.43% in
2015 to 10.04% in 2019, whereas the Coles group limited profit directly increased from
9.38% in 2015 to 10.76% in 2019. Therefore, it could be understood that Coles group has
efficiently utilized its assets to generate high level of profits from operations (Tian & Yu,
2017).
⊘ This is a preview!⊘
Do you want full access?
Subscribe today to unlock all pages.
Trusted by 1+ million students worldwide
9INVESTMENT ANALYSIS AND PORTFOLIO MANAGEMENT
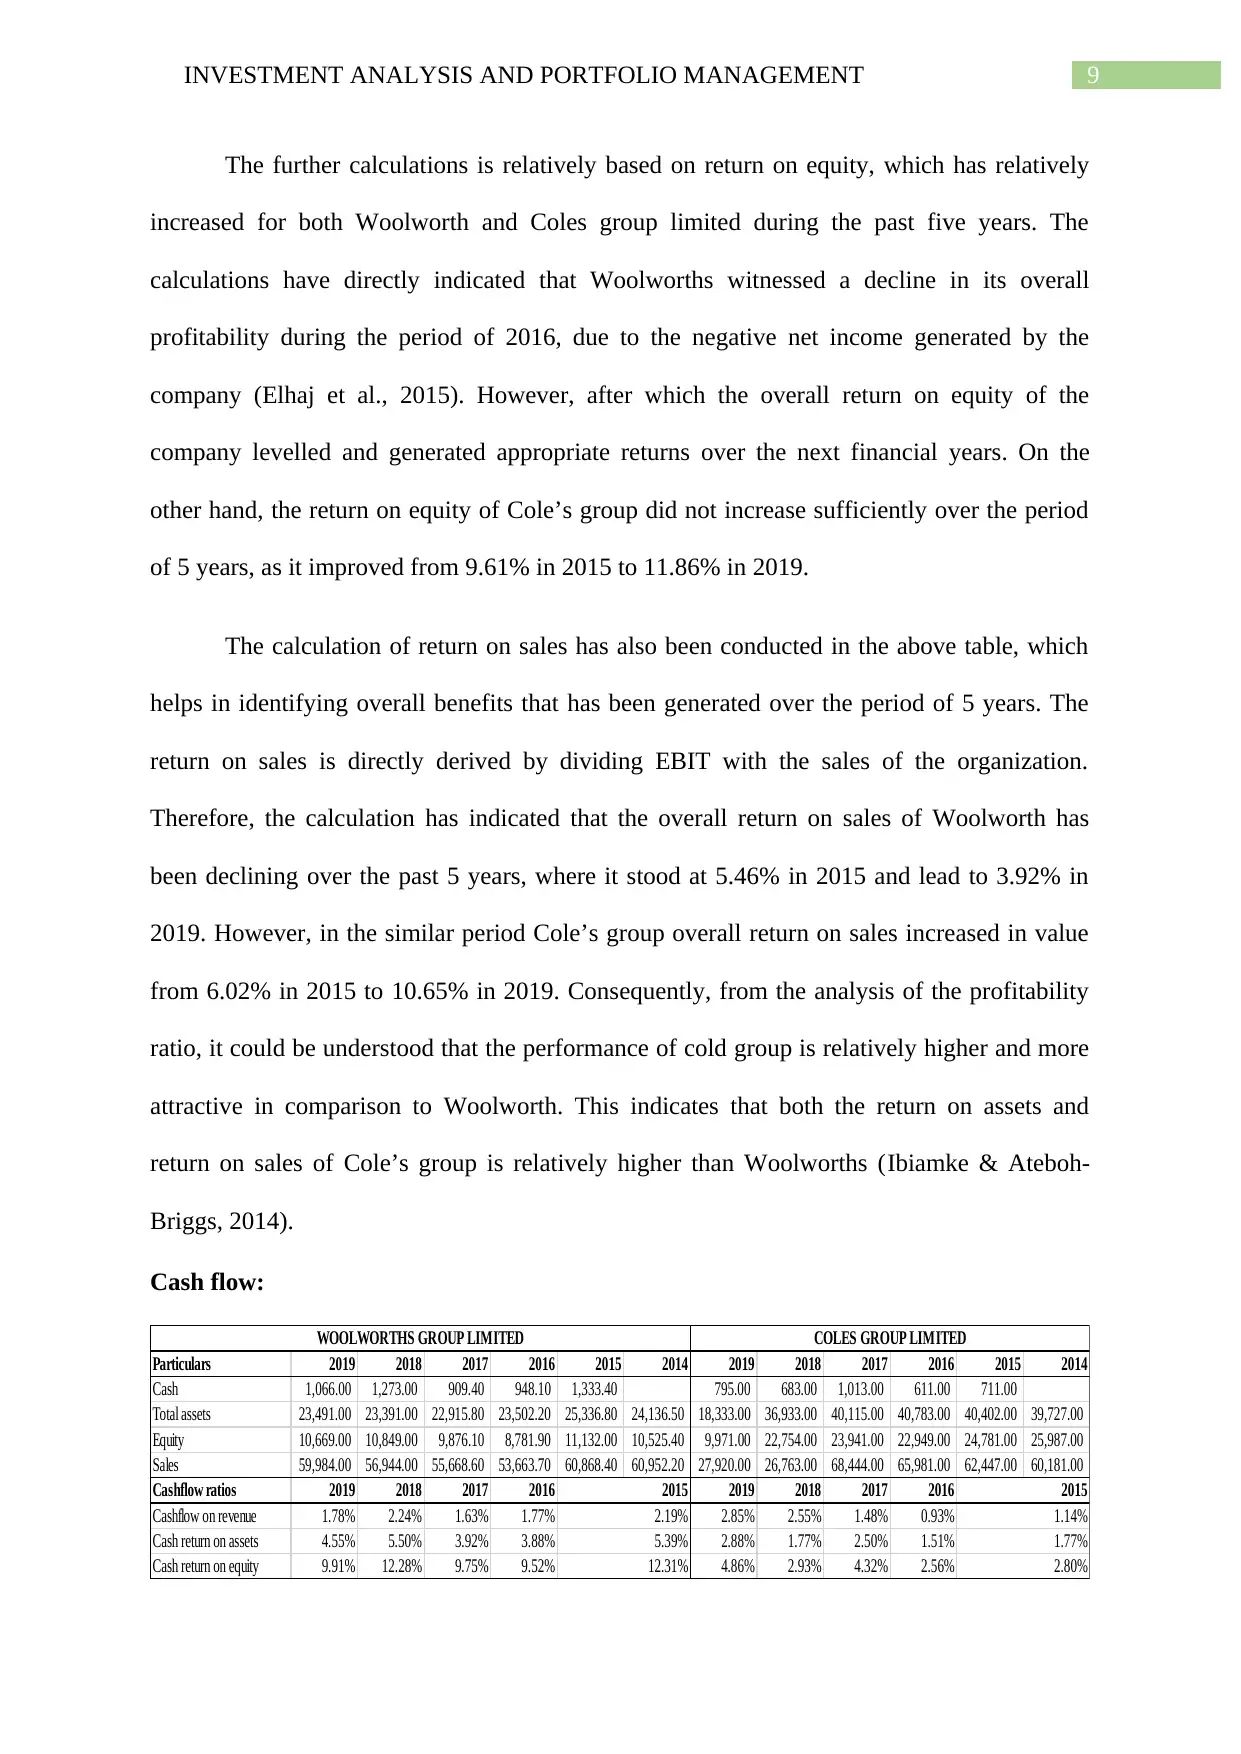
The further calculations is relatively based on return on equity, which has relatively
increased for both Woolworth and Coles group limited during the past five years. The
calculations have directly indicated that Woolworths witnessed a decline in its overall
profitability during the period of 2016, due to the negative net income generated by the
company (Elhaj et al., 2015). However, after which the overall return on equity of the
company levelled and generated appropriate returns over the next financial years. On the
other hand, the return on equity of Cole’s group did not increase sufficiently over the period
of 5 years, as it improved from 9.61% in 2015 to 11.86% in 2019.
The calculation of return on sales has also been conducted in the above table, which
helps in identifying overall benefits that has been generated over the period of 5 years. The
return on sales is directly derived by dividing EBIT with the sales of the organization.
Therefore, the calculation has indicated that the overall return on sales of Woolworth has
been declining over the past 5 years, where it stood at 5.46% in 2015 and lead to 3.92% in
2019. However, in the similar period Cole’s group overall return on sales increased in value
from 6.02% in 2015 to 10.65% in 2019. Consequently, from the analysis of the profitability
ratio, it could be understood that the performance of cold group is relatively higher and more
attractive in comparison to Woolworth. This indicates that both the return on assets and
return on sales of Cole’s group is relatively higher than Woolworths (Ibiamke & Ateboh-
Briggs, 2014).
Cash flow:
Particulars 2019 2018 2017 2016 2015 2014 2019 2018 2017 2016 2015 2014
Cash 1,066.00 1,273.00 909.40 948.10 1,333.40 795.00 683.00 1,013.00 611.00 711.00
Total assets 23,491.00 23,391.00 22,915.80 23,502.20 25,336.80 24,136.50 18,333.00 36,933.00 40,115.00 40,783.00 40,402.00 39,727.00
Equity 10,669.00 10,849.00 9,876.10 8,781.90 11,132.00 10,525.40 9,971.00 22,754.00 23,941.00 22,949.00 24,781.00 25,987.00
Sales 59,984.00 56,944.00 55,668.60 53,663.70 60,868.40 60,952.20 27,920.00 26,763.00 68,444.00 65,981.00 62,447.00 60,181.00
Cashflow ratios 2019 2018 2017 2016 2019 2018 2017 2016
Cashflow on revenue 1.78% 2.24% 1.63% 1.77% 2.85% 2.55% 1.48% 0.93%
Cash return on assets 4.55% 5.50% 3.92% 3.88% 2.88% 1.77% 2.50% 1.51%
Cash return on equity 9.91% 12.28% 9.75% 9.52% 4.86% 2.93% 4.32% 2.56%
COLES GROUP LIMITED
2.19% 1.14%
5.39% 1.77%
12.31% 2.80%
WOOLWORTHS GROUP LIMITED
2015 2015
Paraphrase This Document
Need a fresh take? Get an instant paraphrase of this document with our AI Paraphraser
10INVESTMENT ANALYSIS AND PORTFOLIO MANAGEMENT
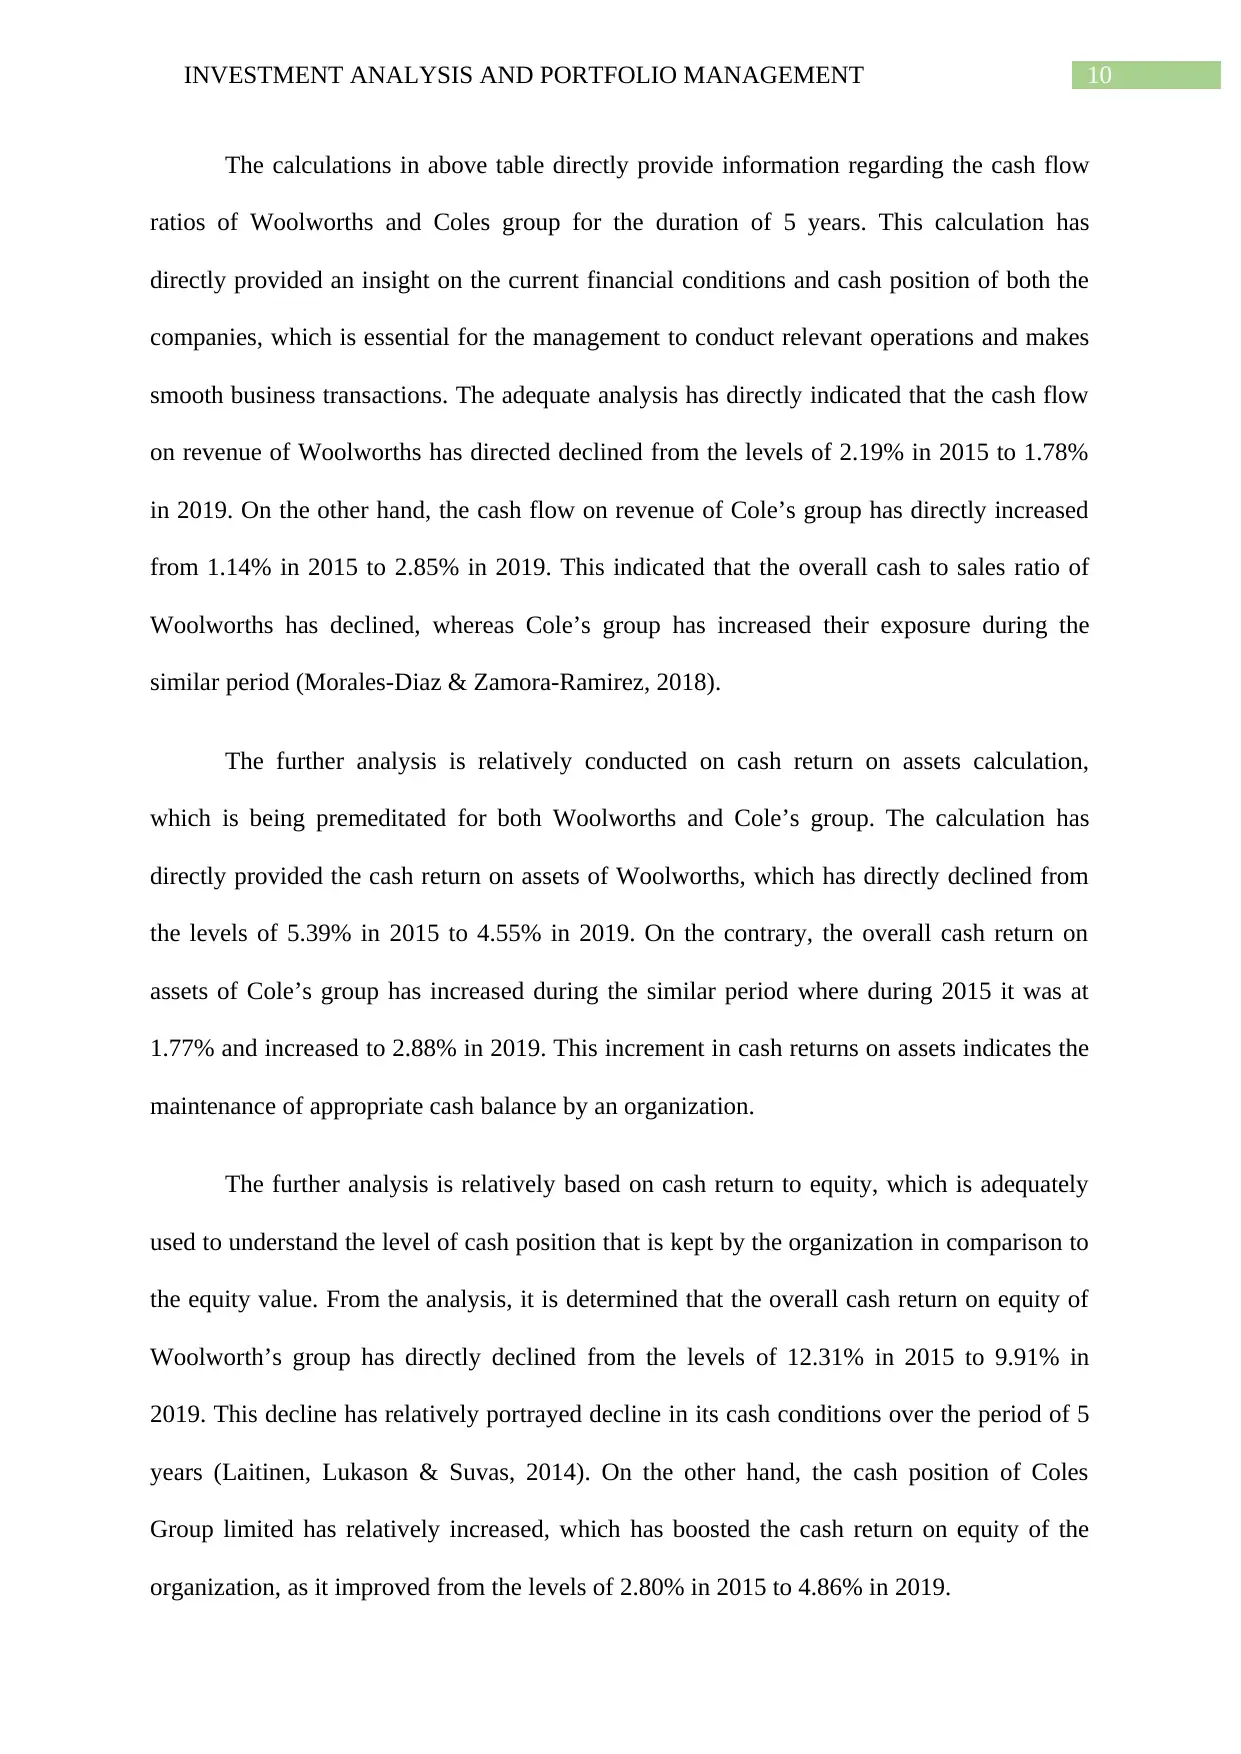
The calculations in above table directly provide information regarding the cash flow
ratios of Woolworths and Coles group for the duration of 5 years. This calculation has
directly provided an insight on the current financial conditions and cash position of both the
companies, which is essential for the management to conduct relevant operations and makes
smooth business transactions. The adequate analysis has directly indicated that the cash flow
on revenue of Woolworths has directed declined from the levels of 2.19% in 2015 to 1.78%
in 2019. On the other hand, the cash flow on revenue of Cole’s group has directly increased
from 1.14% in 2015 to 2.85% in 2019. This indicated that the overall cash to sales ratio of
Woolworths has declined, whereas Cole’s group has increased their exposure during the
similar period (Morales-Diaz & Zamora-Ramirez, 2018).
The further analysis is relatively conducted on cash return on assets calculation,
which is being premeditated for both Woolworths and Cole’s group. The calculation has
directly provided the cash return on assets of Woolworths, which has directly declined from
the levels of 5.39% in 2015 to 4.55% in 2019. On the contrary, the overall cash return on
assets of Cole’s group has increased during the similar period where during 2015 it was at
1.77% and increased to 2.88% in 2019. This increment in cash returns on assets indicates the
maintenance of appropriate cash balance by an organization.
The further analysis is relatively based on cash return to equity, which is adequately
used to understand the level of cash position that is kept by the organization in comparison to
the equity value. From the analysis, it is determined that the overall cash return on equity of
Woolworth’s group has directly declined from the levels of 12.31% in 2015 to 9.91% in
2019. This decline has relatively portrayed decline in its cash conditions over the period of 5
years (Laitinen, Lukason & Suvas, 2014). On the other hand, the cash position of Coles
Group limited has relatively increased, which has boosted the cash return on equity of the
organization, as it improved from the levels of 2.80% in 2015 to 4.86% in 2019.
11INVESTMENT ANALYSIS AND PORTFOLIO MANAGEMENT
Recommendation:
The report directly provides information on the financial ratios of both Coles Group
Limited and Woolworths Limited for the period of 5 years. The financial ratios directly
provide information and insight on the current financial conditions and trend of the
profitability, which might help in understanding their operations and future actions.
Therefore, it could be understood that Coles group limited has recently been listed in the
stock exchange of Australia after the merger of 2007. Thus, Coles Group Limited has
adequately distinguished themselves from Wesfarmers and appropriately generated revenues
in 2019. However, after being separated from Wesfarmers group, it has become the second
largest retail company in Australia after Woolworths. This depicts about the capability of
both the organizations to control the Australian retail industry.
The performance of both the companies is mainly evaluated on the basis of liquidity
ratio, profitability ratio, asset utilization ratio, cash flow ratio and leverage ratio. Therefore,
under the liquidity ratio conditions, it is detected that Cole’s group is relatively performing
higher in comparison to Woolworth’s group, as they have strong current assets in comparison
to the current liabilities. The analysis is conducted on asset utilization conditions, which has
directly been improved by Woolworths over the period of 5 years. Cole’s group limited
overall asset utilization condition has deteriorated during the past five financial years. Thus,
further analysis has mainly stated that the performance of Woolworths in more appropriate in
comparison to Coles limited on asset efficiency and cash flow ratios. On the other hand, the
performance of Cole’s group is higher in Leverage ratio, liquidity ratio and profitability
ratios.
⊘ This is a preview!⊘
Do you want full access?
Subscribe today to unlock all pages.
Trusted by 1+ million students worldwide
1 out of 16
Related Documents


Your All-in-One AI-Powered Toolkit for Academic Success.
+13062052269
info@desklib.com
Available 24*7 on WhatsApp / Email
![[object Object]](/_next/static/media/star-bottom.7253800d.svg)
Unlock your academic potential
Copyright © 2020–2026 A2Z Services. All Rights Reserved. Developed and managed by ZUCOL.