Forecasting Sales & Use Tax Revenue for Colorado Springs: Project 2018

Verified

Added on  2023/04/23

|4
|602
|477
Project
AI Summary
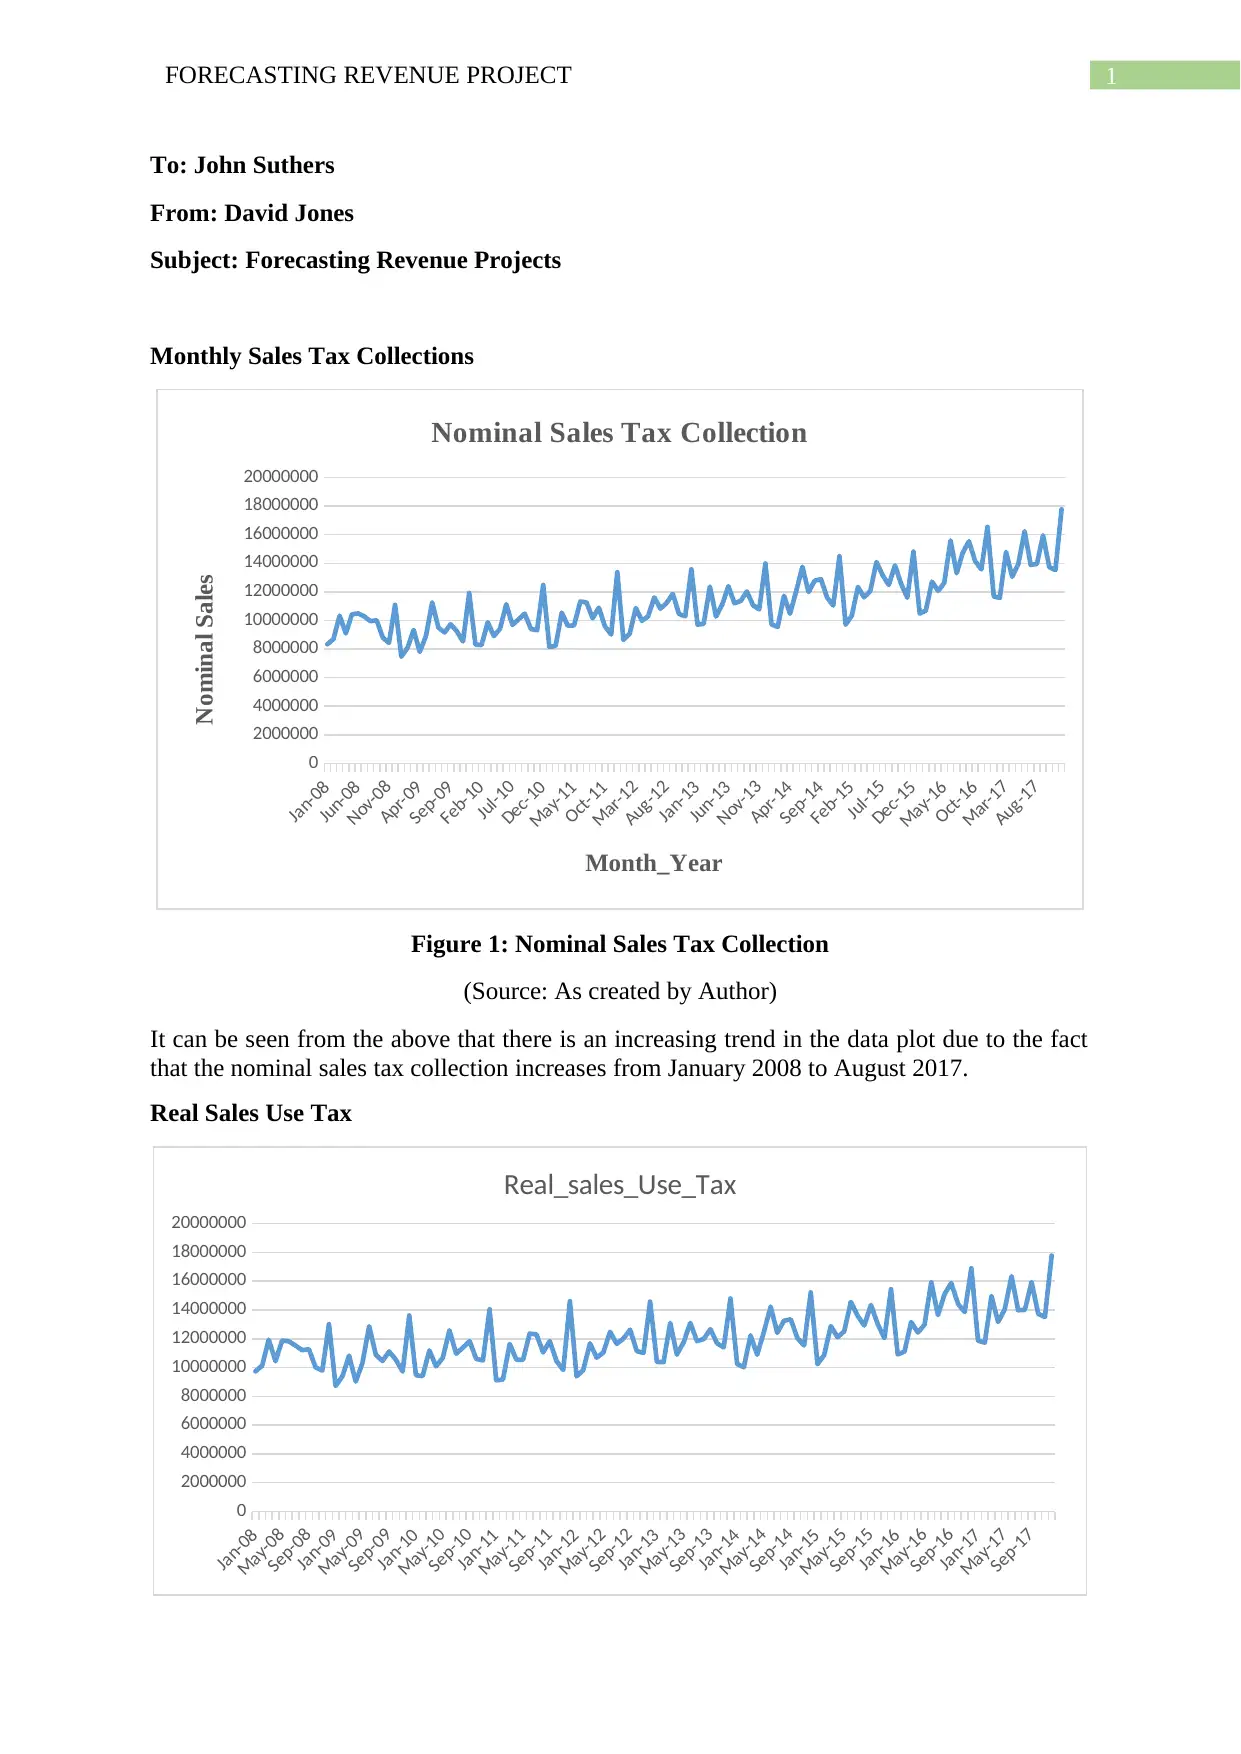
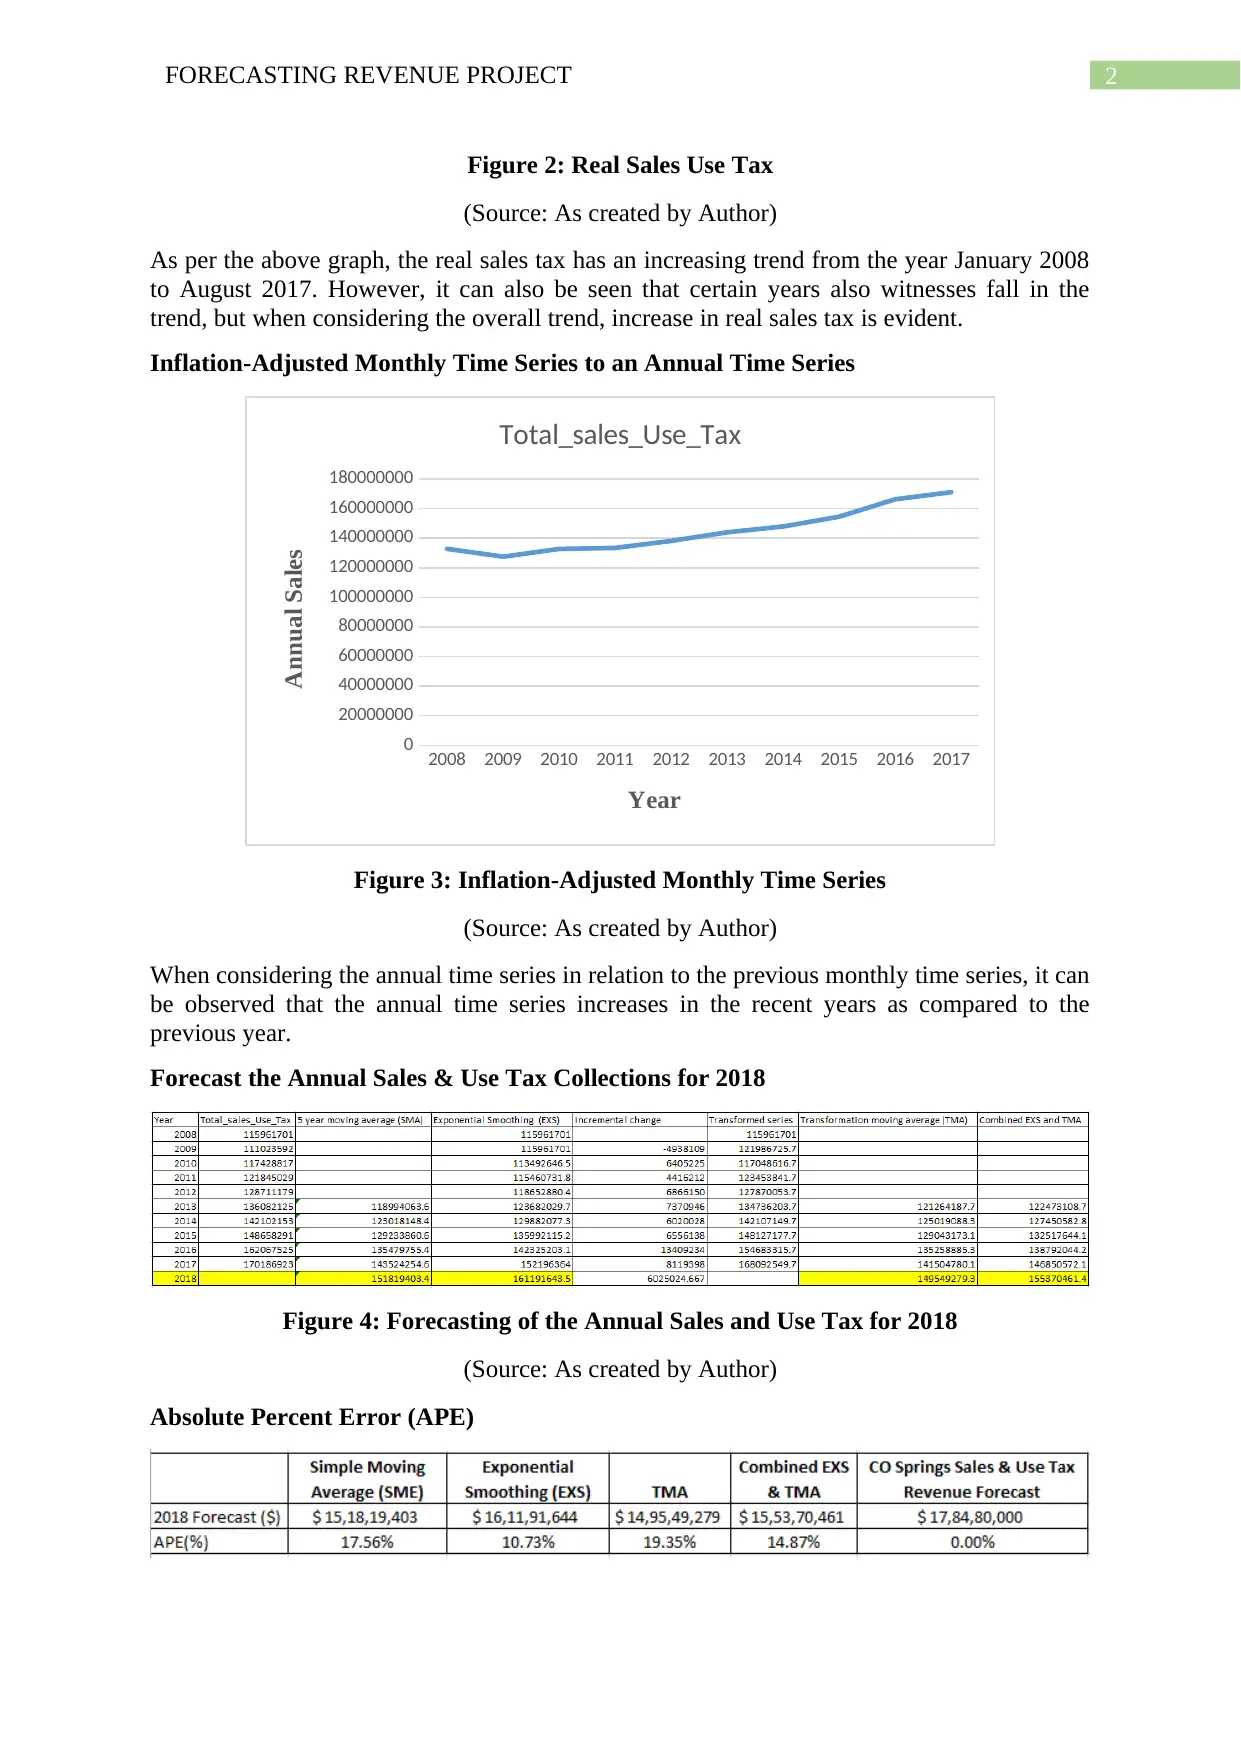
This project focuses on forecasting revenue for the City of Colorado Springs, which faced budgetary pressures and now experiences sales and use tax revenue growth. The assignment involves inflation-adjusting a time series of monthly sales and use tax collections using the Consumer Price Index (CPI-U), aggregating the monthly data to create an annual series, and forecasting the 2018 annual collections using various methods. The project also calculates measures of forecast error relative to the estimated amount reported in the 2018 Colorado Springs budget, comparing the accuracy of different forecasting techniques like exponential smoothing and simple moving average based on Absolute Percent Error (APE).
Document Page
Running head: FORECASTING REVENUE PROJECT
Forecasting Revenue Project
Name of the Student
Name of the University
Author’s Note
tabler-icon-diamond-filled.svg

Secure Best Marks with AI Grader

Need help grading? Try our AI Grader for instant feedback on your assignments.
Document Page
1FORECASTING REVENUE PROJECT
To: John Suthers
From: David Jones
Subject: Forecasting Revenue Projects
Monthly Sales Tax Collections
Jan-08
Jun-08
Nov-08
Apr-09
Sep-09
Feb-10
Jul-10
Dec-10
May-11
Oct-11
Mar-12
Aug-12
Jan-13
Jun-13
Nov-13
Apr-14
Sep-14
Feb-15
Jul-15
Dec-15
May-16
Oct-16
Mar-17
Aug-17
0
2000000
4000000
6000000
8000000
10000000
12000000
14000000
16000000
18000000
20000000
Nominal Sales Tax Collection
Month_Year
Nominal Sales
Figure 1: Nominal Sales Tax Collection
(Source: As created by Author)
It can be seen from the above that there is an increasing trend in the data plot due to the fact
that the nominal sales tax collection increases from January 2008 to August 2017.
Real Sales Use Tax
Jan-08
May-08
Sep-08
Jan-09
May-09
Sep-09
Jan-10
May-10
Sep-10
Jan-11
May-11
Sep-11
Jan-12
May-12
Sep-12
Jan-13
May-13
Sep-13
Jan-14
May-14
Sep-14
Jan-15
May-15
Sep-15
Jan-16
May-16
Sep-16
Jan-17
May-17
Sep-17
0
2000000
4000000
6000000
8000000
10000000
12000000
14000000
16000000
18000000
20000000
Real_sales_Use_Tax
Document Page
2FORECASTING REVENUE PROJECT
Figure 2: Real Sales Use Tax
(Source: As created by Author)
As per the above graph, the real sales tax has an increasing trend from the year January 2008
to August 2017. However, it can also be seen that certain years also witnesses fall in the
trend, but when considering the overall trend, increase in real sales tax is evident.
Inflation-Adjusted Monthly Time Series to an Annual Time Series
2008 2009 2010 2011 2012 2013 2014 2015 2016 2017
0
20000000
40000000
60000000
80000000
100000000
120000000
140000000
160000000
180000000
Total_sales_Use_Tax
Year
Annual Sales
Figure 3: Inflation-Adjusted Monthly Time Series
(Source: As created by Author)
When considering the annual time series in relation to the previous monthly time series, it can
be observed that the annual time series increases in the recent years as compared to the
previous year.
Forecast the Annual Sales & Use Tax Collections for 2018
Figure 4: Forecasting of the Annual Sales and Use Tax for 2018
(Source: As created by Author)
Absolute Percent Error (APE)
Document Page
3FORECASTING REVENUE PROJECT
Figure 5: Absolute Present Error (APE)
(Source: As created by Author)
As per the above table, the technique of exponential smoothing is the most accurate technique
for the determination of APE due to the fact that the gap is minimum between the revenue
forecasts.
The main reason behind considering this technique is that the difference between the
forecasted revenue is minimum here.
Due to the stop in the economic activity, there will be decrease in sales and revenue in
Colorado Spring. This will require the change in most accurate technique. In this case,
Simple Moving Average would be most accurate due to minimum time lag.
chevron_up_icon
1 out of 4
circle_padding
hide_on_mobile
zoom_out_icon
[object Object]